Review
. 2016 Apr;15(4):420-33.
doi: 10.1016/S1474-4422(15)00383-X. Epub 2016 Feb 24.

Brain imaging in the assessment for epilepsy surgery

Affiliations
Review

Brain imaging in the assessment for epilepsy surgery

John S Duncan et al. Lancet Neurol. 2016 Apr.

Abstract

Brain imaging has a crucial role in the presurgical assessment of patients with epilepsy. Structural imaging reveals most cerebral lesions underlying focal epilepsy. Advances in MRI acquisitions including diffusion-weighted imaging, post-acquisition image processing techniques, and quantification of imaging data are increasing the accuracy of lesion detection. Functional MRI can be used to identify areas of the cortex that are essential for language, motor function, and memory, and tractography can reveal white matter tracts that are vital for these functions, thus reducing the risk of epilepsy surgery causing new morbidities. PET, SPECT, simultaneous EEG and functional MRI, and electrical and magnetic source imaging can be used to infer the localisation of epileptic foci and assist in the design of intracranial EEG recording strategies. Progress in semi-automated methods to register imaging data into a common space is enabling the creation of multimodal three-dimensional patient-specific datasets. These techniques show promise for the demonstration of the complex relations between normal and abnormal structural and functional data and could be used to direct precise intracranial navigation and surgery for individual patients.


Conflict of interest statement

Declaration of interests

JSD has received personal fees from Eisai and non-financial support from Medtronic and has a patent pending for computer-assisted planning for neurosurgery. MJK has received personal fees from General Electric for PET tracer development, and from UCB, BIAL, and Eisai for antiepileptic drug development. SO has received grants from General Electric, Siemens, IXICO, MIRADA Medical, and IcoMetrix, and has a patent pending for computer-assisted planning for neurosurgery. GPW declares no competing interests.

Figures
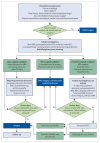
Figure 1
Figure 1. The pathways of assessment for epilepsy surgery, showing the place of brain imaging
18F-FDG=18F-fluorodeoxyglucose. EEG=electroencephalography. MEG=magnetoencephalography. Adapted from Duncan, by permission of Elsevier.
Figure 2
Figure 2. MRI acquisition protocols for the identification of structural cerebral abnormalities in epilepsy
Focal cortical dysplasia with cortical thickening and a blurred grey–white matter junction (circled) on (A) T1-weighted imaging and (B) with high signal intensity on T2-weighted FLAIR imaging. Right hippocampal sclerosis with volume loss (circled) on (C) T1-weighted imaging, (D) with high signal intensity on T2-weighted FLAIR imaging, and (E) with loss of internal architecture on T2-weighted PROPELLER imaging. (F) A cavernoma in the left inferior temporal gyrus (circled) can be seen clearly as an area of signal dropout on T2*-weighted images. (G) Application of a voxel-based image post-processing method to T1-weighted three-dimensional MRI data from a 38-year-old woman enabled enhanced visualisation of focal cortical dysplasia on the resulting junction image (blurred grey–white matter junction) and extension image (grey matter extending abnormally into white matter). The corresponding slice is shown on the original T1-weighted image. (A–F) were acquired on a 3 T scanner with (A, C) a three-dimensional fast spoiled gradient echo T1-weighted sequence (0.9375 × 0.9375 mm in-plane resolution, 1·1 mm slice thickness), (B) an axial and (D) an oblique coronal T2-weighted FLAIR sequence (0·9375 × 0·9375 mm in-plane resolution, 5 mm slice thickness), (E) a coronal oblique T2-weighted PROPELLER sequence (0·43 × 0·43mm in-plane resolution, 2 mm slice thickness), and (F) a coronal fast gradient recalled echo T2*-weighted sequence (0·9375 × 0·9375 mm in-plane resolution, 5 mm slice thickness). For all images, left side of image=right side of brain. FLAIR=fluid-attenuated inversion recovery. PROPELLER=periodically rotated overlapping parallel lines with enhanced reconstruction. Panel G adapted from Huppertz and colleagues, by permission of Elsevier.
Figure 3
Figure 3. Neurite orientation dispersion and density imaging for the detection of focal cortical dysplasia
A 27-year-old male with focal cortical dysplasia in the left inferior temporal gyrus. The area (circled) is defined poorly on structural images including volumetric T1-weighted (A) and T2-weighted coronal oblique (B) images and on standard diffusion images including fractional anisotropy (C) and mean diffusivity (D) maps. Focal cortical dysplasia is easily visible as a reduced intracellular volume fraction on neurite orientation dispersion and density imaging, an advanced diffusion MRI sequence (E). Reproduced from Winston and colleagues.
Figure 4
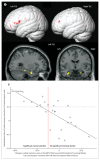
Figure 4. Functional MRI for prediction of changes in verbal memory after temporal lobe surgery
(A) Correlations between functional MRI activation in response to words remembered and postoperative verbal memory decline in patients with left TLE (n=23) and right TLE (n=27). In patients with both left TLE and right TLE, the surface-rendered whole-brain images (upper panel) show that left frontal activations were significantly correlated with greater postoperative verbal memory decline. No correlation was found in the right hemisphere in patients with left or right TLE. The sliced images (lower panel) show that predominantly left medial temporal lobe activations were significantly correlated with greater postoperative verbal memory decline in patients with left TLE. A similar correlation was not found for patients with right TLE. (B) Correlation of individual lateralisation indices for words remembered in the frontotemporal region (using an anatomical mask) in patients with left TLE (n=23) with change in list learning 4 months after left anterior temporal lobe resection (R2=0·43). Each circle represents one patient. The vertical red line shows the level of significant decline calculated by the reliable change index using control data. The horizontal dashed line shows a lateralisation index of 0·5 (left>right), with scores of ≥0·5 indicative of strong left lateralisation. Seven of eight patients who experienced a significant verbal memory decline had a lateralisation index of at least 0·5, which was the strongest predictor of postoperative verbal memory decline. TLE=temporal lobe epilepsy. Reproduced from Sidhu and colleagues, by permission of Wolters Kluwer Health.
Figure 5
Figure 5. Optic radiation tractography for surgical guidance
(A) Optic radiation tractography data can be superimposed on the coronal fluid-attenuated inversion recovery MRI scan to show the relation with a cavernoma to aid surgical planning and (B) can also be displayed in three-dimensional renderings. Panels A and B reproduced from Winston and colleagues, by permission of John Wiley & Sons. (C) Tractography data can then be displayed on the operating microscope display in real time for surgical guidance. Panel C adapted from Winston and colleagues, by permission of Wolters Kluwer Health.
Figure 6
Figure 6. 18F-fluorodeoxyglucose PET imaging for the localisation of epileptogenic brain regions in MRI-negative focal epilepsy
18F-fluorodeoxyglucose PET scan showing left temporal hypometabolism in a 32-year-old man with normal MRI and left temporal lobe epilepsy (A, axial slice; B, coronal slice). (C) Results of a statistical voxel-based comparison of surface-rendered glucose uptake in the patient, compared with a set of control data (using Neurostat-3D SSP software). An area of hypometabolism (green) is evident in the left temporal lobe (right panel). The patient became seizure free after left temporal lobe resection. Reproduced from Rathore and colleagues, by permission of Elsevier.
Figure 7
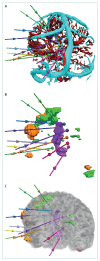
Figure 7. Integration of multimodal three-dimensional imaging in the epilepsy surgery pathway
Stereo-EEG implantation plan. Each electrode is depicted in a separate colour. All images are taken from the left posteriolateral direction. (A) Veins (blue) extracted from gadolinium-enhanced T1-weighted MRI and arteries (red) extracted from CT angiogram. (B) A lesion identified from T2-weighted FLAIR MRI (purple) and motor (green) and language (orange) regions identified from functional MRI. (C) The lesion and motor and language regions in (B) are shown on a volume-rendered T1-weighted MRI. FLAIR=fluid-attenuated inversion recovery.

References

    1. NICE. NICE guideline [CG137] London: National Institute for Health and Care Excellence; 2012. Epilepsies: diagnosis and management. - PubMed
    1. Jobst BC, Cascino GD. Resective epilepsy surgery for drug-resistant focal epilepsy: a review. JAMA. 2015;313:285–93. - PubMed
    1. Duncan JS. Imaging and epilepsy. Brain. 1997;120:339–78. - PubMed
    1. Duncan JS. Selecting patients for epilepsy surgery: synthesis of data. Epilepsy Behav. 2011;20:230–32. - PubMed
    1. Téllez-Zenteno JF, Hernández Ronguillo L, Moien-Afshari F, Wiebe S. Surgical outcomes in lesional and non-lesional epilepsy: a systematic review and meta-analysis. Epilepsy Res. 2010;89:310–18. - PubMed

Publication types

MeSH terms