. 2016 Apr 7;44(6):2514-27.
doi: 10.1093/nar/gkw126. Epub 2016 Feb 28.

Synergistic action of master transcription factors controls epithelial-to-mesenchymal transition

Affiliations

Synergistic action of master transcription factors controls epithelial-to-mesenchymal transition

Hongyuan Chang et al. Nucleic Acids Res. .

Abstract

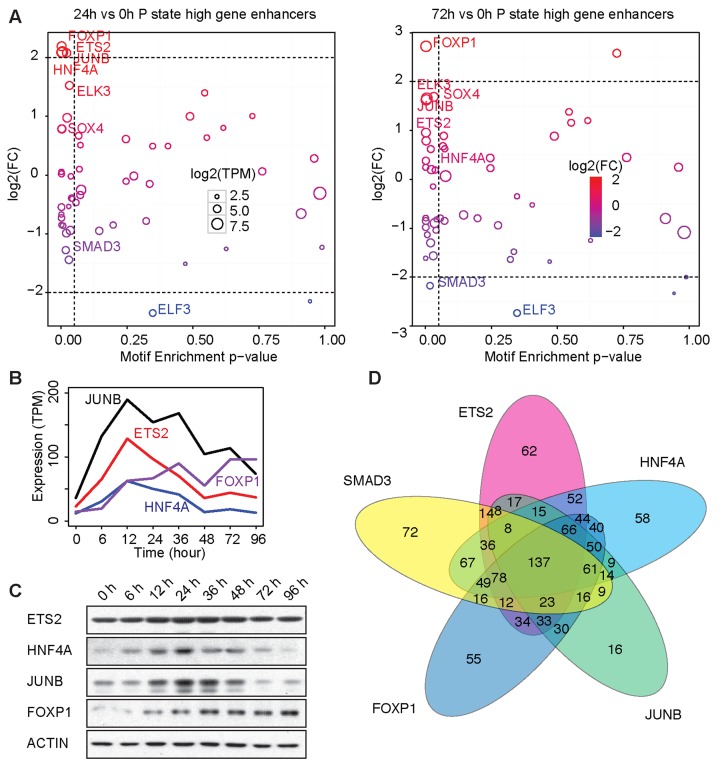
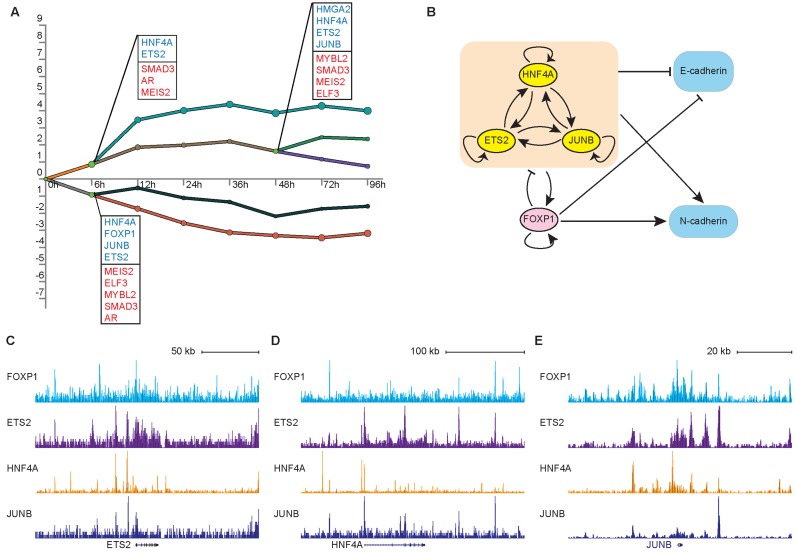
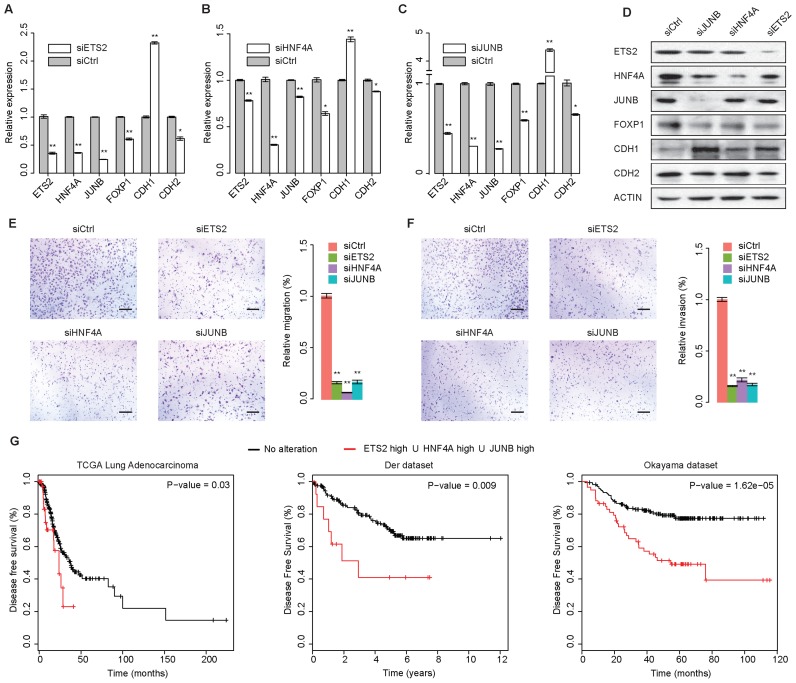
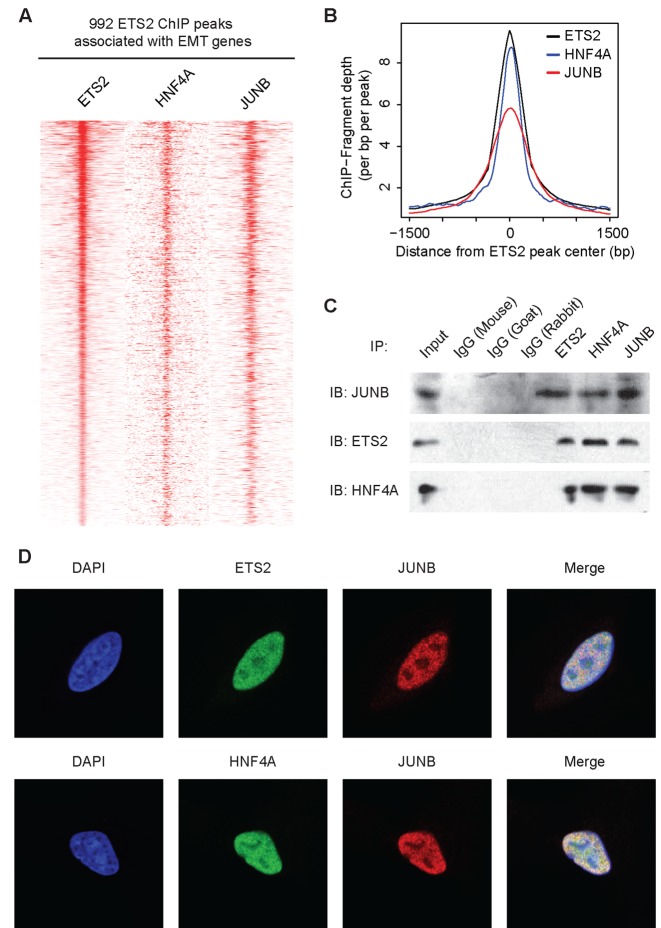
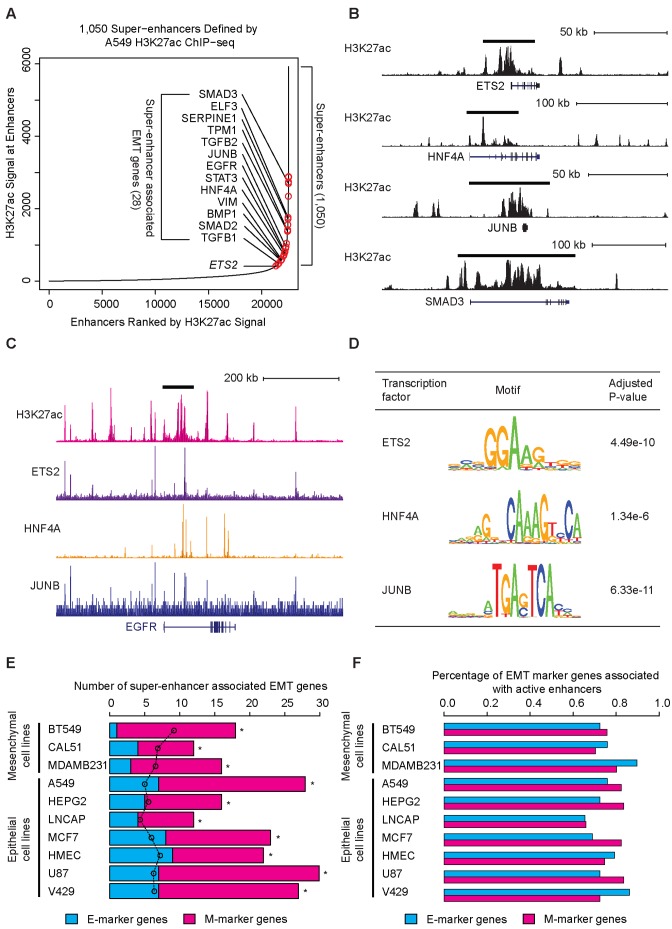
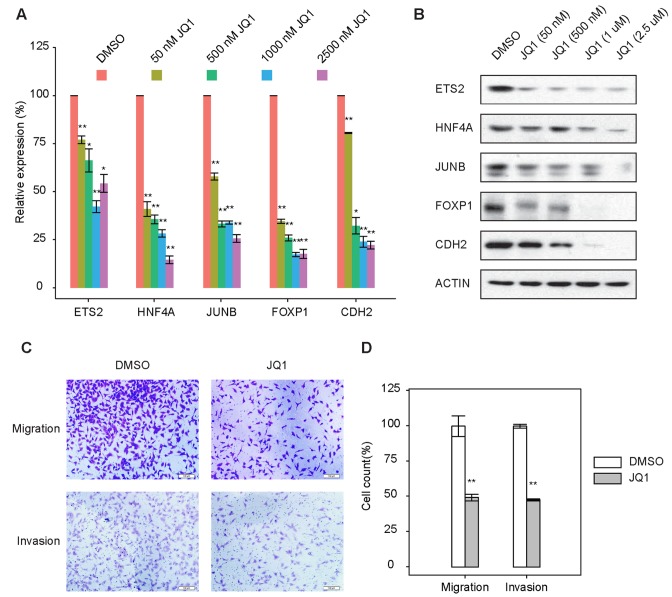
Epithelial-to-mesenchymal transition (EMT) is a complex multistep process in which phenotype switches are mediated by a network of transcription factors (TFs). Systematic characterization of all dynamic TFs controlling EMT state transitions, especially for the intermediate partial-EMT state, represents a highly relevant yet largely unexplored task. Here, we performed a computational analysis that integrated time-course EMT transcriptomic data with public cistromic data and identified three synergistic master TFs (ETS2, HNF4A and JUNB) that regulate the transition through the partial-EMT state. Overexpression of these regulators predicted a poor clinical outcome, and their elimination readily abolished TGF-β-induced EMT. Importantly, these factors utilized a clique motif, physically interact and their cumulative binding generally characterized EMT-associated genes. Furthermore, analyses of H3K27ac ChIP-seq data revealed that ETS2, HNF4A and JUNB are associated with super-enhancers and the administration of BRD4 inhibitor readily abolished TGF-β-induced EMT. These findings have implications for systematic discovery of master EMT regulators and super-enhancers as novel targets for controlling metastasis.


Figures

Figure 1.
Figure 1.
Time-course transcriptome analysis reveals dynamics of EMT gene expression program. (A) Heatmap of the time-course gene expression data for A549 cells undergoing TGF-β-induced EMT. The differentially expressed genes are separated into three clusters. Representative EMT genes are indicated. (B) Gene Ontology terms enriched in the three clusters of genes that were differentially expressed during TGF-β-induced EMT.
Figure 2.
Figure 2.
Integrative analysis identified ETS2, HNF4A, JUNB and FOXP1 as the putative master TFs of EMT. (A) Enrichment P -values of TF binding motifs in the proximal enhancers of partial-EMT high genes (x-axis) were plotted against the fold changes in gene expression during EMT (y-axis; 24 h versus 0 h, left panel; 72 h versus 0 h, right panel). Each circle represents a TF. The dotted lines represent the cutoff for the enrichment (P -value < 0.05) and the expression change (absolute fold change ≥ 4). (B) Levels of ETS2, HNF4A, JUNB and FOXP1 mRNA during EMT as estimated using RNA-seq. (C) Immunoblots showing the levels of ETS2, HNF4A, JUNB and FOXP1 proteins during EMT. (D) Venn diagram showing the overlap of the targets of the five EMT TFs derived from published ChIP-seq data.
Figure 3.
Figure 3.
ETS2, HNF4A and JUNB are key regulators in a dynamic EMT Gene Regulatory Network model. (A) DREM output showing a dynamic gene regulatory map of EMT. The y-axis shows the levels of gene expression normalized to those at 0 h. Each line represents a path (cluster) of genes with a similar expression pattern, and nodes represent the hidden states of a hidden Markov model. The green nodes represent splitting points. For each splitting point, TFs with a split score < 0.001 were listed in ranked order of scores and were colored according to the expression level changes (blue for upregulation; red for downregulation). (B) Diagram illustrating the putative core regulatory network derived from DREM analysis. (C) Genome browser representation of ETS2, HNF4A, JUNB and FOXP1 binding events near ETS2 gene. (D) Same as (C) for HNF4A gene. (E) Same as (C) for JUNB gene.
Figure 4.
Figure 4.
ETS2, HNF4A and JUNB play critical roles in partial-EMT. (A) Quantitative reverse transcription polymerase chain reaction results showing the levels of gene expression in A549 cells during TGF-β-induced EMT after silencing ETS2 expression using a specific siRNA. n = 3; error bars indicate mean ± SD. * P < 0.05; ** P < 0.01, determined using the two-tailed Student's t-test. (B) Same as (C) for silencing HNF4A. (C) Same as (A) for silencing JUNB. (D) Immunoblotting analysis of the protein abundance of indicated genes in A549 cells undergoing EMT treated with siRNAs targeting ETS2, HNF4A or JUNB. (E) A549 cells undergoing TGF-β-induced EMT were treated with siRNAs targeting ETS2, HNF4A or JUNB and were subjected to a migration assay. The migratory cells were quantified (bar charts). Scale bars: 100 μm. n = 6; error bars indicate mean ± SD. * P < 0.05; ** P < 0.01, determined using the two-tailed Student's t-test. (F) Same as (E) for the invasion assay. (G) Kaplan–Meier survival analysis based on the ETS2, HNF4A and JUNB expression levels in three independent Lung Adenocarcinoma data sets for disease-free survival.
Figure 5.
Figure 5.
ETS2, HNF4A and JUNB are synergistic master regulators of EMT. (A) Heatmap showing the colocalization of ETS2, HNF4A and JUNB at EMT-associated enhancers. The presence of ETS2, HNF4A and JUNB ChIP-seq peaks are displayed within a 6-kb window centered on the ETS2-bound site. (B) Summary plot for the ETS2, HNF4A and JUNB ChIP-seq peak enrichment across the ETS2-binding site associated with EMT genes. (C) Endogenous association of ETS2, HNF4A and JUNB. At 24 h into TGF-β-induced EMT, A549 cell lysates were prepared and were immunoprecipitated using the indicated antibody. The presence of associated proteins was then analyzed using immunoblotting. (D) Immunofluorescence staining for ETS2, HNF4A or JUNB in A549 cells stimulated with TGF-β for 24 h.
Figure 6.
Figure 6.
Super-enhancers are associated with master EMT regulators. (A) The distribution of A549 H3K27ac tag intensities revealed 1050 super-enhancers. The red circles indicate EMT genes associated with super-enhancers. (B) Genome browser tracks showing the super-enhancers associated with ETS2, HNF4A, JUNB and SMAD3. The black bars denote super-enhancers. (C) Genome browser tracks showing super-enhancers associated with the EGFR gene and the binding events of ETS2, HNF4A and JUNB around EGFR gene. (D) Table depicting the enrichment of ETS2, HNF4a and JUNB binding motifs in EMT-associated super-enhancers relative to the genomic background. (E) Bar plots showing the enriched association of EMT genes with super-enhancers. Bars represent the observed number of super-enhancer-associated EMT genes and circles represent the expected number of super-enhancer-associated genes assuming no enrichment. * P < 0.001, determined using Fisher's Exact Test. (F) Bar plots showing the universal association of EMT genes with active enhancers. Bars represent the observed percentages of active-enhancer-associated EMT genes.
Figure 7.
Figure 7.
BRD4 inhibitor abolishes TGF-β-induced EMT. (A) Quantitative reverse transcription polymerase chain reaction results showing the expression levels of indicated genes in A549 cells undergoing EMT that were treated with various concentrations of JQ1. n = 3; error bars indicate mean ± SD. * P < 0.05; ** P < 0.01, as determined using the two-tailed Student's t-test. DMSO, dimethylsulphoxide. (B) Immunoblotting analysis of the expression levels of indicated genes in A549 cells undergoing EMT that were treated with various concentrations of JQ1. (C) A549 cells undergoing TGF-β-induced EMT were treated with 500 nM JQ1 (left panels) or the DMSO control (right panel) and were subjected to a migration assay (top panels) or an invasion assay (bottom panels). (D) The migratory or invasive cells were quantified (bar charts). Scale bars: 100 μm. n = 6; error bars indicate mean ± SD. * P < 0.05; ** P < 0.01, determined using the two-tailed Student's t-test.

References

    1. De Craene B., Berx G. Regulatory networks defining EMT during cancer initiation and progression. Nat. Rev. Cancer. 2013;13:97–110. - PubMed
    1. Lamouille S., Xu J., Derynck R. Molecular mechanisms of epithelial-mesenchymal transition. Nat. Rev. Mol. Cell Biol. 2014;15:178–196. - PMC - PubMed
    1. Thiery J.P., Acloque H., Huang R.Y., Nieto M.A. Epithelial-mesenchymal transitions in development and disease. Cell. 2009;139:871–890. - PubMed
    1. Yang J., Weinberg R.A. Epithelial-mesenchymal transition: at the crossroads of development and tumor metastasis. Dev. Cell. 2008;14:818–829. - PubMed
    1. Garber K. Epithelial-to-mesenchymal transition is important to metastasis, but questions remain. J. Natl. Cancer Inst. 2008;100:232–233. - PubMed

Publication types

MeSH terms