

Fetal in vivo continuous cardiovascular function during chronic hypoxia
- PMID: 26926316
- PMCID: PMC4771786
- DOI: 10.1113/JP271091
Fetal in vivo continuous cardiovascular function during chronic hypoxia
Abstract
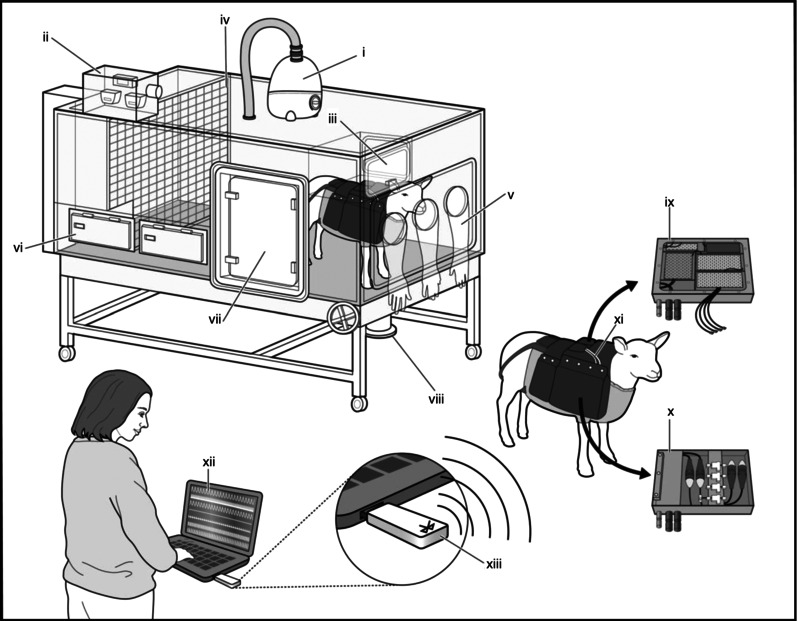
Although the fetal cardiovascular defence to acute hypoxia and the physiology underlying it have been established for decades, how the fetal cardiovascular system responds to chronic hypoxia has been comparatively understudied. We designed and created isobaric hypoxic chambers able to maintain pregnant sheep for prolonged periods of gestation under controlled significant (10% O2) hypoxia, yielding fetal mean P(aO2) levels (11.5 ± 0.6 mmHg) similar to those measured in human fetuses of hypoxic pregnancy. We also created a wireless data acquisition system able to record fetal blood flow signals in addition to fetal blood pressure and heart rate from free moving ewes as the hypoxic pregnancy is developing. We determined in vivo longitudinal changes in fetal cardiovascular function including parallel measurement of fetal carotid and femoral blood flow and oxygen and glucose delivery during the last third of gestation. The ratio of oxygen (from 2.7 ± 0.2 to 3.8 ± 0.8; P < 0.05) and of glucose (from 2.3 ± 0.1 to 3.3 ± 0.6; P < 0.05) delivery to the fetal carotid, relative to the fetal femoral circulation, increased during and shortly after the period of chronic hypoxia. In contrast, oxygen and glucose delivery remained unchanged from baseline in normoxic fetuses. Fetal plasma urate concentration increased significantly during chronic hypoxia but not during normoxia (Δ: 4.8 ± 1.6 vs. 0.5 ± 1.4 μmol l(-1), P<0.05). The data support the hypotheses tested and show persisting redistribution of substrate delivery away from peripheral and towards essential circulations in the chronically hypoxic fetus, associated with increases in xanthine oxidase-derived reactive oxygen species.
© 2016 The Authors. The Journal of Physiology © 2016 The Physiological Society.
Figures
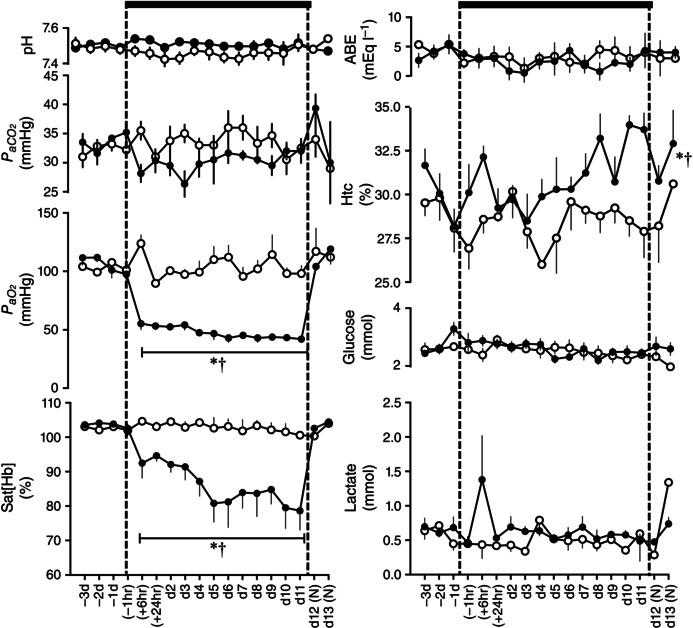
 , n = 6) pregnancy. Maternal blood gas values were corrected to 38 °C. pH, arterial pH; , arterial CO2 partial pressure; , arterial O2 partial pressure; Sat[Hb], percentage saturation of haemoglobin; ABE, acid base excess; Htc, haematocrit; Glucose, blood glucose concentration; Lactate, blood lactate concentration; (N), normoxic recovery. The x‐axis shows time in hours (hr) and days (d). Significant differences (P < 0.05): *differences indicating a significant main effect of time compared with baseline; †differences indicating a significant main effect of treatment compared with normoxic pregnancy (two‐way repeated‐measures ANOVA + Tukey test). For Htc, the comparison of slopes was achieved with the Student's t test for unpaired data.
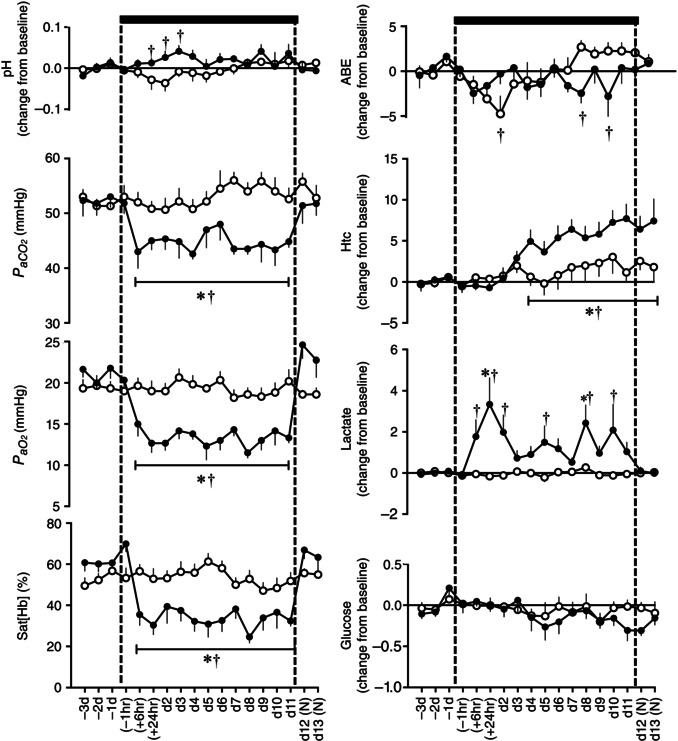 , n = 6) pregnancy. Fetal blood gas values were corrected to 39.5 °C. pH, arterial pH; , arterial CO2 partial pressure; , arterial O2 partial pressure; Sat[Hb], percentage saturation of haemoglobin; ABE, acid base excess; Htc, haematocrit; Glucose, blood glucose concentration; Lactate, blood lactate concentration; (N), normoxic recovery. The x‐axis shows time in hours (hr) and days (d). Significant differences (P < 0.05): *differences indicating a significant main effect of time compared with baseline; †differences indicating a significant main effect of treatment compared with normoxic pregnancy (two‐way repeated‐measures ANOVA + Tukey test).
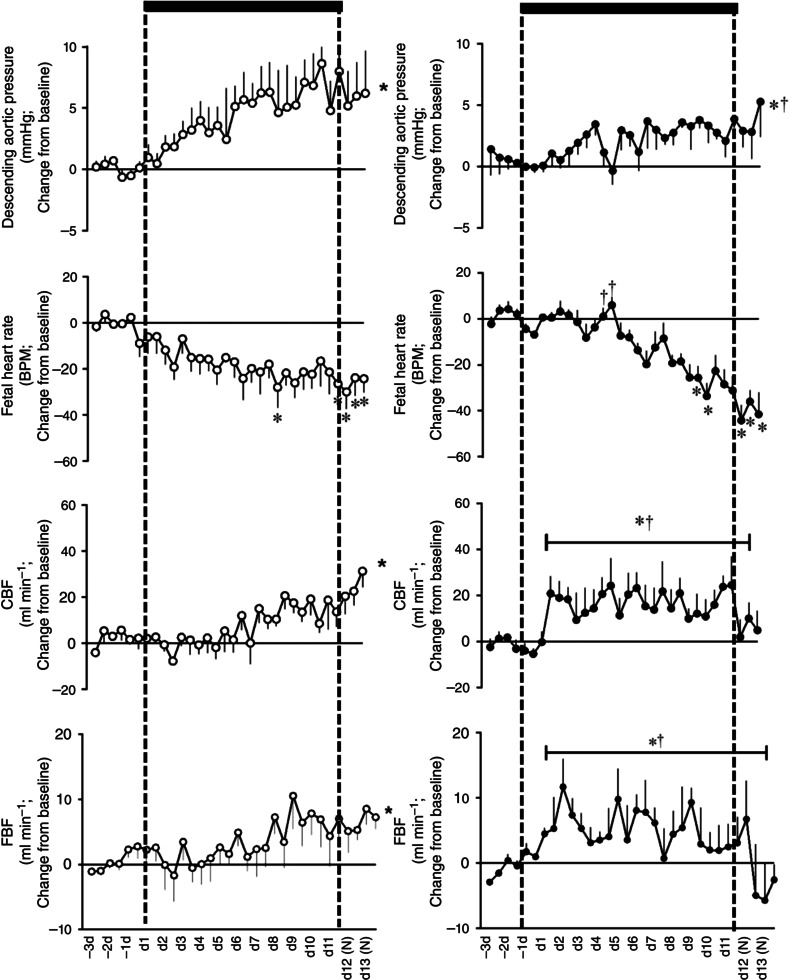 , n = 6, right) pregnancy. CBF, carotid blood flow; FBF, femoral blood flow; BPM, beats per minute; (N), normoxic recovery. The x‐axis shows time in days (d). Significant differences (P < 0.05): *differences indicating a significant main effect of time compared with baseline; †differences indicating a significant main effect of treatment compared with normoxic pregnancy (two‐way repeated‐measures ANOVA + Tukey test). For descending aortic pressure, the two‐way ANOVA represents a comparison of slopes. For FBF and CBF, the two‐way ANOVA represents a comparison of areas under the curve.
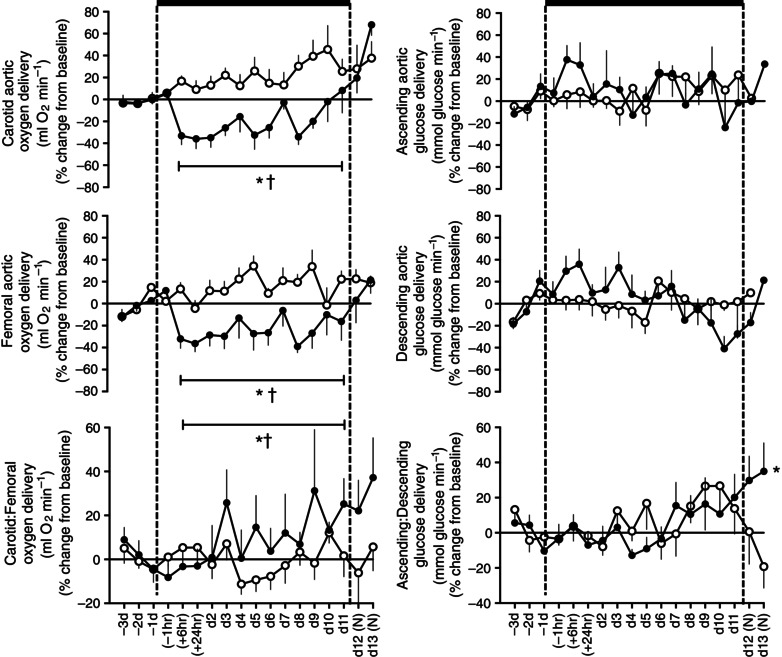 , n = 6) pregnancy. (N), normoxic recovery. The x‐axis shows time in hours (hr) and days (d). Significant differences (P < 0.05): *differences indicating a significant main effect of time compared with baseline; †differences indicating a significant main effect of treatment compared with normoxic pregnancy (two‐way repeated‐measures ANOVA + Tukey test). For the ratio of ascending/descending oxygen delivery, the two‐way ANOVA represents an analysis of the area under the curve.
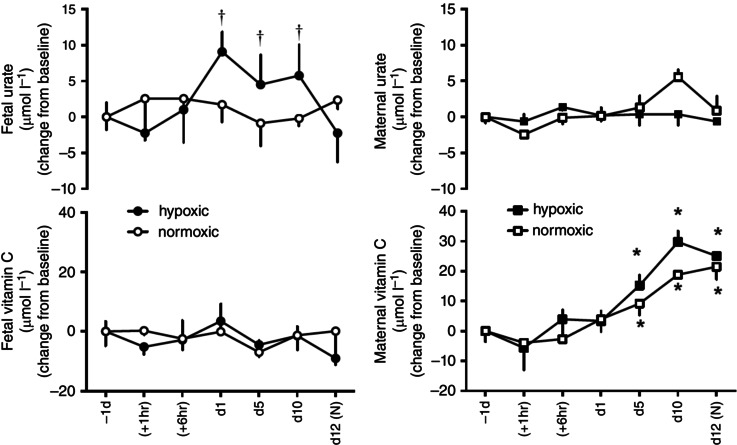 , fetus; ■, ewe; n = 6) pregnancy. (N), normoxic recovery. The x‐axis shows time in hours (hr) and days (d). Significant differences (P < 0.05): *differences indicating a significant main effect of time compared with baseline; †differences indicating a significant main effect of treatment compared with normoxic pregnancy (two‐way repeated‐measures ANOVA + Tukey test). For the fetal urate levels the two‐way ANOVA represents an analysis of the area under the curve.
References
-
- Alonso JG, Okai T, Longo LD & Gilbert RD (1989). Cardiac function during long‐term hypoxemia in fetal sheep. Am J Physiol 257, H581–H589. - PubMed
-
- Bacon BJ, Gilbert RD, Kaufmann P, Smith AD, Trevino FT & Longo LD (1984). Placental anatomy and diffusing capacity in guinea pigs following long‐term maternal hypoxia. Placenta 5, 475–487. - PubMed
-
- Banhegyi G, Braun L, Csala M, Puskas F & Mandl J (1997). Ascorbate metabolism and its regulation in animals. Free Radic Biol Med 23, 793–803. - PubMed
-
- Barker DJP (1998). Mothers, Babies, and Disease in Later Life. Churchill Livingstone, Edinburgh.
Publication types
MeSH terms
Grants and funding
- FS/12/74/29778/BHF_/British Heart Foundation/United Kingdom
- PG/10/99/28656/BHF_/British Heart Foundation/United Kingdom
- PG/14/5/30547/BHF_/British Heart Foundation/United Kingdom
- BB/E002668/1/BB_/Biotechnology and Biological Sciences Research Council/United Kingdom
- RG/11/16/29260/BHF_/British Heart Foundation/United Kingdom
LinkOut - more resources
Full Text Sources
Other Literature Sources
Medical