. 2016 Apr 1;118(7):1062-77.
doi: 10.1161/CIRCRESAHA.115.307599. Epub 2016 Feb 29.

Disruption of Glut1 in Hematopoietic Stem Cells Prevents Myelopoiesis and Enhanced Glucose Flux in Atheromatous Plaques of ApoE(-/-) Mice

Affiliations

Disruption of Glut1 in Hematopoietic Stem Cells Prevents Myelopoiesis and Enhanced Glucose Flux in Atheromatous Plaques of ApoE(-/-) Mice

Vincent Sarrazy et al. Circ Res. .

Abstract

Rationale: Inflamed atherosclerotic plaques can be visualized by noninvasive positron emission and computed tomographic imaging with (18)F-fluorodeoxyglucose, a glucose analog, but the underlying mechanisms are poorly understood.

Objective: Here, we directly investigated the role of Glut1-mediated glucose uptake in apolipoprotein E-deficient (ApoE(-/-)) mouse model of atherosclerosis.

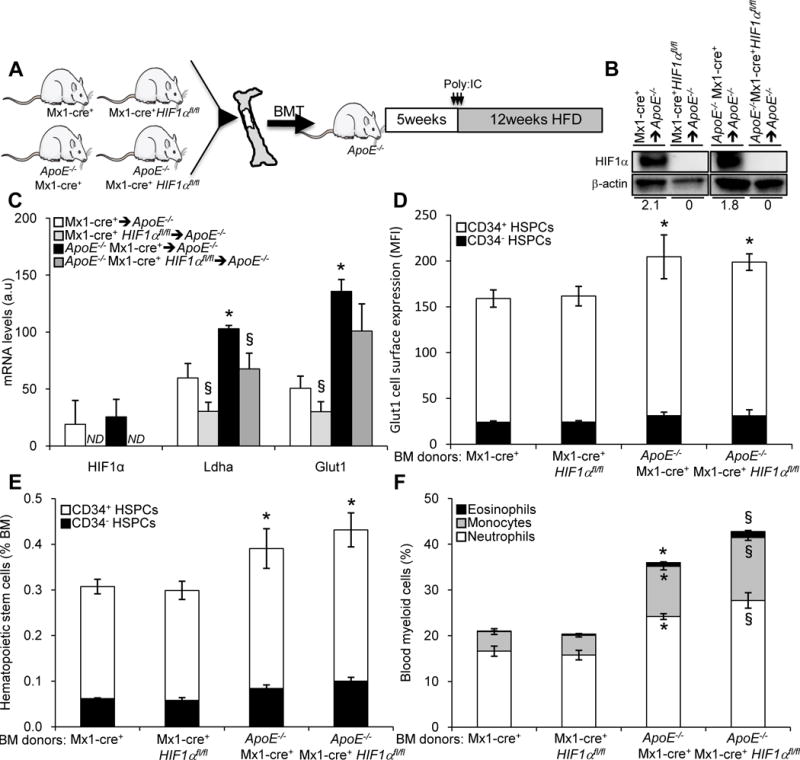
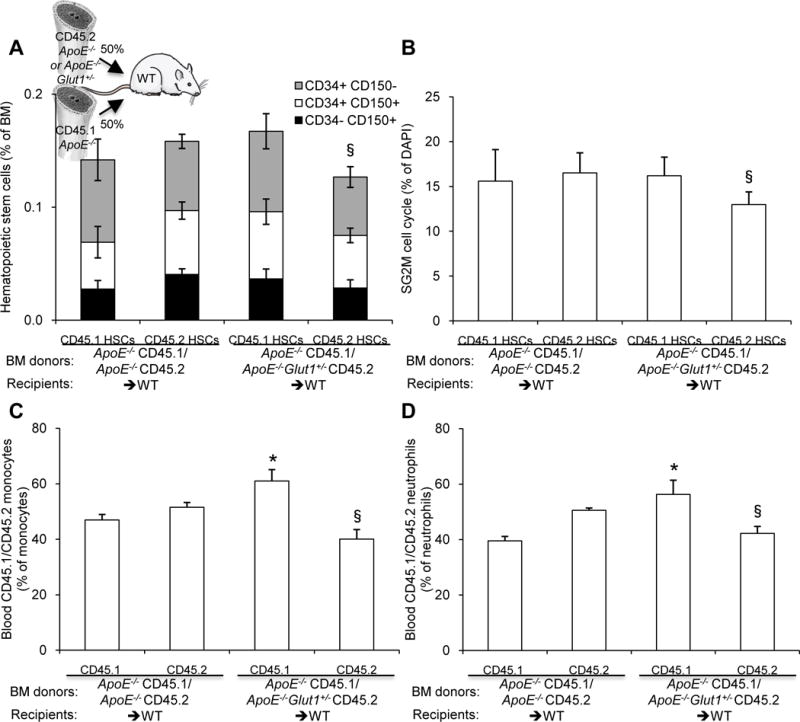
Methods and results: We first showed that the enhanced glycolytic flux in atheromatous plaques of ApoE(-/-) mice was associated with the enhanced metabolic activity of hematopoietic stem and multipotential progenitor cells and higher Glut1 expression in these cells. Mechanistically, the regulation of Glut1 in ApoE(-/-) hematopoietic stem and multipotential progenitor cells was not because of alterations in hypoxia-inducible factor 1α signaling or the oxygenation status of the bone marrow but was the consequence of the activation of the common β subunit of the granulocyte-macrophage colony-stimulating factor/interleukin-3 receptor driving glycolytic substrate utilization by mitochondria. By transplanting bone marrow from WT, Glut1(+/-), ApoE(-/-), and ApoE(-/-)Glut1(+/-) mice into hypercholesterolemic ApoE-deficient mice, we found that Glut1 deficiency reversed ApoE(-/-) hematopoietic stem and multipotential progenitor cell proliferation and expansion, which prevented the myelopoiesis and accelerated atherosclerosis of ApoE(-/-) mice transplanted with ApoE(-/-) bone marrow and resulted in reduced glucose uptake in the spleen and aortic arch of these mice.

Conclusions: We identified that Glut1 connects the enhanced glucose uptake in atheromatous plaques of ApoE(-/-) mice with their myelopoiesis through regulation of hematopoietic stem and multipotential progenitor cell maintenance and myelomonocytic fate and suggests Glut1 as potential drug target for atherosclerosis.

Keywords: atherosclerosis; bone marrow; cholesterol; glucose transporter type 1; glycolysis; myeloid cells.


Conflict of interest statement

DISCLOSURES

The authors have declared that no conflict of interest exists.

Figures

Figure 1
Figure 1. Enhanced glucose utilization in the aortic arch, splenocytes, BM and HSPCs of ApoE−/− BM chimeras
(A) 2-deoxy-[14C]-glucose uptake in aortic arch, bone marrow and spleen of ApoE−/− recipients transplanted with WT or ApoE−/− BM at 12 weeks after the transplantation procedure. (B) 2-deoxy-[14C]-glucose uptake was also determined in colony forming unit assays of multipotential progenitors (CFU-GEMM) and granulocyte macrophage progenitors (CFU-GM) from the BM of WT and ApoE−/− mice. (C) Oxygen consumption of whole BM cells, lineage marker (Lin)+, Lin BM cells and LinSca1+ progenitors isolated from the BM of WT and ApoE−/− mice in absence or (D) in presence of oligomycin treatment. (E) The citric acid metabolites were determined by LC-MS in BM cells isolated from ApoE−/− recipients transplanted with WT or ApoE−/− BM at 12 weeks after the transplantation procedure. (F) The mitochondrial membrane potential (MMP) was measured by flow cytometry using a fluorescent tetramethylrhodamine ethyl ester (TMRE) dye in Lin, Lin+ and CD34 or CD34+ HSPCs isolated from the BM of these mice. (G) NBD-glucose binding and/or uptake and (H) cell surface expression of Glut1 was also quantified in these cells. All results are the means ± SEM and are representative of at least one experiment performed with 6–10 animals per group. *P<0.05 vs. WT. §P<0.05 vs. the untreated condition.
Figure 2
Figure 2. HIF1α-independent regulation of Glut1 expression and ApoE−/− HSPC expansion and myeloid lineage fate
(A) Experimental overview. Bone marrow from Mx1-Cre (controls), Mx1-cre HIF1αfl/fl, ApoE−/− Mx1-Cre, ApoE−/− Mx1-cre HIF1αfl/fl mice were transplanted into ApoE−/− recipient mice and, after a 5 week recovery period, the mice were injected with Poly:IC and fed a high fat diet for 12 weeks to induce the expansion of HSPCs. (B) Representative Western blots showing HIF1α levels in BM cells freshly isolated from these mice at the end of the study period. Quantification (normalized to β–actin) is expressed as arbitrary unit and indicated by numbers below (C) mRNA expression of HIF1α and HIF1α target genes Ldha and Glut1 in BM cells freshly isolated from these mice at the end of the study period. (D) Histograms showing Glut1 cell surface expression (expressed as the mean fluorescence intensity (MFI)) in CD34 and CD34+ HSPCs. (E) Quantification of the CD34 or CD34+ HSPCs by flow cytometry was expressed as the percentage of total BM. (F) peripheral blood neutrophils, monocytes and eosinophils were also quantified in these mice at the end of the study period. The results are the means ± SEM of 6–10 animals per group. *P<0.05 vs. Mx1-Cre. §P<0.05 vs. ApoE−/− Mx1-Cre.
Figure 3
Figure 3. The ApoE−/− HSPC expansion and myeloid lineage fate and Glut1 upregulation are driven by the IL3Rβ signaling pathway
(A) Twenty-week-old WT and ApoE−/− mice were injected with IgG control or 100μg of the IL-3Rβ blocking antibody for 24 h and analyzed for peripheral blood myeloid cells by flow cytometry. (B) The CD34 or CD34+ HSPCs were quantified in the BM of these mice and was expressed as the percentage of total BM. (C) The percentage of these cells in S/G2M phase was determined by Hoechst staining, and (D) Glut1 cell surface expression was expressed as the mean fluorescence intensity (MFI). The results are the means ± SEM of 5 to 6 animals per group. *P<0.05 vs. WT IgG control. §P<0.05 vs. ApoE−/− IgG control.
Figure 4
Figure 4. Mitochondrial glycolytic substrate utilization is required for ApoE−/− HSPC proliferation and myelomonyctic fate in vitro
(A) Schematic representation of the metabolic pathways analyzed using pharmacological inhibitors with key enzymes indicated in blue, inhibitors in red, metabolites in black and cholesterol in green. Red boxes also indicated key signaling molecules. Bone marrow cells from fluorouracil-treated WT and ApoE−/− mice were grown for 72h in liquid culture containing 10% FBS IMDM in the presence of the indicated chemical compounds and 6ng/mL IL-3 or 2ng/mL GM-CSF. (B) Quantification of HSPCs and (C) CD11b+Gr-1+ myeloid cells after in vitro culture. Arrows on the y-axis indicate the starting percentage of cells per well before culture. The results are the means ± SEM of an experiment performed with 4 animals per group. P<0.05, genotype effect. NS, non-significant.
Figure 5
Figure 5. Glut1 is required in vitro for the IL3Rβ-dependent ApoE−/− HSPC expansion and myeloid lineage fate
(A) Oxygen consumption of WT, Glut1+/−, ApoE−/−, and ApoE−/−Glut1+/− BM cells cultured for 48h in presence or absence of 6ng/mL IL-3 or 2ng/mL GM-CSF or (B) WT, Glut1+/−, ApoE−/−, and ApoE−/−Glut1+/− Lineage marker (Lin) Sca1+ progenitors cultured for 2h after isolation. Bone marrow cells from WT, Glut1+/−, ApoE−/−, and ApoE−/−Glut1+/− mice were sorted for Lin cells (i.e, enriched in HSPCs) and cultured for 72h in liquid culture in presence or absence of 6ng/mL IL-3 or 2ng/mL GM-CSF. (C) Representative dot plots and (D) quantification of HSPCs after in vitro culture. (E) Representative dot plots and (F) quantification of CD11b+Gr-1+ myeloid cells after in vitro culture. (G) Quantification of ROS generation and (H) mitochondrial membrane potential (MMP) by flow cytometry using fluorescent carboxy-H2DCFDA and tetramethylrhodamine ethyl ester (TMRE) dyes, respectively in HSPCs after in vitro culture. The results are the means ± SEM of n=4 per group. *P<0.05, genotype effect. §P<0.05, Glut1-dependent effect. #P<0.05, growth hormone effect.
Figure 6
Figure 6. Glut1-dependence of ApoE−/− HSPC expansion and myelopoiesis in vivo
(A) Experimental overview. Bone marrow from WT, Glut1+/−, ApoE−/−, and ApoE−/−Glut1+/− mice were transplanted into ApoE−/− recipient mice and, after a 5 week recovery period, the mice were fed a high fat diet for 12 weeks to induce the expansion of HSPCs. (B) Glut1 cell surface expression was assessed by flow cytometry in the BM of these mice using Glut1 antibody and Glut1 RBD ligand. Histograms show (C) the Glut1 cell surface expression and (D) NBD-glucose binding and/or uptake in HSPC subpopulations from the most quiescent (long-term LT-HSCs) to the most cycling multipotential progenitors (CD34CD150+Flt3>CD34+CD150+Flt3>CD34+CD150Flt3>CD34+CD150Flt3+) and are expressed as the mean fluorescence intensity (MFI). (E) The percentage of cells in S/G2M phase was determined by DAPI staining and flow cytometry, Quantification of HSPC subpopulations expressed as (F) percentage of total BM or (G) absolute numbers. Histograms showing the quantification of granulocyte macrophage progenitor (GMP), common myeloid progenitor (CMP) and megakaryocyte-erythroid progenitor (MEP) populations are expressed as percentage of (H) total BM or (I) spleen. Quantification of (J) the peripheral blood leukocytes, (K) monocytes, (L) neutrophils and (M) eosinophils over the course of a 12-week high fat diet period. The data are the means ± SEM and are representative of an experiment performed with n=6 (WT and Glut1+/− BM transplanted into ApoE−/− recipients) or n=10–12 (ApoE−/− and ApoE−/−Glut1+/− BM transplanted into ApoE−/− recipients) animals per group. *P<0.05 vs. ApoE−/− mice receiving WT BM. §P<0.05 vs. ApoE−/− mice receiving ApoE−/− BM.
Figure 7
Figure 7. Cell autonomous role of Glut1 on ApoE−/− HSPC expansion and myeloid lineage commitment
(A) Schematic diagram showing the protocol for the competitive repopulation assay. Equally mixed portions of BM from the respective genotypes were transplanted into WT recipients. Chow-fed recipient mice were analyzed at 10 weeks after reconstitution by flow cytometry for the contribution of the donor (CD45.1+/CD45.2+) to the HSPC subpopulations from the most quiescent (long-term LT-HSCs) to the most cycling multipotential progenitors (CD34CD150+>CD34+CD150+> CD34+CD150) in the bone marrow. (B) The percentage of CD45.1+ and CD45.2+ HSPCs in S/G2M phase was also determined by DAPI staining and flow cytometry in the BM of these mice. The contribution of the donor (CD45.1+/CD45.2+) to (C) the monocytes and (D) neutrophils in the peripheral blood was also analyzed. The results are the means ± SEM of 6 to 8 mice per groups. *P<0.05 vs. WT mice receiving CD45.1+Apoe−/−/CD45.2+Apoe−/− mixed BM. §P<0.05 vs. CD45.1+Apoe−/− cells within the same transplanted mice.
Figure 8
Figure 8. Glut1 deficiency reduces the accelerated atherosclerosis of ApoE−/− BM chimeras
(A) Representative hematoxylin and eosin (H&E) staining (magnification, ×100) and quantification by morphometric analysis of the development of atherosclerotic lesions in the proximal aorta of ApoE−/− recipient mice transplanted with ApoE−/− (n=10) or ApoE−/−Glut1+/− BM that were fed a high fat diet (n=12). The values for individual mice are shown as open circles, representing an average of 6 sections per mouse. The horizontal bars represent the group medians. (B) The macrophages were detected by F4/80 immunofluorescent staining in the proximal aorta and quantified as the mean intensity (magnification, ×200). (C) Aortic arch and (D) spleen uptake of 2-deoxy-[14C]-glucose in these mice at the end of the study period. All results are the means ± SEM and are representative of 10 to 12 animals per group. (E–F) Tracking recruitment of Ly6Chi monocytes in atherosclerotic plaques 2 days after monocyte labeling with green latex beads (n=6). (E) Representative pictures (magnification, ×200) and quantification of latex beads (green particles, indicated by arrows) localized within atherosclerotic lesions and expressed as the number of beads per cross section; blue: DAPI-stained nuclei. (F) Representative FACS plots and quantification of latex+ monocytes that have infiltrated the aortic arch. §P<0.05 vs. ApoE−/− mice receiving ApoE−/− BM.

References

    1. Swirski FK, Nahrendorf M. Leukocyte behavior in atherosclerosis, myocardial infarction, and heart failure. Science. 2013;339:161–166. - PMC - PubMed
    1. Tall AR, Yvan-Charvet L. Cholesterol in inflammation and immune function. Nat Immunol Rev. 2015;15:104–16. - PMC - PubMed
    1. Coller BS. Leukocytosis and ischemic vascular disease morbidity and mortality. Arterioscler Thromb Vasc Biol. 2005;25:658–670. - PubMed
    1. Olivares R, Ducimetière P, Claude JR. Monocyte count: a risk factor for coronary heart disease? Am J Epidemiol. 1993;137:49–53. - PubMed
    1. Yvan-Charvet L, Pagler TA, Gautier EL, Avagyan S, Siry RL, Han S, Welch CL, Wang N, Randolph GJ, Snoeck HW, Tall AR. ATP binding cassette transporters and HDL suppress hematopoietic stem cell proliferation. Science. 2010;328:1689–1693. (2010) - PMC - PubMed

Publication types

MeSH terms