. 2016 Jun;474(6):1472-82.
doi: 10.1007/s11999-016-4718-2. Epub 2016 Feb 29.

Validation of the HOOS, JR: A Short-form Hip Replacement Survey

Affiliations

Validation of the HOOS, JR: A Short-form Hip Replacement Survey

Stephen Lyman et al. Clin Orthop Relat Res. 2016 Jun.

Abstract

Background: Patient-reported outcome measures (PROMs) are increasingly in demand for outcomes evaluation by hospitals, administrators, and policymakers. However, assessing total hip arthroplasty (THA) through such instruments is challenging because most existing measures of hip health are lengthy and/or proprietary.

Questions/purposes: The objective of this study was to derive a patient-relevant short-form survey based on the Hip disability and Osteoarthritis Outcome Score (HOOS), focusing specifically on outcomes after THA.

Methods: We retrospectively evaluated patients with hip osteoarthritis who underwent primary unilateral THA and who had completed preoperative and 2-year postoperative PROMs using our hospital's hip replacement registry. The 2-year followup in this population was 81% (4308 of 5351 patients). Of these, 2371 completed every item on the HOOS before surgery and at 2 years, making them eligible for the formal item reduction analysis. Through semistructured interviews with 30 patients, we identified items in the HOOS deemed qualitatively most important to patients with hip osteoarthritis. The original HOOS has 40 items, the four quality-of-life items were excluded a priori, five were excluded for being redundant, and one was excluded based on patient-relevance surveys. The remaining 30 items were evaluated using Rasch modeling to yield a final six-item HOOS, Joint Replacement (HOOS, JR), representing a single construct of "hip health." We calculated HOOS, JR scores for the Hospital for Special Surgery (HSS) cohort and validated this new score for internal consistency, external validity (versus HOOS and WOMAC domains), responsiveness to THA, and floor and ceiling effects. Additional external validation was performed using calculated HOOS, JR scores in collaboration with the Function and Outcomes Research for Comparative Effectiveness in Total Joint Replacement (FORCE-TJR) nationally representative joint replacement registry (n = 910).

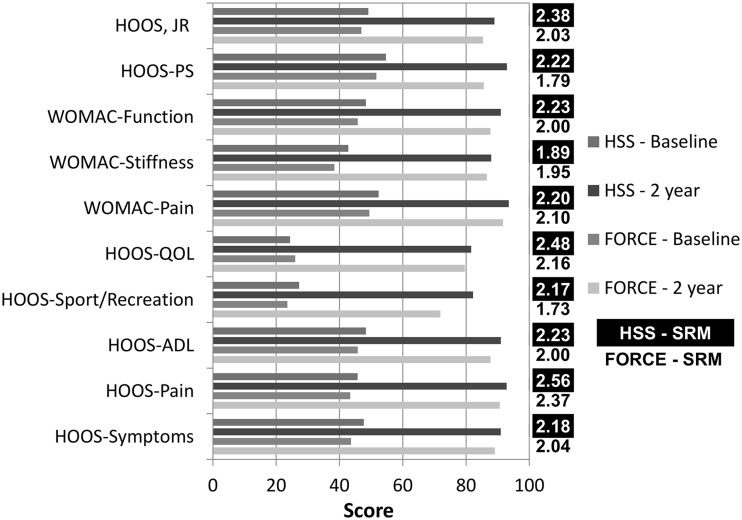
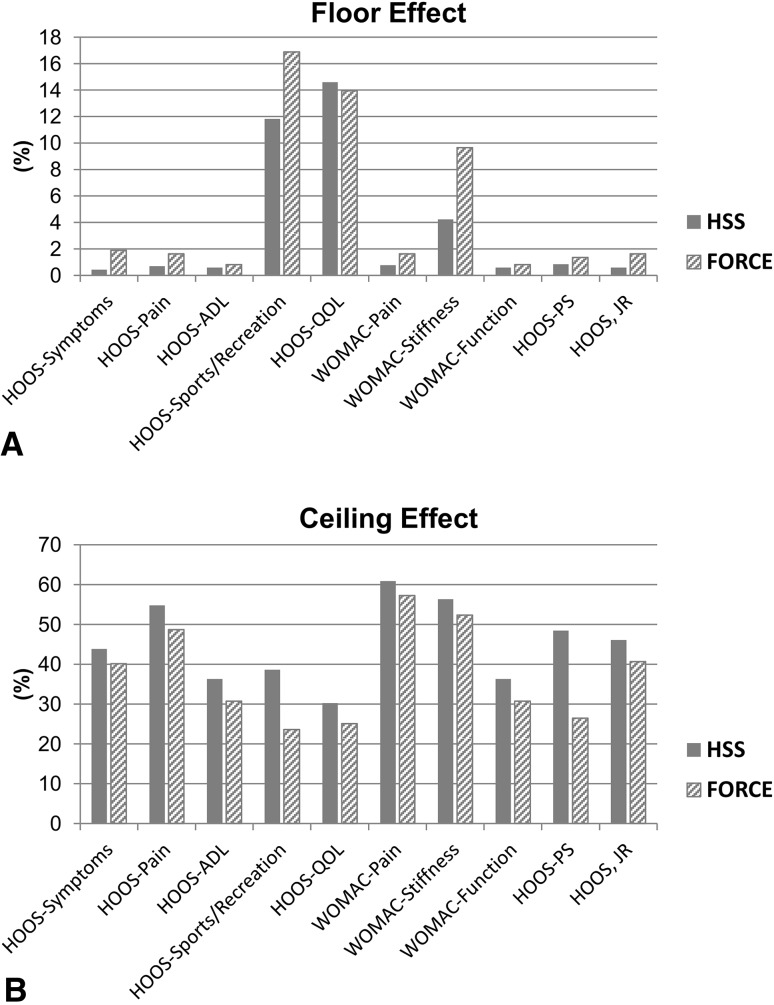
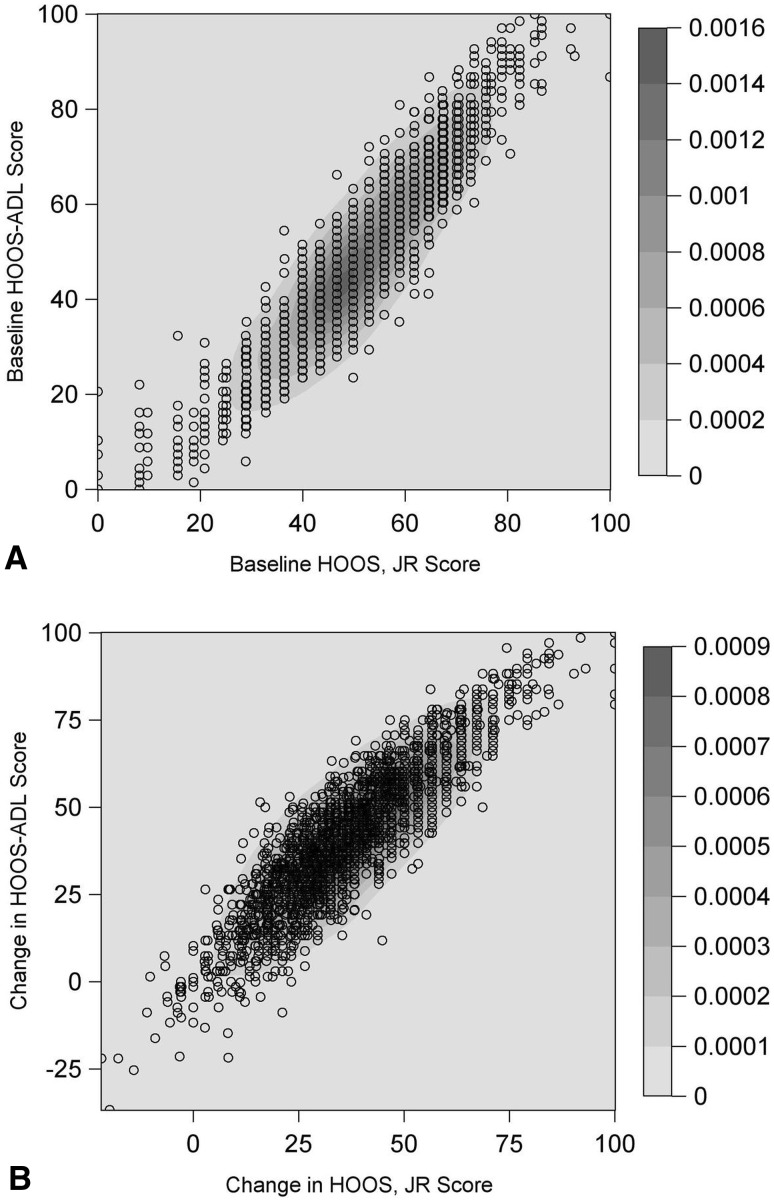
Results: The resulting six-item PROM (HOOS, JR) retained items only from the pain and activities of daily living domains. It showed high internal consistency (Person Separation Index, 0.86 [HSS]; 0.87 [FORCE]), moderate to excellent external validity against other hip surveys (Spearman's correlation coefficient, 0.60-0.94), very high responsiveness (standardized response means, 2.03 [95% CI, 1.84-2.22] [FORCE]; and 2.38 [95% CI, 2.27-2.49] [HSS]), and favorable floor (0.6%-1.9%) and ceiling (37%-46%) effects. External validity was highest for the HOOS pain (Spearman's correlation coefficient, 0.87 [95% CI, 0.86-0.89] [HSS]; and 0.87 [95% CI, 0.84-0.90] [FORCE]) and HOOS activities of daily living (Spearman's correlation coefficient, 0.94 [95% CI, 0.93-0.95] [HSS]; and 0.94 [95% CI, 0.93-0.96] [FORCE]) domains in the HSS validation cohort and the FORCE-TJR cohort.

Conclusions: The HOOS, JR provides a valid, reliable, and responsive measure of hip health for patients undergoing THA. This short-form PROM is patient relevant and efficient.

Level of evidence: Level III, diagnostic study.


Figures

Fig. 1
Fig. 1
A map shows person-ability and difficulty for the six items of the HOOS, JR. The horizontal line represents the measure of the variable in linear log units. The bar graph at the top of the figure shows each patient’s ability, with ability increasing from right to left. The bottom graph shows each item’s relative difficulty for this validation sample, with difficulty increasing from right to left. The numbers represent the thresholds between response categories. For data to adhere to the Rasch model, threshold points are correctly ordered, indicating patients have no difficulty consistently discriminating between response categories. HOOS, JR- 1: (Pain) Going up or down stairs; HOOS, JR- 2: (Pain) Walking on an uneven surface; HOOS, JR- 3: (activities of daily living [ADL]) Rising from sitting; HOOS, JR- 4: (ADL) Bending to floor/pick up an object; HOOS, JR- 5: (ADL) Lying in bed (turning over, maintaining hip position); HOOS, JR- 6: (ADL) Sitting.
Fig. 2
Fig. 2
The standardized response means (SRM) of hip arthroplasty outcomes measures at preoperative baseline and 2 years after surgery are shown. HSS = Hospital for Special Surgery; FORCE = Function and Outcomes Research for Comparative Effectiveness; QOL = quality of lfe; ADL = activities of daily living; HOOS-PS = HOOS Physical Function Short-Form.
Fig. 3A–B
Fig. 3A–B
This graph shows the (A) floor and (B) ceiling effects for 10 patient-reported outcome measures; HOOS-PS = HOOS Physical Function Short-Form; ADL = activities of daily living; QOL = quality of life; HSS = Hospital for Special Surgery; FORCE = Function and Outcomes Research for Comparative Effectiveness.
Fig. 4
Fig. 4
A comparison of the external validity of the HOOS, JR against nine other patient-reported outcome measures using Spearman’s correlation coefficient is shown. HSS = Hospital for Special Surgery; FORCE = Function and Outcomes Research for Comparative Effectiveness; QOL = quality of lfe; ADL = activities of daily living; HOOS-PS = HOOS Physical Function Short-Form.
Fig. 5A–B
Fig. 5A–B
The contour map shows the HOOS-pain domain versus (A) HOOS, JR at baseline and (B) the change in score from baseline to 2 years after THA. A scatterplot overlays a contour plot based on bivariate kernel density estimation. A bandwidth multiplier of one was used for each kernel density estimate. Areas of high density correspond to areas where there are many overlapping points. The scatterplot shows the positive correlation between the HOOS, JR (x-axis) and the HOOS-pain domain (y-axis) at baseline and the change between baseline and 2-year followup.
Fig. 6A–B
Fig. 6A–B
The contour map shows the HOOS-ADL domain versus (A) HOOS, JR at baseline and (B) change in score from baseline to 2 years after THA. A scatterplot overlays a contour plot based on bivariate kernel density estimation. A bandwidth multiplier of one was used for each kernel density estimate. Areas of high density correspond to areas where there are many overlapping points. The scatterplot shows the positive correlation between the HOOS, JR (x-axis) and the HOOS-ADL domain (y-axis) at baseline and the change between baseline and 2-year followup. ADL = activities of daily living;

References

    1. Ayers DC, Franklin PD. Joint replacement registries in the United States: a new paradigm. J Bone Joint Surg Am. 2014;96:1567–1569. doi: 10.2106/JBJS.N.00641. - DOI - PMC - PubMed
    1. Ayers DC, Zheng H, Franklin PD. Integrating patient-reported outcomes into orthopaedic clinical practice: proof of concept from FORCE-TJR. Clin Orthop Relat Res. 2013;471:3419–3425. doi: 10.1007/s11999-013-3143-z. - DOI - PMC - PubMed
    1. Bellamy N. WOMAC: a 20-year experiential review of a patient-centered self-reported health status questionnaire. J. Rheumatol. 2002;29:2473–2476. - PubMed
    1. Black N. Patient reported outcome measures could help transform healthcare. BMJ. 2013;346:f167. doi: 10.1136/bmj.f167. - DOI - PubMed
    1. Bureau of Labor Statistics. American Time Survey. Available at: http://www.bls.gov/tus/. Accessed January 12, 2014.

Publication types

MeSH terms