. 2016 Mar 1:7:10855.
doi: 10.1038/ncomms10855.

Lysosome triggered near-infrared fluorescence imaging of cellular trafficking processes in real time

Affiliations

Lysosome triggered near-infrared fluorescence imaging of cellular trafficking processes in real time

Marco Grossi et al. Nat Commun. .

Abstract

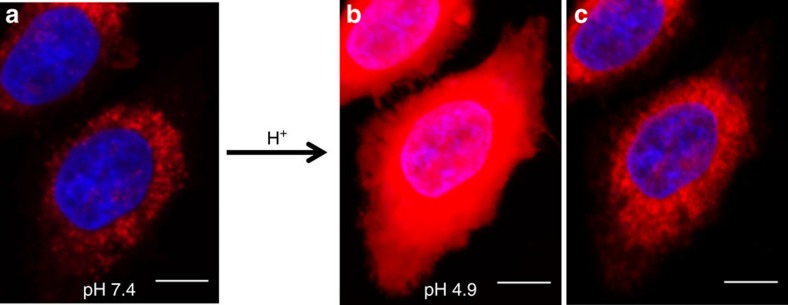
Bioresponsive NIR-fluorophores offer the possibility for continual visualization of dynamic cellular processes with added potential for direct translation to in vivo imaging. Here we show the design, synthesis and lysosome-responsive emission properties of a new NIR fluorophore. The NIR fluorescent probe design differs from typical amine functionalized lysosomotropic stains with off/on fluorescence switching controlled by a reversible phenol/phenolate interconversion. Emission from the probe is shown to be highly selective for the lysosomes in co-imaging experiments using a HeLa cell line expressing the lysosomal-associated membrane protein 1 fused to green fluorescent protein. The responsive probe is capable of real-time continuous imaging of fundamental cellular processes such as endocytosis, lysosomal trafficking and efflux in 3D and 4D. The advantage of the NIR emission allows for direct translation to in vivo tumour imaging, which is successfully demonstrated using an MDA-MB-231 subcutaneous tumour model. This bioresponsive NIR fluorophore offers significant potential for use in live cellular and in vivo imaging, for which currently there is a deficit of suitable molecular fluorescent tools.


Conflict of interest statement

Two authors declare the following competing financial interest. A patent application has been filed on azadipyrromethene based NIR fluorophores (PCT/EP2010/065991) in which both D.O.S. and W.G. have a financial interest.

Figures

Figure 1
Figure 1. BF2-azadipyrromethene NIR fluorophores.
General structure of BF2-azadipyrromethenes 1. Design and synthesis of lysosomal responsive BF2-azadipyrromethene NIR fluorophore 2.
Figure 2
Figure 2. Cellular uptake responsive NIR-fluorophore.
(a) Simplified endocytosis of a responsive NIR fluorophore. Numbers represent the approximate pH of the corresponding organelles. (b) Three observable stages of the path of the pH-responsive fluorophore in the cellular environment: uptake, trafficking and efflux.
Figure 3
Figure 3. Photophysical properties of NIR-fluorophores.
(a) Light absorption and emission spectra of compounds 2 and 5, and their photo-physical parameters. (b) Integrated off and on fluorescence states of 2 (5 × 10⁻⁶ M) in toluene, tetrahydrofuran (THF), dimethylformamide (DMF) and DMSO with TFA (red bars) and DBU (grey bars). (c) Plot of relative off and on integrated fluorescence versus solvent polarity values for toluene, THF, DMF and DMSO. (d) Comparative photobleaching of 1 × 10⁻⁷ M DMEM solutions of 2 (red line), lysotracker red (blue line) and pHrodo red (black line) with 150 W fibre optic delivered light 620(30) nm for 2 and 540(40) nm for lysotracker red and pH-rhodo red at 25 °C. (e) In vitro photobleaching of 2 (red), lysotracker red (blue line) and pHrodo red (black line) with maximum LED power using excitation filter 640(14) nm for 2 and excitation filter 563(9) nm for lysotracker red and pH-rhodo red.
Figure 4
Figure 4. Cellular uptake responsive NIR-fluorescence.
(a) Emission spectra of 2 (5 × 10⁻⁶ M) in DMEM (10% FBS) at pH ranging from 8 (grey) to 2 (red). Exc: 625 nm. Inset: fluorescence intensity at λmax=707 nm versus pH; sigmoidal plot fit resulted in apparent pKa=4.0. (b) Corresponding FEF values from differing pH solutions applying Cy5.5 filter parameters. (c) Diagram represents the pH changes and increasing fluorescence intensity along endocytic path towards lysosomes.
Figure 5
Figure 5. Intracellular NIR-emission profile.
CLSM images showing intracellular localization of pH-responsive compound 2 (10 μM, red) and nuclear counterstain Hoechst 33342 (blue) in fixed (a,c) HeLa Kyoto and (b,d) HEK293 cell lines. Bottom: three corresponding representative slices of the Z-stack for each cell type. Scale bars, 10 μm.
Figure 6
Figure 6. Identification of subcellular NIR-fluorescent on switch.
CLSM fluorescent images showing lysosomal localization of the ‘on' state of 2 in LAMP1-GFP-expressing HeLa cells (a) Cy5.5 channel; (b) GFP channel. (c) Three-dimensional image of overlaid Cy5.5 and GFP channels. (d) Zoom-in of the dashed box. Scale bars, 10 μm (ac) and 2 μm (d).
Figure 7
Figure 7. Illustration of NIR-fluorescence response selectivity.
(a) CLSM imaging of HeLa Kyoto cells following incubation with 2 (10 μM) for 2 h at 37 °C, DAPI nuclei staining and fixing. (b) The same set of cells imaged after buffer changed to pH 4.9, keeping the same laser power and PMT voltage. (c) The same set of cells after adjustment of microscope laser power and PMT voltage to obtain a non-saturated image. Red: 2; blue: DAPI stain. Scale bar, 10 μm.
Figure 8
Figure 8. Widefield live-cell imaging of the uptake of 2 (10 μM) into HeLa Kyoto cells.
(a) Time-lapse black and white images are shown 1, 30, 60 and 90 min. (b) Red-coloured image at 90 min. (c) Schematic depiction of the uptake process of responsive fluorophore (c). Scale bars, 20 nm.
Figure 9
Figure 9. Z-axis projections of widefield 4D live-cell imaging of the uptake of 2 (10 μM) from HeLa Kyoto cells.
Images were acquired in 25 focal planes every 1 min for 60 min. (a) Time lapse b/w images are shown for 15, 30, 40 and 60 min. (b) Red-coloured image at 60 min. (c) Fluorescence intensity quantification in two identical volumes around a selected cell (1) and in the extracellular environment (2). Scale bars, 10 μm.
Figure 10
Figure 10. Lysosome tracking in living HeLa Kyoto cells post 1 h incubation with 2 (10 μM).
(a) Time-lapse representative snapshot of a single cell chosen for image analysis. (b) Lysosome selection at 0 min. (c,d) Tracking over time. (e) Schematic depiction of tracking intracellular vesicular movements with bioresponsive fluorophore. Scale bar, 5 μm.
Figure 11
Figure 11. Imaging of cellular efflux.
HeLa Kyoto cells were pre-treated with 2 (10 μM) for 2 h, DMEM replaced with fluorophore-free DMEM and cells fixed at various time points. (a) Cells imaged after 2 h incubation. (b) Cells imaged after 1, 15, 30 and 120 min post media change. (c) Schematic depiction of efflux of bioresponsive fluorophore. (d) Decrease in number of NIR fluorescent lysosomes from 1 to 120 min. Scale bars, 20 μm.
Figure 12
Figure 12. In vivo imaging of 2 using a MDA-MB-231-luc-D3H1 subcutaneous tumour model in two representative mice.
(a) Bioluminescence imaging confirmation of tumour cells. (b) NIR fluorescence imaging 24 h post intravenous (i.v.) administration of 2 (excit. 660–690 nm, emis. 710–730 nm). (c) NIR fluorescence imaging 24 h post i.v. administration of 2 with intensity scale adjusted (excit. at 675 nm, emiss. at 720 nm). (d) Profile of tumour NIR fluorescence (red solid line) and liver (red dashed line) over time following i.v. tail injection of 2. Non-injected control tumour NIR fluorescence (grey solid line). Values determined from the same sized ROI from background area and tumour averaged for n=3.

Similar articles

Cited by

References

    1. Salipalli S., Singh P. K. & Borlak J. Recent advances in live cell imaging of hepatoma cells. J. BMC Cell Biol. 15, 26 (2014). - PMC - PubMed
    1. Correa I. R. Jr Live-cell reporters for fluorescence imaging. Curr. Opin. Chem. Biol. 20, 36–45 (2014). - PubMed
    1. Dean K. M. & Palmer A. E. Advances in fluorescence labelling strategies for dynamic cellular imaging. Nat. Chem. Biol. 10, 512–523 (2014). - PMC - PubMed
    1. Baker M. Cellular imaging: taking a long, hard look. Nature 466, 1137–1140 (2010). - PubMed
    1. de Jong M., Essers J. & van Weerden W. M. Imaging preclinical tumour models: improving translational power. Nat. Rev. Cancer 14, 481–493 (2014). - PubMed

Publication types

Substances