. 2016 Apr 1;126(4):1311-22.
doi: 10.1172/JCI79590. Epub 2016 Feb 29.

Disabled homolog 2 controls macrophage phenotypic polarization and adipose tissue inflammation

Disabled homolog 2 controls macrophage phenotypic polarization and adipose tissue inflammation

Samantha E Adamson et al. J Clin Invest. .

Abstract

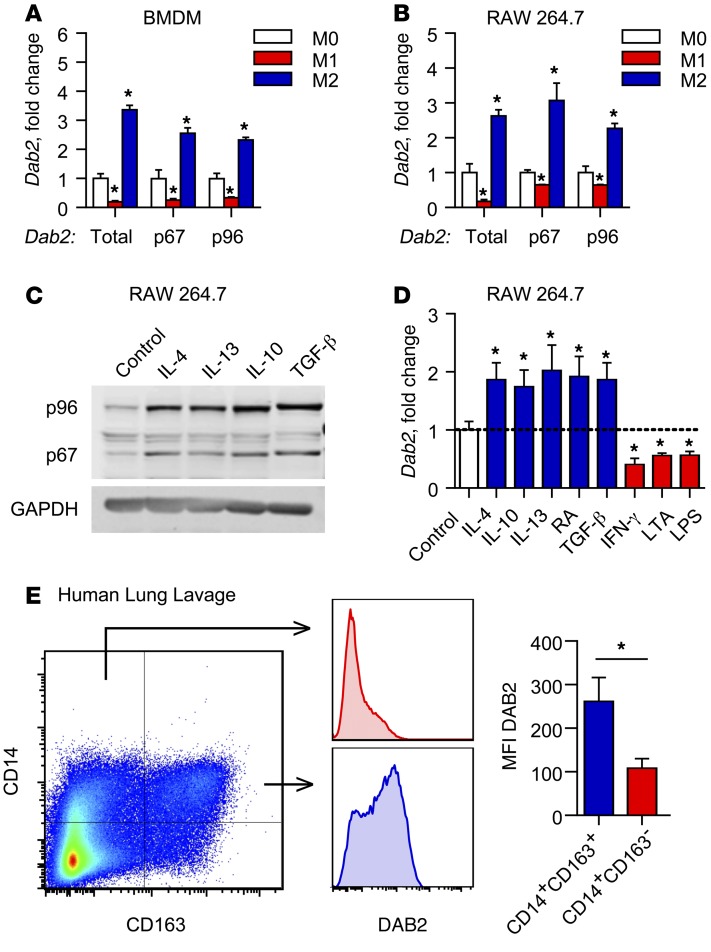
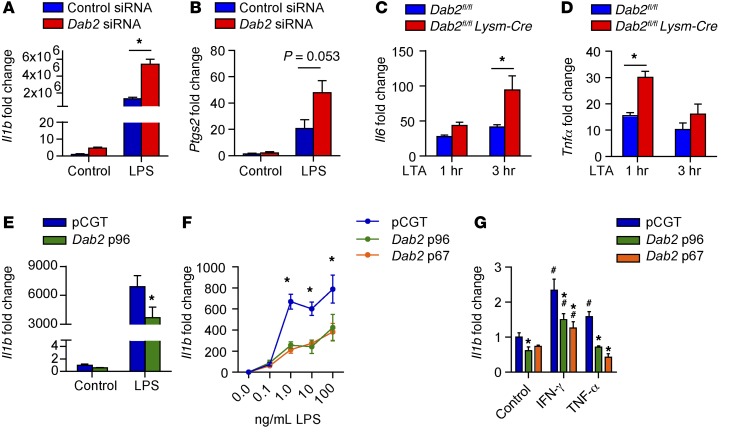
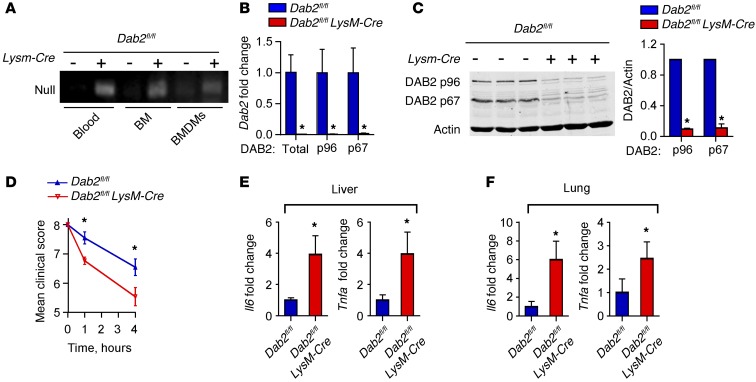
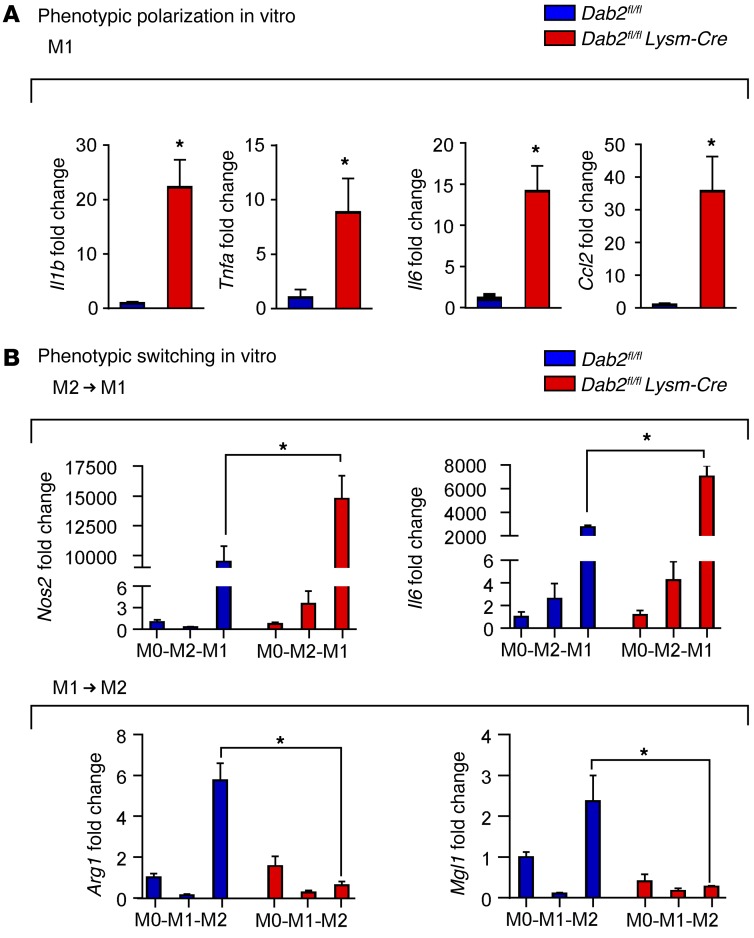
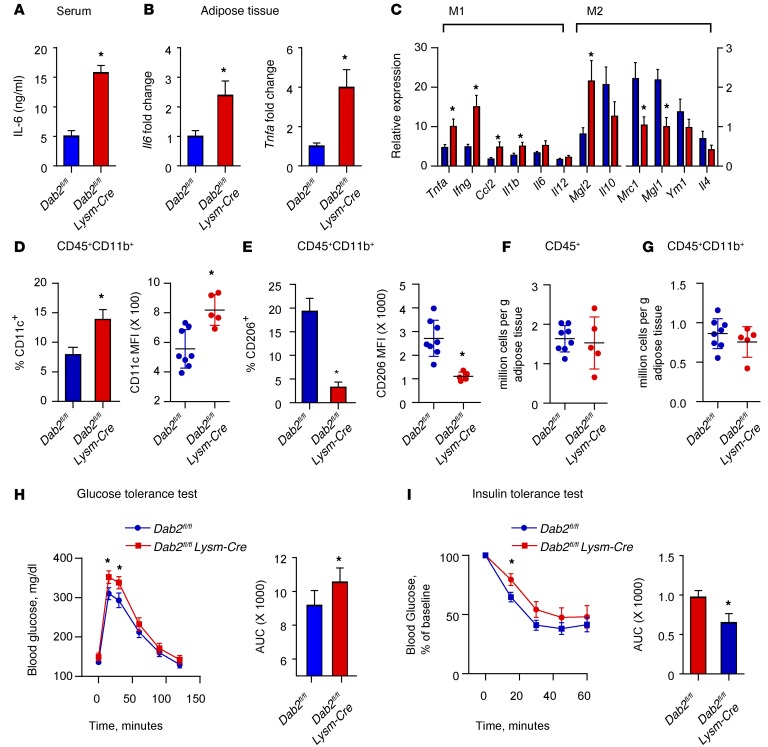
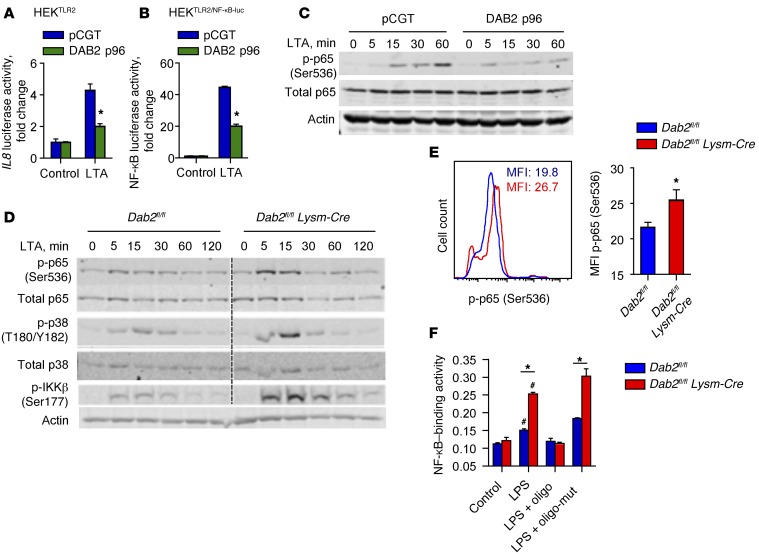
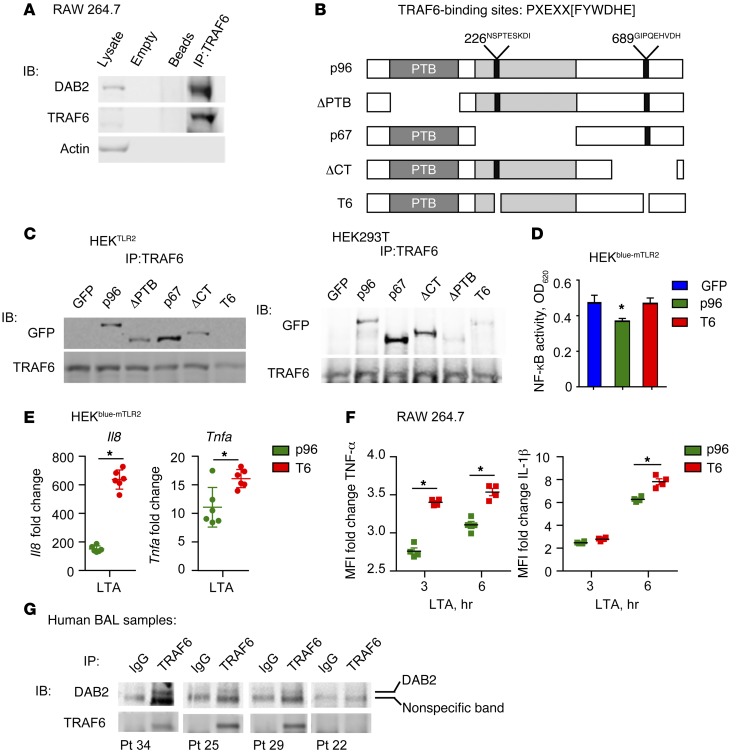
Acute and chronic tissue injury results in the generation of a myriad of environmental cues that macrophages respond to by changing their phenotype and function. This phenotypic regulation is critical for controlling tissue inflammation and resolution. Here, we have identified the adaptor protein disabled homolog 2 (DAB2) as a regulator of phenotypic switching in macrophages. Dab2 expression was upregulated in M2 macrophages and suppressed in M1 macrophages isolated from both mice and humans, and genetic deletion of Dab2 predisposed macrophages to adopt a proinflammatory M1 phenotype. In mice with myeloid cell-specific deletion of Dab2 (Dab2fl/fl Lysm-Cre), treatment with sublethal doses of LPS resulted in increased proinflammatory gene expression and macrophage activation. Moreover, chronic high-fat feeding exacerbated adipose tissue inflammation, M1 polarization of adipose tissue macrophages, and the development of insulin resistance in DAB2-deficient animals compared with controls. Mutational analyses revealed that DAB2 interacts with TNF receptor-associated factor 6 (TRAF6) and attenuates IκB kinase β-dependent (IKKβ-dependent) phosphorylation of Ser536 in the transactivation domain of NF-κB p65. Together, these findings reveal that DAB2 is critical for controlling inflammatory signaling during phenotypic polarization of macrophages and suggest that manipulation of DAB2 expression and function may hold therapeutic potential for the treatment of acute and chronic inflammatory disorders.


Figures

Figure 1
Figure 1. Dab2 expression is differentially regulated in M1 and M2 macrophages.
mRNA expression of total Dab2 and p67 and p96 Dab2 splice variants was determined by qPCR of BMDMs (A) and RAW 264.7 macrophages (B). For A and B, cells were treated with control media (M0), 1 μg/ml LPS and 10 U/ml IFN-γ (M1), or 10 ng/ml IL-4 (M2) for 3 hours. Results were normalized to B2m (encoding β-2-microglobulin) mRNA and are presented as fold change relative to M0. (A and B) Data are representative of 3 independent experiments. *P < 0.0001, by 2-way ANOVA with Dunnett’s multiple comparisons test. (C) Western blot analysis of p96-DAB2 and p67-DAB2 protein in RAW 264.7 macrophages treated for 24 hours with control media, 10 ng/ml IL-4, 10 ng/ml IL-13, 10 ng/ml IL-10, or 5 ng/ml TGF-β. GAPDH was used as a loading control. (D) qPCR analysis of total Dab2 mRNA expression in RAW 264.7 macrophages treated for 3 hours with control media (M0), 10 ng/ml IL-4, 10 ng/ml IL-10, 10 ng/ml IL-13, 10 μM 9-cis-retinoic acid (RA), 5 ng/ml TGF-β, 10 U/ml IFN-γ, 1 μg/ml LPS, or 1 μg/ml LTA. Results are normalized to B2m mRNA and are presented relative to M0. Data were compiled from 2 independent experiments and are presented as the mean ± SEM of quadruplicate treatments. *P < 0.05, by Student’s t test or Mann-Whitney U test. (E) DAB2 was preferentially expressed in M2-like human macrophages that expressed CD163. BAL fluid obtained from critically ill patients was analyzed by flow cytometry for CD14 and the macrophage M2 marker CD163. DAB2 MFI was determined for CD14+CD163 and CD14+CD163+ cells (bar graph shows the mean ± SEM, n = 6). *P < 0.02, by 2-tailed, paired Student’s t test.
Figure 2
Figure 2. Dab2 expression controls inflammatory gene expression.
qPCR analysis of Il1b (A) or Ptgs2 (B), which encodes cyclooxygenase 2, in RAW 264.7 macrophages treated with control media only (control) or 100 ng/ml LPS for 3 hours. Before treatment, RAW 264.7 macrophages were transfected with control or Dab2 siRNA for 48 hours. Results were normalized to B2m mRNA and are presented relative to control. (A and B) *P < 0.0001, by 2-way ANOVA with Tukey’s multiple comparisons test. Data represent the mean ± SEM of of 4 technical replicates and are representative of 2 independent experiments. (C and D) BMDMs from Dab2fl/fl and Dab2fl/fl Lysm-Cre mice were cultured in the presence of GM-CSF (5 ng/ml) for 2 days before treatment with LTA for 1 or 3 hours. Il6 (C) and Tnfa (D) mRNA levels were then measured by qPCR. (C and D) *P < 0.001, by 2-way ANOVA with Sidak’s multiple comparisons test. (E) qPCR analysis of Il1b in RAW 264.7 macrophages transfected with pCGT or pCGT-DAB2 and treated with 100 ng/ml LPS for 3 hours. *P < 0.05, by 2-tailed, unpaired Student’s t test. (F) Il1b mRNA expression was measured in RAW 264.7 macrophages transfected with pCGT, pCGT-p96-Dab2, or pCGT-p67-Dab2 and treated with increasing concentrations of LPS. *P < 0.0001, by 2-way ANOVA with Tukey’s multiple comparisons test. (G) Il1b mRNA expression was measured in RAW 264.7 macrophages transfected with pCGT, pCGT-p96-Dab2, or pCGT-p67-Dab2 and treated with IFN-γ or TNF-α. *P < 0.0001 compared with pCGT and #P < 0.0001 compared with control, by 2-way ANOVA with Tukey’s multiple comparisons test. Data represent the mean ± SEM of quadruplicate treatments.
Figure 3
Figure 3. Myeloid DAB2 regulates the inflammatory response to endotoxemia.
(A) PCR analysis of genomic DNA isolated from blood, BM, or BMDMs of Dab2fl/fl and Dab2fl/fl Lysm-Cre littermates. The presence of a null allele (213 bp) verified Cre recombinase activity (deletion of the second coding exon of Dab2). (B) qPCR analysis of total Dab2 or p96 and p67 splice variants of Dab2 mRNA expression in BMDMs from Dab2fl/fl and Dab2fl/fl Lysm-Cre littermates. Results were normalized to B2m mRNA and are presented relative to Dab2fl/fl mRNA levels. (C) Representative immunoblot analysis of DAB2 protein expression in BMDMs from 3 Dab2fl/fl and Dab2fl/fl Lysm-Cre littermates. Densitometric analysis is from 3 independent experiments with 3 littermate pairs, presented as the ratio of DAB2 to actin. Data represent the mean ± SD. *P < 0.05, by 2-tailed, unpaired Student’s t test. (DF) Dab2fl/fl and Dab2fl/fl Lysm-Cre mice were injected i.p. with 2 mg/kg LPS (E. coli 0111:B4). (D) The endotoxemia score was analyzed on a scale of 8 (healthy) to 0 (poor) at 0, 1, and 4 hours after injection. Data represent the mean ± SEM; n = 9 (Dab2fl/fl) and n = 11 (Dab2fl/fl Lysm-Cre) mice. *P < 0.001, by 2-way ANOVA with Sidak’s multiple comparisons test. (E and F) Il6 and Tnfa mRNA expression levels in liver (E) and lung (F) homogenates were analyzed by qPCR. Data were normalized to B2m and are expressed relative to Dab2fl/fl levels as the mean ± SEM; n = 8 (Dab2fl/fl) and n = 10 (Dab2fl/fl Lysm-Cre) mice. *P < 0.05, by 2-tailed, unpaired Student’s t test.
Figure 4
Figure 4. Dab2 deficiency promotes M1 macrophage phenotypic polarization and regulates phenotypic switching.
(A) qPCR analysis of Il1b, Tnfa, Il6, and Ccl2 mRNA expression in Dab2fl/fl and Dab2fl/fl Lysm-Cre BMDMs polarized to M1 for 3 hours. Results were normalized to B2m mRNA and are presented as fold change relative to Dab2fl/fl. Data represent the mean ± SEM of 4 technical replicates and are representative of 2 independent experiments. *P < 0.05, by 2-tailed, unpaired Student’s t test or Mann-Whitney U test. (B) BMDMs from Dab2fl/fl and Dab2fl/fl Lysm-Cre mice were serum starved for 3 hours (M0) and then polarized to M2 (IL-4) or M1 (LPS and IFN-γ) for 8 hours. Media were removed, and then M2 macrophages were treated with M1 stimuli (LPS and IFN-γ), and M1 macrophages were treated with M2 stimuli (IL-4) for an additional 8 hours. qPCR was performed to measure Nos2 and Il6 gene expression in M2 macrophages polarized to M1. Arg1 and Mgl1 expression was measured in M1 macrophages polarized to M2. Data represent the mean ± SEM of quadruplicate experiments. *P < 0.05, by 2-tailed, unpaired Student’s t test or Mann-Whitney U test.
Figure 5
Figure 5. DAB2 in myeloid cells regulates HFD-induced adipose tissue inflammation and insulin resistance.
Dab2fl/fl and Dab2fl/fl Lysm-Cre female mice were fed an HFD for 12 weeks. (A) Serum IL-6 levels after an HFD for 12 weeks as analyzed by ELISA. (B) Il6 and Tnfa mRNA levels in adipose tissue were analyzed by qPCR. (C) pPCR phenotypic characterization of cells isolated from the SVF in adipose tissue. (DG) Cells isolated from the SVF in gonadal adipose tissue of HFD-fed Dab2fl/fl and Dab2fl/fl Lysm-Cre mice were stained with CD45-APC-Cy7, CD11b-FITC, CD206-PE, and CD11c-AF647 Abs and subjected to FACS analysis. CD45+CD11b+ cells were analyzed for the percentage of cells that were CD11c+ and for the MFI of CD11c (D), and CD45+CD11b+ cells were analyzed for the percentage of cells that were CD206+ and for the MFI of CD206 (E). Each point represents 1 mouse in the MFI graphs in D and E. *P = 0.003, by 2-tailed, unpaired Student’s t test (D) and *P = 0.004, by 2-tailed, unpaired Student’s t test with Welch’s correction (E). Absolute numbers of CD45+ (F) and CD45+CD11b+ (G) cells per gram of gonadal adipose tissue were quantified and showed no difference in cell infiltration levels between HFD-fed Dab2fl/fl and Dab2fl/fl Lysm-Cre mice. For glucose tolerance tests (H) and insulin tolerance tests (I), mice were fasted for 6 hours and injected i.p. with a 1 g/kg glucose bolus or 0.75 U/kg insulin, respectively, and blood glucose levels were measured in tail blood by glucometer. Data were analyzed by calculating the AUC and represent the mean ± SEM. n = 10–12. *P < 0.05, by 2-tailed, unpaired Student’s t test.
Figure 6
Figure 6. DAB2 regulates NF-κB activity by suppressing phosphorylation of p65 (Ser536).
(A) HEKTLR2 cells were cotransfected with an IL8 promoter–luciferase reporter construct and either pCGT (control) or pCGT–DAB2 p96 and then treated overnight with control media only (control) or LTA (1 μg/ml). (B) HEKTLR2/NF-κB–luc cells were transfected with either pCGT or pCGT-DAB2 p96 and then stimulated with LTA (1 μg/ml) overnight. Luciferase activity was measured by luminometry (BioTek Synergy HT). (A and B) *P < 0.001, by 2-way ANOVA with Sidak’s multiple comparisons test. (C) Immunoblot analysis of total p65 and p-p65 (Ser536) in pCGT and pCGT-DAB2–transfected HEKTLR2 cells that were treated with 1 μg/ml LTA for 0, 5, 15, 30, and 60 minutes. Actin served as a loading control. (D) BMDMs from Dab2fl/fl and Dab2fl/fl Lysm-Cre mice were treated with LTA for the indicated times, and protein lysates were immunoblotted using Abs to detect p-p38 (T180/Y182), total p38, p-p65 (Ser536), total p65, p-IKKβ (Ser177), and β-actin. (E) Dab2fl/fl and Dab2fl/fl Lysm-Cre mice were injected i.p. with 2 mg/kg LPS (E. coli 0111:B4). After 4 hours, peritoneal cells were isolated and stained with anti–F4/80 Alexa Fluor 647, anti–CD11b Alexa Fluor 488, and anti–p-p65 (Ser536) Abs. F4/80hiCD11bhi cells were gated, and the MFI of Ser536 p-p65–specific fluorescence was analyzed. Data represent the mean ± SEM; n = 7. *P < 0.05, by 2-tailed, unpaired Student’s t test. (F) NF-κB DNA–binding activity in nuclear extracts from Dab2fl/fl and Dab2fl/fl Lysm-Cre BMDMs treated with 100 ng/ml LPS for 1 hour was analyzed by TransAM EMSA (Active Motif). For competitive binding studies, functional (oligo) or nonfunctional (oligo-mut) oligonucleotides were used according to the manufacturer’s instructions. Data are expressed as NF-κB–binding activity at A450 to A650 nm (mean ± SD) of triplicate measurements. A, absorbance. *P < 0.0001 and #P < 0.02 compared with control and compared with LPS plus oligonucleotide, by 2-tailed, unpaired Student’s t test.
Figure 7
Figure 7. DAB2 binding to TRAF6 controls NF-κB–dependent gene expression.
(A) Co-IP of endogenous DAB2 and TRAF6 from protein lysates of RAW 264.7 cells. Data are representative of at least 3 independent experiments. (B) The TRAF6-binding site consensus sequence is shown with 2 putative TRAF6-binding sites in DAB2 p96 at amino acid positions 226 and 689. Schematic of N-terminal GFP-tagged DAB2 deletion mutants. (C) TRAF6 IP with DAB2 deletion mutants in HEKTLR2 cells (left) and HEK293T cells (right). (D) HEKblue-mTLR2 cells were transfected with control GFP plasmid, DAB2 p96, or T6 mutant and treated with LTA (1 μg/ml) for 14 hours. Absorbance at 620 nm corresponds to NF-κB activity. The experiment was performed with 5 replicates. Data represent at least 2 independent experiments (C and D) and are expressed as the mean ± SEM. *P = 0.0276, by 1-way ANOVA with Fisher’s least significant difference test (LSD). (E) mRNA expression of Il8 and Tnfa in HEKblue-mTLR2 cells transfected with DAB2 p96 or T6 mutant and treated with LTA (1 μg/ml) for 6 hours. The experiment was performed with 6 replicates. Data represent the mean ± SEM. *P ≤ 0.0092, by 2-tailed, unpaired Student’s t test. Data were normalized to B2m and are expressed as the fold increase compared with untreated cells. (F) RAW 264.7 cells were transfected with either DAB2 p96 or T6 mutant before stimulation with LTA for 3 and 6 hours. Expression of IL-1β or TNF-α was analyzed by flow cytometry in GFP+ cells. Data represent at least 2 independent experiments and are expressed as the fold change in cytokine MFI compared with nontreated cells. *P < 0.001, by 2-way repeated-measures ANOVA with Sidak’s multiple comparisons test (mean ± SD). (G) Cells obtained from BAL fluid from critically ill patients were subjected to co-IP of TRAF6 and DAB2. Anti-TRAF6 Ab or control IgG was used in each sample for IP, followed by immunoblotting (IB). The specific DAB2 band is indicated.

References

    1. Gordon S, Taylor PR. Monocyte and macrophage heterogeneity. Nat Rev Immunol. 2005;5(12):953–964. doi: 10.1038/nri1733. - DOI - PubMed
    1. Lawrence T, Natoli G. Transcriptional regulation of macrophage polarization: enabling diversity with identity. Nat Rev Immunol. 2011;11(11):750–761. doi: 10.1038/nri3088. - DOI - PubMed
    1. Mantovani A, Biswas SK, Galdiero MR, Sica A, Locati M. Macrophage plasticity and polarization in tissue repair and remodelling. J Pathol. 2012;229(2):176–185. - PubMed
    1. Murray PJ, Wynn TA. Protective and pathogenic functions of macrophage subsets. Nat Rev Immunol. 2011;11(11):723–737. doi: 10.1038/nri3073. - DOI - PMC - PubMed
    1. Biswas SK, Mantovani A. Macrophage plasticity and interaction with lymphocyte subsets: cancer as a paradigm. Nat Immunol. 2010;11(10):889–896. doi: 10.1038/ni.1937. - DOI - PubMed

Publication types

MeSH terms