. 2016 Apr 15;196(8):3305-17.
doi: 10.4049/jimmunol.1501956. Epub 2016 Feb 29.

Alternatively Activated Macrophages Boost Induced Regulatory T and Th17 Cell Responses during Immunotherapy for Colitis

Affiliations

Alternatively Activated Macrophages Boost Induced Regulatory T and Th17 Cell Responses during Immunotherapy for Colitis

Dipica Haribhai et al. J Immunol. .

Abstract

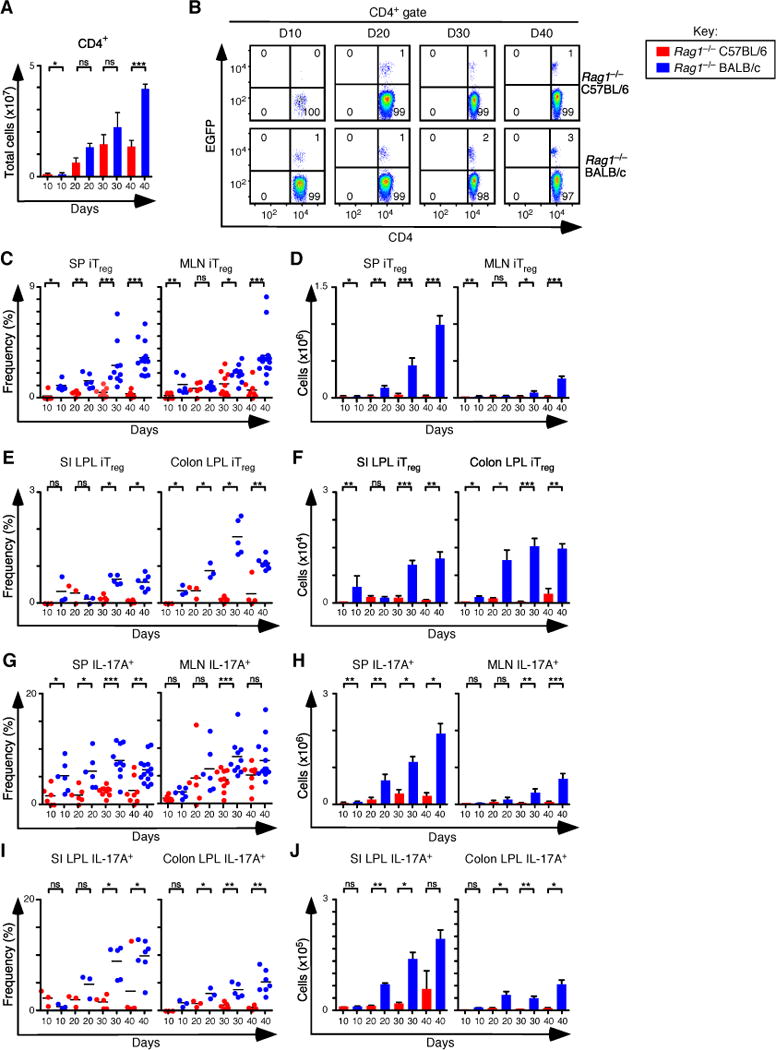
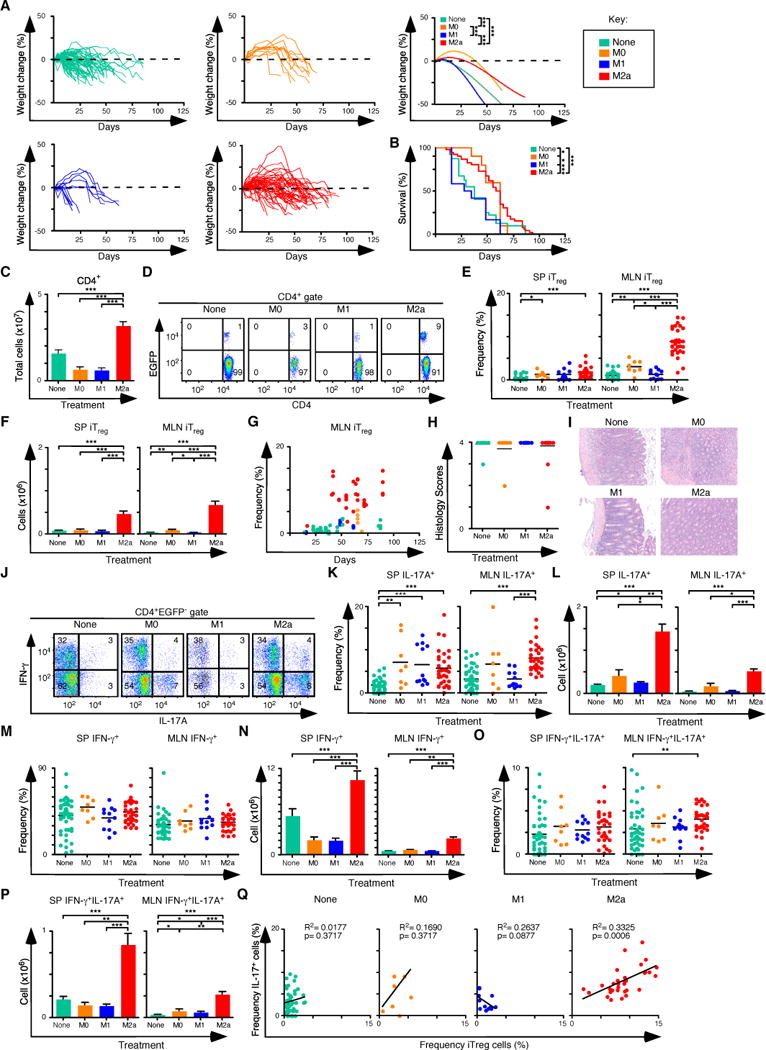
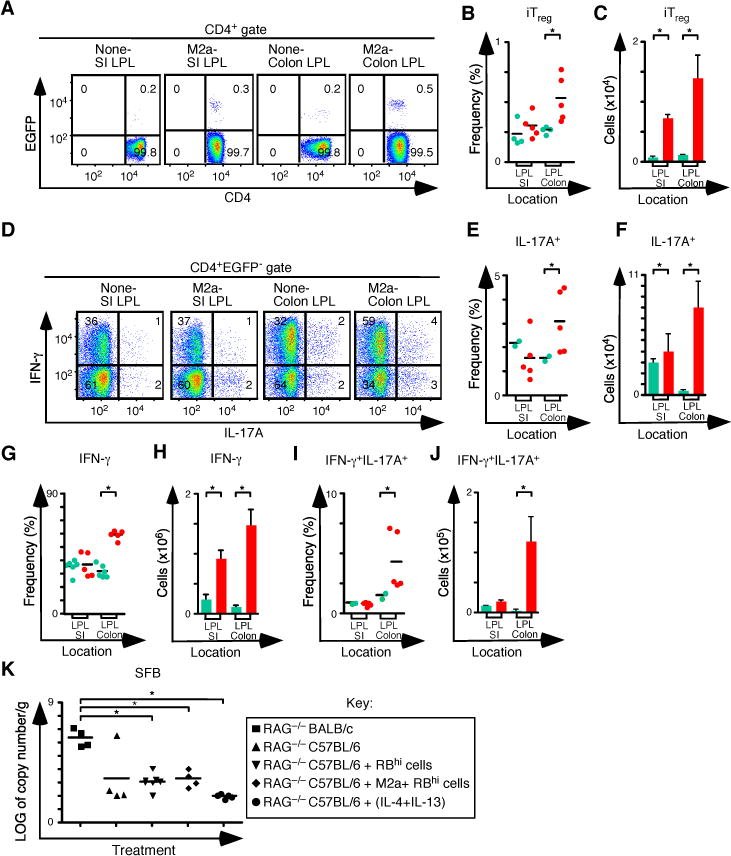
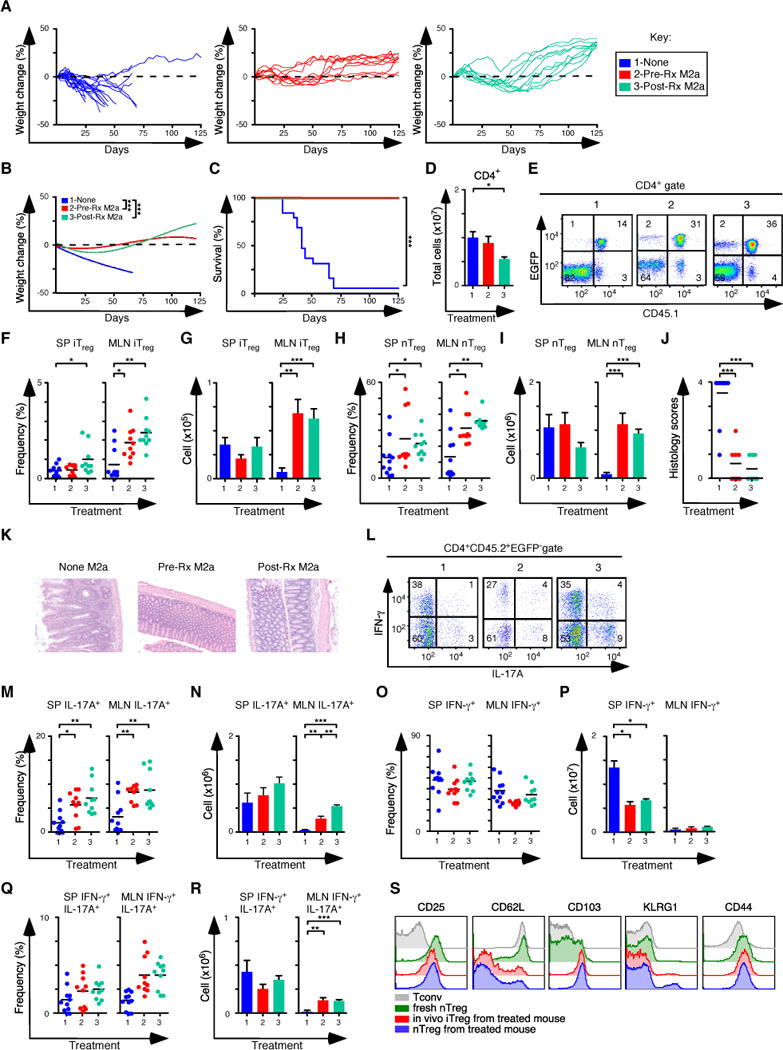
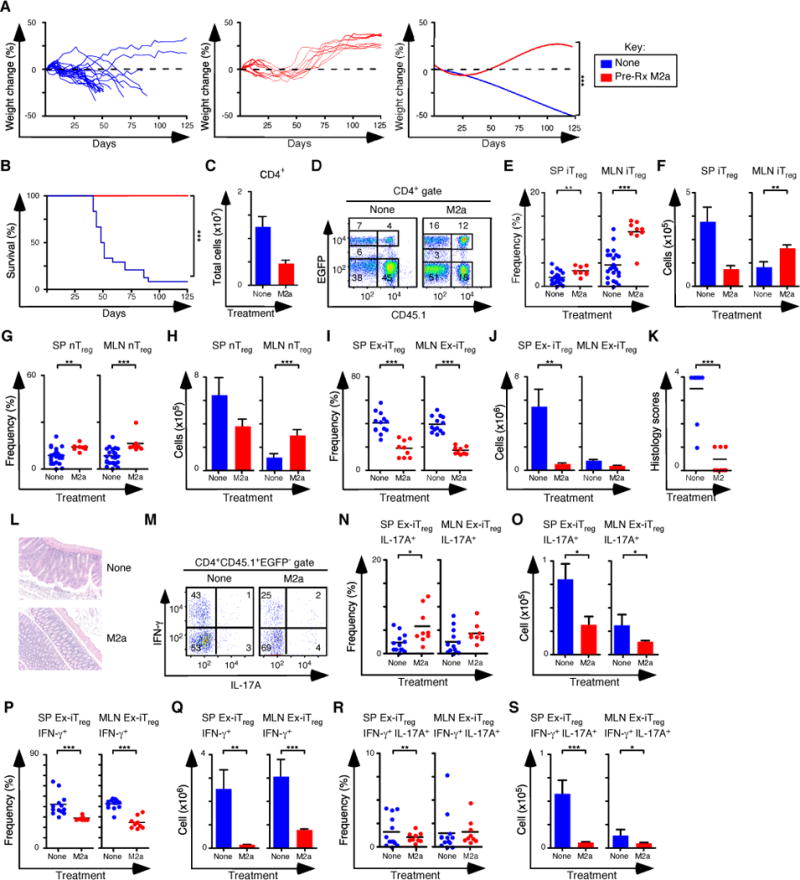
Induced regulatory T (iTreg) and Th17 cells promote mucosal homeostasis. We used a T cell transfer model of colitis to compare the capacity of iTreg and Th17 cells to develop in situ following the transfer of naive CD4(+)CD45RB(hi)T cells intoRag1(-/-)C57BL/6 or BALB/c mice, the prototypical Th1/M1- and Th2/M2-prone strains. We found that the frequency and number of Foxp3(+)iTreg cells and Th17 cells were significantly reduced in C57BL/6 mice compared with the BALB/c strain. C57BL/6 mice with colitis were also resistant to natural Treg cell immunotherapy. Pretreatment of C57BL/6Rag1(-/-)mice with IL-4 plus IL-13, or with M2a but not M1 macrophages, dramatically increased the generation of iTreg and Th17 cells. Importantly, M2a transfers, either as a pretreatment or in mice with established colitis, allowed successful immunotherapy with natural Treg cells. M2a macrophages also reduced the generation of pathogenic iTreg cells that lost Foxp3 expression, suggesting that they stabilize the expression of Foxp3. Thus, polarized M2a macrophages drive a directionally concordant expansion of the iTreg-Th17 cell axis and can be exploited as a therapeutic adjuvant in cell-transfer immunotherapy to re-establish mucosal tolerance.


Figures

Figure 1
Figure 1. Development of iTreg and Th17 cells during experimental colitis in Rag1−/− C57BL/6 and Rag1−/−BALB/c mice
(A) Total number of CD4+ T cells recovered from spleen (SP) and mesenteric lymph nodes (MLN) of Rag1−/− C57BL/6 and Rag1−/− BALB/c at days 10 (n=6 for both), 20 (n=6 for both), 30 (n=10 for both), and 40 (n=8 Rag1−/− C57BL/6, and n=14 Rag1−/− BALB/c) after adoptive transfer of naïve T cells from Foxp3EGFP mice. (B) Representative flow cytometry analysis of CD4 and EGFP (Foxp3) expression to assess the frequency of iTreg cells in MLN for each group. Numbers in quadrants are averages. (CD) Frequency (C) and number (D) of iTreg cells that develop in SP and MLN. (EF) Frequency (E) and number (F) of iTreg cells that develop in small intestine (SI) and colon lamina propria at days 10 (n=3 for both), 20 (n=3 for both), 30 (n=5 for both), and 40 (n=4 for Rag1−/− C57BL/6 and n=7 for Rag1−/− BALB/c. (GH) Frequency (G) and number (H) of Th17 cells that develop in SP and MLN. (IJ) Frequency (I) and number (J) of Th17 cells that develop in SI and colon lamina propria. Each symbol represents an individual mouse, and small horizontal lines represent the mean. Data are representative of 2–3 independent experiments, 2–7 mice per experiment. *p< 0.05, **p< 0.005, ***p<0.0005 and ns, not statistically different; Mann- Whitney test or t-test.
Figure 2
Figure 2. Pre-treatment of Rag1−/− C57BL/6 mice with IL-4 and IL-13 enhances the development of the iTreg-Th17 cell axis
(A) Weight change analysis of mice of Rag1−/− C57BL/6 mice not pre-treated or pre-treated with IL-4, IL-13, IL-4 and IL-13 in combination. Each line in the left and center panels represents an individual recipient mouse (None n=73, IL-4 n=15, IL-13 n=10 and IL-4+IL13 n=15). (B) Kaplan-Meier survival curves of mice in (A). (C) Quantification of donor CD4+ T cells from SP and MLN for each condition (None n=47, IL-4 n=11, IL-13 n=7, IL-4+IL-13 n=13). (D) Representative flow cytometry analysis of CD4 and EGFP (Foxp3) expression to assess the frequency of iTreg cells in MLN for each group. Numbers in quadrants are averages. (EF) Frequency (E) and number (F) of iTreg cells in the SP and MLN for each pre-conditioning regimen. (GH) Colitis scores (G) and representative H&E stained sections (H) from mice where tissues were taken for histology (None n=15, IL-4 n=11, IL-13 n=10 and IL-4+IL13 n=10). (I) Representative flow cytometry analysis of IL-17A and IFN-γ expression to assess the frequency of IFN-γ+, IL-17A+ and IFN-γ+IL-17A+ cells in MLN for each group. Numbers in quadrants are averages. (JK) Frequency (J) and number (K) of CD4+ IL-17A+ T cells in the SP and MLN for each group. (L, M) Frequency (L) and number (M) of CD4+ IFN-γ+ T cells in the SP and MLN for each group. (NO) Frequency (N) and number (O) of CD4+ IFN-γ+ IL-17A+ T cells in the SP and MLN for each group. Each symbol represents a mouse, and small horizontal bars represent the mean. Data are from 3–17 independent experiments, 1–5 mice per experiment. *p< 0.05, **p<0.005, ***p<0.0005; Mann- Whitney test.
Figure 3
Figure 3. Transcriptional and phenotypic profile of M1 and M2a polarized macrophages
(A) Venn diagram showing commonly and uniquely regulated probe sets found in M1 and M2a polarized macrophages. Probe sets that revealed a twofold or greater difference (|log2 ratio| > 1.0) and rank product FDR <10% relative to M0 cells are shown. Data is averaged from 3–5 arrays for each subset. (B) Heatmap showing the fold change in expression of the 1891 differentially regulated probe sets identified in A. Genes are organized into unique and co-regulated gene clusters as indicated. (C) Annotated heat map showing the expression levels of select differentially regulated probe sets. For B and C the scale (–64.0 fold to +64 fold) represents the fold change relative to the mean normalized intensity value (log2 ratio) in M0 cells (n=5). (D) q-PCR analysis of select gene expression in M0, M1, and M2 cells (n=3 for each gene). (E) Representative FACS analysis of M0, M1, and M2 macrophages (n=3) derived from bone marrow cells compared to PECs. (F) q-PCR analysis of Arginase 1 and NOS2 expression in PECs from mice pre-treated with IL-4 and IL-13 or PBS controls (n=4 for each group). (G) Representative flow cytometry analysis of F4/80 and YFP expression of recovered PECs, 48 hours after pre-treatment of Rag1−/− C57BL/6 with YFP+ M2a macrophages and frequency of F4/80+YFP+ PECs (n=3). (H) q-PCR analysis of Arginase 1 and NOS2 expression in PECs from mice in (G). F4/80+ YFP+ cells are donor M2a macrophages while F4/80+ YFP cells are recipient mouse PECs.
Figure 4
Figure 4. Pre-Treatment of Rag1−/− C57BL/6 mice with M2a macrophages boosts iTreg-Th17 cell axis development in the spleen and MLN
(A) Weight change analysis of Rag1−/− C57BL/6 mice pre-treated with M0, M1, M2a macrophages or not pre-treated. Each line in the left and center panels represents an individual recipient mouse (none n=73, M0 n=11, M1 n=13, M2 n=52). (B) Kaplan-Meier survival curves of mice in (A). (C) Quantification of donor CD4+ T cells from SP and MLN for each pre-condition treatment (None n=47, M0 n=8, M1 n=12, M2 n=32). (D) Representative flow cytometry analysis of CD4 and EGFP (Foxp3) expression to assess the frequency of iTreg cells in MLN for each group. Numbers in quadrants are averages. (EF) Frequency (E) and number (F) of iTreg cells in the SP and MLN. (G) Comparison of the frequency of iTreg cells in MLN and days where mice were taken for all groups. (HI) Colitis scores (H) and representative H&E stained sections (I) from mice where tissues were taken for histology (none n=15, M0 n=7, M1 n=12, M2 n=26). (J) Representative flow cytometry analysis of IL-17A and IFN-γ expression to assess the frequency of IFN-γ+, IL-17A+ and IFN-γ+ IL-17A+ cells in MLN for each group. Numbers in quadrants are averages. (KL) Frequency (K) and number (L) of CD4+ IL-17A+ T cells in the SP and MLN for each group. (MN) Frequency (M) and number (N) of CD4+ IFN-γ+ T cells in the SP and MLN for each group. (OP) Frequency (O) and number (P) of CD4+ IFN-γ+ IL-17A+ T cells in the SP and MLN for each group. (Q) Linear regression analysis comparing the frequency of MLN iTreg and CD4+IL-17A+ T cells from each group. (E, G, K, O, Q) Each symbol represents a mouse, and small horizontal bars represent the mean. Data are from 3–17 independent experiments, 1–5 mice per experiment. *p< 0.05, **p<0.005, ***p<0.0005; Mann- Whitney test.
Figure 5
Figure 5. Pre-Treatment of Rag1−/−C57BL/6 mice with M2a macrophages boosts iTreg-Th17 cell axis development in the small intestine and colon
(A) Representative flow cytometry analysis of CD4 and EGFP (Foxp3) expression to assess the frequency of iTreg cells in SI and colon lamina propria for each group. Numbers in quadrants represent the average. (BC) Frequency (B) and number (C) of iTreg cells in the SI and colon (None n=4 and M2a n=5). (D) Representative flow cytometry analysis of IL-17A and IFN-γ expression to assess the frequency of IFN-γ+, IL-17A+ and IFN-γ+IL-17A+ T cells in MLN for each group. Numbers in quadrants are averages. (EF) Frequency (E) and number (F) of CD4+ IL-17A+ T cells in the SP and MLN for each group. (GH) Frequency (G) and number (H) of CD4+ IFN-γ+ T cells in the SP and MLN for each group. (IJ) Frequency (I) and number (J) of CD4+ IFN-γ+ IL-17A+ T cells in the SP and MLN for each group. (K) Log of copy number/g of SFB for each group. Each symbol represents a mouse, and small horizontal bars represent the mean. Data are from 2–3 independent experiments, 1–2 mice per experiment. *p< 0.05; Mann- Whitney test.
Figure 6
Figure 6. M2a macrophages improve the treatment of colitis with nTreg cells
(A, B) Weight change analysis of mice not pre-treated (None), pre-treated (Pre-Rx M2a) or treated (Post-Rx M2a) with M2a macrophages at day 30 after establishment of colitis (None n=12; Pre-Rx n=10; Post-Rx M2a n=10). Note that all groups also received nTreg cells transfers on d31. (C) Kaplan-Meier survival curves of the mice in A. (D) Quantification of donor CD4+ T cells from SP and MLN for each experimental condition in A. (E) Representative flow cytometry analysis of CD45.1 and EGFP (Foxp3) expression to assess the frequency of in situ iTreg (CD45.1 EGFP+) and nTreg (CD45.1+ EGFP+) cells in MLN for each group. Numbers in quadrants are averages. (f–G) Frequency (F) and number (G) of iTreg cells in the SP and MLN. (HI) Frequency (H) and number (I) of nTreg cells in the SP and MLN. (JK) Colitis scores (J) and representative H&E stained sections (K) from mice where tissues were taken for histology (None M2a n=11; Pre-Rx M2a n=10; Post-Rx M2a n=10). (l) Representative flow cytometry analysis of IL-17A and IFN-γ expression to assess the frequency of IFN-γ+, IL-17A+ and IFN-γ+IL-17A+ cells in MLN for each group. Numbers in quadrants are averages. (MN) Frequency (M) and number (N) of CD4+ IL-17A+ T cells in the SP and MLN for each group. (OP) Frequency (O) and number (P) of CD4+ IFN-γ+ T cells in the SP and MLN for each group. (QR) Frequency (Q) and number (R) of CD4+ IFN-γ+ IL-17A+ T cells in the SP and MLN for each group. (S) Representative histograms comparing the expression levels of several proteins associated with Treg function. Tconv cells and nTreg cells were isolated from naïve mice, while in vivo derived iTreg cells and nTreg cells were isolated from mice treated with M2a + nTreg cells. Each symbol represents a mouse and small horizontal bars represent means. Data are from 2–6 independent experiments, 1–5 mice per experiment. *p< 0.05, **p<0.005, ***p<0.0005; Mann- Whitney test.
Figure 7
Figure 7. M2a macrophages enhance the stability of iTreg cells
(A) Weight change analysis of mice not pre-treated or pre-treated M2a macrophages followed by colitis induction with naïve CD4+ T cells from rescued Foxp3ΔEGFP mice. All mice were treated with nTreg cells and in vitro derived iTreg cells (None n=24, M2a n=9). (B) Kaplan-Meier survival curves of mice not pre-treated or pre-treated with M2a macrophages (None n=24, M2a n=9). (C) Quantification of donor CD4+ T cells from SP and MLN for each pre-condition treatment. (D) Flow cytometry analysis of CD45.1 and EGFP (Foxp3) expression to assess the frequency of nTreg (CD45.1EGFP+) and in vitro iTreg (CD45.1+EGFP+) cells in MLN for each group. Numbers in quadrants are averages. (EF) Frequency (E) and number (F) of iTreg cells in the SP and MLN. (GH) Frequency (G) and number (H) of nTreg cells in the SP and MLN. (IJ) Frequency (I) and number (J) of ex-iTreg cells in the SP and MLN. (KL) Colitis scores (K) and representative H&E stained sections (L) from mice where tissue was taken for histology (None n=10, M2a n=9). (M) Representative flow cytometry analysis of IL-17A and IFN-γ expression to assess the frequency of IFN-γ+, IL-17A+ and IFN-γ+ IL-17A+ ex-iTreg cells from the MLN for each group. Numbers in quadrants are averages. (NO) Frequency (N) and number (O) of IL-17A+ ex-iTreg cells in the SP and MLN for each group. (PQ) Frequency (P) and number (Q) of IFN-γ+ ex-iTreg cells in the SP and MLN for each group. (RS) Frequency (R) and number (S) of IFN-γ+ IL-17A+ ex-iTreg cells in the SP and MLN for each group. Each symbol represents a mouse, and small horizontal bars represent the mean. Data are from 2–12 independent experiments, 1–5 mice per experiment. *p< 0.05, **p<0.005, ***p<0.0005; Mann- Whitney test.

References

    1. Haribhai D, Williams JB, Jia S, Nickerson D, Schmitt EG, Edwards B, Ziegelbauer J, Yassai M, Li SH, Relland LM, Wise PM, Chen A, Zheng YQ, Simpson PM, Gorski J, Salzman NH, Hessner MJ, Chatila TA, Williams CB. A requisite role for induced regulatory T cells in tolerance based on expanding antigen receptor diversity. Immunity. 2011;35:109–122. - PMC - PubMed
    1. Josefowicz SZ, Niec RE, Kim HY, Treuting P, Chinen T, Zheng Y, Umetsu DT, Rudensky AY. Extrathymically generated regulatory T cells control mucosal TH2 inflammation. Nature. 2012;482:395–399. - PMC - PubMed
    1. Haribhai D, Lin W, Edwards B, Ziegelbauer J, Salzman NH, Carlson MR, Li SH, Simpson PM, Chatila TA, Williams CB. A central role for induced regulatory T cells in tolerance induction in experimental colitis. J Immunol. 2009;182:3461–3468. - PMC - PubMed
    1. Schmitt EG, Haribhai D, Williams JB, Aggarwal P, Jia S, Charbonnier LM, Yan K, Lorier R, Turner A, Ziegelbauer J, Georgiev P, Simpson P, Salzman NH, Hessner MJ, Broeckel U, Chatila TA, Williams CB. IL-10 Produced by Induced Regulatory T Cells (iTregs) Controls Colitis and Pathogenic Ex-iTregs during Immunotherapy. Journal of immunology. 2012;189:5638–5648. - PMC - PubMed
    1. Hsieh CS, Liang Y, Tyznik AJ, Self SG, Liggitt D, Rudensky AY. Recognition of the peripheral self by naturally arising CD25+ CD4+ T cell receptors. Immunity. 2004;21:267–277. - PubMed

Publication types