

A Comparison of Alternating Polarity and Forward Masking Artifact-Reduction Methods to Resolve the Electrically Evoked Compound Action Potential
- PMID: 26928001
- PMCID: PMC4925180
- DOI: 10.1097/AUD.0000000000000288
A Comparison of Alternating Polarity and Forward Masking Artifact-Reduction Methods to Resolve the Electrically Evoked Compound Action Potential
Abstract
Objective: Cochlear implant manufacturers utilize different artifact-reduction methods to measure electrically evoked compound action potentials (ECAPs) in the clinical software. Two commercially available artifact-reduction techniques include forward masking (FwdMsk) and alternating polarity (AltPol). AltPol assumes that responses to the opposing polarities are equal, which is likely problematic. On the other hand, FwdMsk can yield inaccurate waveforms if the masker does not effectively render all neurons into a refractory state. The goal of this study was to compare ECAP thresholds, amplitudes, and slopes of the amplitude growth functions (AGFs) using FwdMsk and AltPol to determine whether the two methods yield similar results.
Design: ECAP AGFs were obtained from three electrode regions (basal, middle, and apical) across 24 ears in 20 Cochlear Ltd. recipients using both FwdMsk and AltPol methods. AltPol waveforms could not be resolved for recipients of devices with the older-generation chip (CI24R(CS); N = 6).
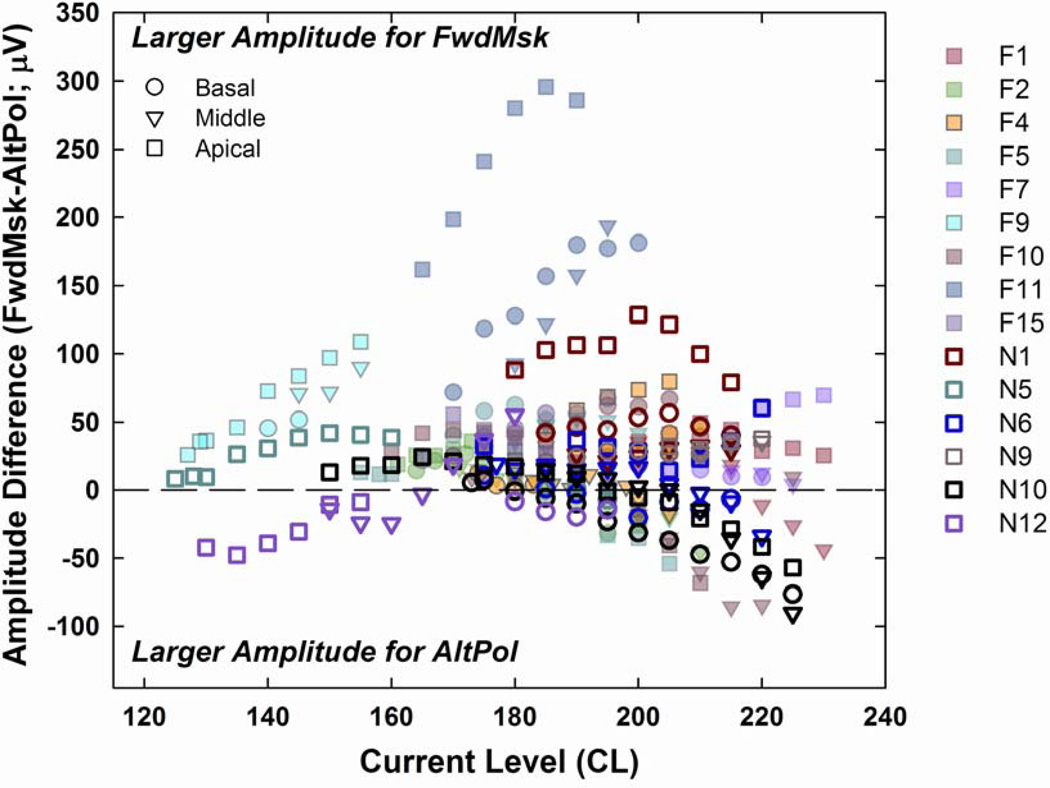
Results: Results comparing FwdMsk and AltPol in the CI24RE- and CI512-generation devices showed significant differences in threshold, AGF slope, and amplitude between methods. FwdMsk resulted in lower visual-detection thresholds (p < 0.001), shallower slopes (p = 0.004), and larger amplitudes (p = 0.03) compared with AltPol.
Conclusions: Results from this study are consistent with recent findings showing differences in ECAP amplitude and latency between polarities for human CI recipients. When averaged, these differences likely result in a reduced ECAP response with AltPol. The next step will be to separate the effects of artifact-reduction method and stimulus polarity to determine the relative effects of each.
Conflict of interest statement
Figures


References
-
- Abbas P, Brown C, Shallop J, et al. Summary of results using the Nucleus CI24M implant to record the electrically evoked compound action potential. Ear Hear. 1999;20:45–59. - PubMed
-
- Bahmer A, Peter O, Baumann U. Recording and analysis of electrically evoked compound action potentials (ECAPs) with MED-EL cochlear implants and different artifact reduction strategies in Matlab. J Neurosci Meth. 2010;191:66–74. - PubMed
-
- Battmer R-D, Dillier N, Lai WK, et al. Evaluation of the Neural Response Telemetry (NRT) capabilities of the Nucleus Research Platform 8: Initial results from the NRT trial. Int J Audiol. 2004;43:S10–S15. - PubMed
-
- Botros A, van Dijk B, Killian M. AutoNRT: an automated system that measures ECAP thresholds with the Nucleus Freedom cochlear implant via machine intelligence. Artif Intell Med. 2007;40:15–28. - PubMed
-
- Brown C, Abbas P. Electrically evoked whole-nerve action potentials: Parametric data from the cat. J Acoust Soc Am. 1990;88:2205–2210. - PubMed
MeSH terms
Grants and funding
LinkOut - more resources
Full Text Sources
Other Literature Sources
Medical
