. 2016 Mar 1:5:e11305.
doi: 10.7554/eLife.11305.

Characterizing a psychiatric symptom dimension related to deficits in goal-directed control

Affiliations

Characterizing a psychiatric symptom dimension related to deficits in goal-directed control

Claire M Gillan et al. Elife. .

Abstract

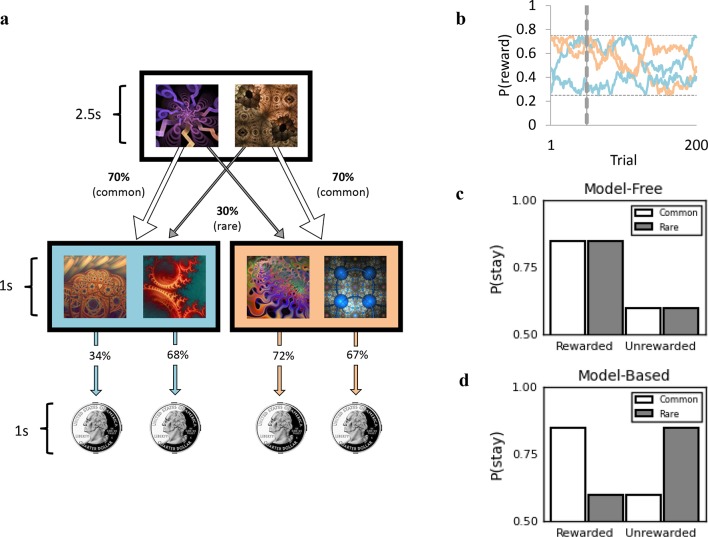
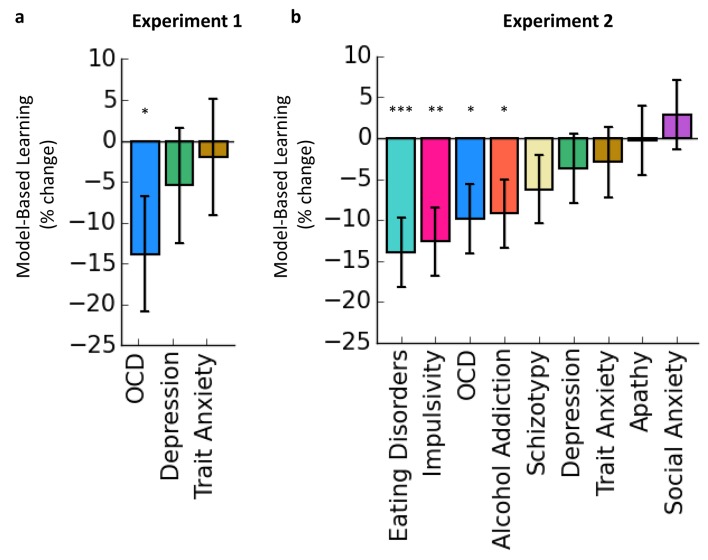
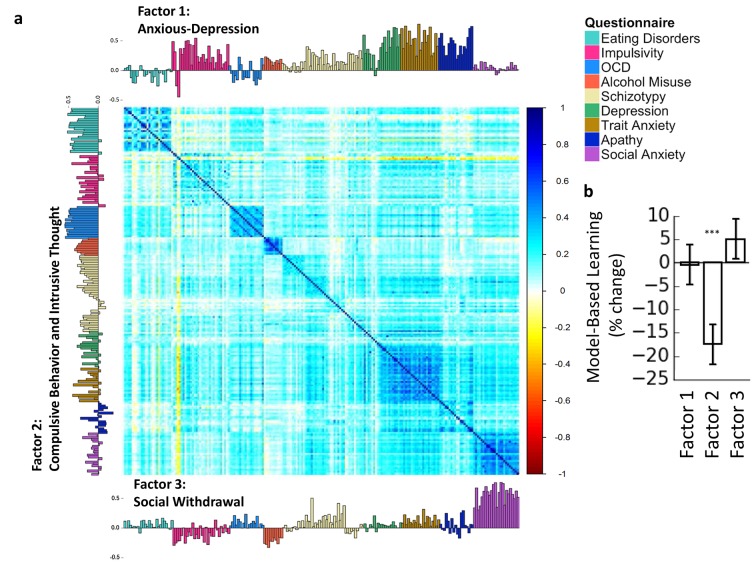
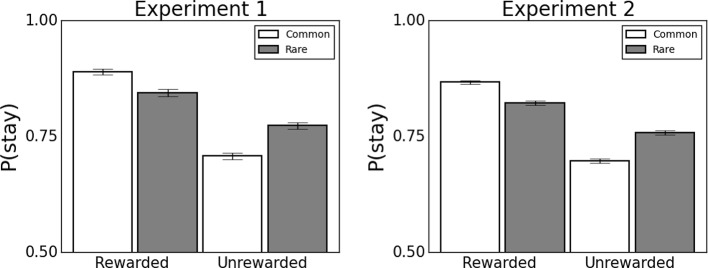
Prominent theories suggest that compulsive behaviors, characteristic of obsessive-compulsive disorder and addiction, are driven by shared deficits in goal-directed control, which confers vulnerability for developing rigid habits. However, recent studies have shown that deficient goal-directed control accompanies several disorders, including those without an obvious compulsive element. Reasoning that this lack of clinical specificity might reflect broader issues with psychiatric diagnostic categories, we investigated whether a dimensional approach would better delineate the clinical manifestations of goal-directed deficits. Using large-scale online assessment of psychiatric symptoms and neurocognitive performance in two independent general-population samples, we found that deficits in goal-directed control were most strongly associated with a symptom dimension comprising compulsive behavior and intrusive thought. This association was highly specific when compared to other non-compulsive aspects of psychopathology. These data showcase a powerful new methodology and highlight the potential of a dimensional, biologically-grounded approach to psychiatry research.

Keywords: compulsive; computational; dimensional; goal-directed; habit; human; human biology; medicine; neuroscience; psychiatry.


Conflict of interest statement

The authors declare that no competing interests exist.

Figures

Figure 1.
Figure 1.. Two-step reinforcement learning task used to assess goal-directed (model-based) learning.
(a) Subjects chose between two fractals, which probabilistically determined whether they would transition to the orange or blue second stage state. For example, the fractal on the left had a 70% chance of leading to the blue second stage state (‘common’ transition) and a 30% chance of leading to the orange state (‘rare’ transition). These transition probabilities were fixed and could be learned over time. In the second stage state, subjects chose between two fractals, each of which was associated with a distinct probability of being rewarded with a 25 cents coin. The probability of receiving a reward associated with each second stage fractal could also be learned, but (unlike the transition structure) these drifted slowly over time (0.25 < P <0.75, panel b). This meant that in order to earn the most rewards possible, subjects had to track which second stage fractals were currently best as they changed over time. Reward probabilities depicted (34%, 68%, 72%, 67%) refer to example trial 50, denoted by the vertical dashed line in (b). (b) Drifting reward probabilities determined by Gaussian Random Walks for 200 trials with grey horizontal lines indicating boundaries at 0.25 and 0.75. (c) Schematic representing the performance of a purely ‘model-free’ learner, who only exhibits sensitivity to whether or not the previous trial was rewarded vs. unrewarded, and does not modify their behavior in light of the transition that preceded reward. (d) Schematic representing the performance of a purely ‘model-based’ learner, who is more likely to repeat an action (i.e. ‘stay’) following a rewarded trial, only if the transition was common. If the transition to that rewarded state was rare, they are more likely to switch on the next trial. DOI: http://dx.doi.org/10.7554/eLife.11305.003
Figure 2.
Figure 2.. Associations between Goal-directed (model-based) deficits and self-reported psychopathology.
The y-axes indicate the% change in model-based learning for each change of 1 standard deviation (SD) of clinical symptoms. Error bars denote standard error. (a) In Experiment 1, total scores on a self-report questionnaire assessing OCD symptoms in a general population sample were associated with deficits in goal-directed (model-based) learning. Specifically, for each increase of 1 SD in OCD symptoms reported, model-based learning was 14% lower than the group mean. No effects were observed in depression or trait anxiety. (b) In Experiment 2, the results from Experiment 1 were replicated: OCD symptoms were associated with deficits in goal-directed learning, while total scores on questionnaires assessing depression and trait anxiety were not. We found that the association between compulsive behavior and goal-directed deficits generalized to symptoms associated with other disorders that are similarly characterized by a loss of control over behavior, alcohol addiction, eating disorders and impulsivity. No significant effects were observed for scores on questionnaires assessing schizotypy, depression, trait anxiety, apathy or social anxiety. DOI: http://dx.doi.org/10.7554/eLife.11305.005
Figure 3.
Figure 3.. Trans-diagnostic factors.
(a) Factor analysis on the correlation matrix of 209 questionnaire items suggested that 3-factor solution best explained these data. Factors were ‘Anxious-Depression’, ‘Compulsive Behavior and Intrusive Thought’ and ‘Social Withdrawal’. Item loadings for each factor are presented on the top, left and bottom sides of the correlation matrix, color-codes indicate the questionnaire from which each item was drawn. (b) These factors were entered into mixed-effects models, revealing that only the Factor 2 ‘Compulsive Behavior and Intrusive Thought’ was associated with goal-directed deficits, the effect size (17% reduction in model-based learning for every 1 SD increase in ‘Compulsive Behavior and Intrusive Thought’) was larger than for any individual questionnaire, and pairwise contrasts revealed that these deficits were specific to this factor, compared to Factor 1 ‘Anxious-Depression’ and Factor 3 ‘Social Withdrawal’. The y-axes indicate the% change in model-based learning for each change of 1 standard deviation (SD) of clinical symptomatology. Error bars denote standard error. DOI: http://dx.doi.org/10.7554/eLife.11305.007
Figure 4.
Figure 4.. Behavioral data from experiments 1 (N=548) and 2 (N=1413).
Error bars denote standard error. Data illustrate that consistent with previous studies (Daw et al., 2011), participants use a mixture of model-based and model-free learning to guide choice. Associated statistics are presented in Supplementary file 1B. *p<0.05 **p<0.01 ***p<0.001. DOI: http://dx.doi.org/10.7554/eLife.11305.009
Figure 5.
Figure 5.. Scree plot of eigenvalues.
The outer frame shows the eigenvalues for every possible factor solution, N=209. Inset is data for the first 20 potential factor solutions only. An empirically defined elbow, where Eigenvalues begin to level out, was identified at factor 4 using the nFactors package in R, provideing evidence for a 3-factor solution (Cattell, 1966), indicated in orange.*p<0.05 **p<0.01 ***p<0.001. DOI: http://dx.doi.org/10.7554/eLife.11305.010
Author response image 1.
Author response image 1.. Plotted are the regression lines for 18 different analyses, where the population was split into the top 25% and bottom 75% for each of the nine clinical questionnaires.
DOI: http://dx.doi.org/10.7554/eLife.11305.016

References

    1. Alvares GA, Balleine BW, Guastella AJ. Impairments in goal-directed actions predict treatment response to cognitive-behavioral therapy in social anxiety disorder. PLoS ONE. 2014;9:e11305. doi: 10.1371/journal.pone.0094778. - DOI - PMC - PubMed
    1. American Psychiatric Association . (5 edn) American Psychiatric Publishing; 2013. Diagnostic and Statistical Manual of Mental Disorders.
    1. Arffa S. The relationship of intelligence to executive function and non-executive function measures in a sample of average, above average, and gifted youth. Archives of Clinical Neuropsychology. 2007;22:969–978. doi: 10.1016/j.acn.2007.08.001. - DOI - PubMed
    1. Baker F. Marcel Dekker; 1992. Item Response Theory: Parameter Estimation Techniques.
    1. Bezanson J, Karpinski S, Shah VB, Edelman A. Julia: a fast dynamic language for technical computing. MIT 2012

Publication types