. 2016 Feb 29;11(2):e0150370.
doi: 10.1371/journal.pone.0150370. eCollection 2016.

Relationships between Head Circumference, Brain Volume and Cognition in Children with Prenatal Alcohol Exposure

Affiliations

Relationships between Head Circumference, Brain Volume and Cognition in Children with Prenatal Alcohol Exposure

Sarah Treit et al. PLoS One. .

Abstract

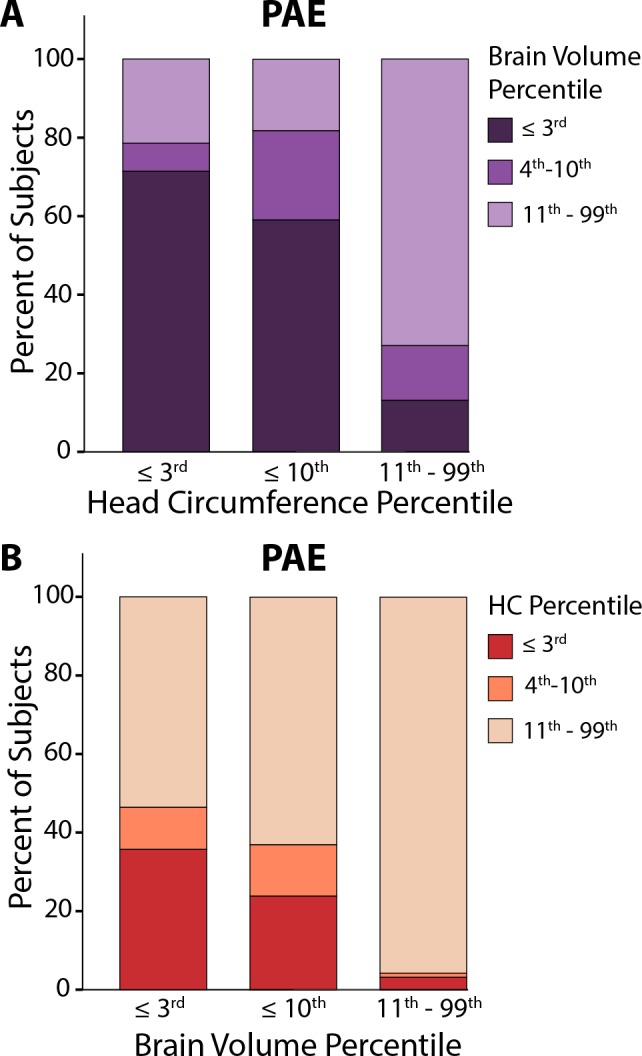
Head circumference is used together with other measures as a proxy for central nervous system damage in the diagnosis of fetal alcohol spectrum disorders, yet the relationship between head circumference and brain volume has not been investigated in this population. The objective of this study is to characterize the relationship between head circumference, brain volume and cognitive performance in a large sample of children with prenatal alcohol exposure (n = 144) and healthy controls (n = 145), aged 5-19 years. All participants underwent magnetic resonance imaging to yield brain volumes and head circumference, normalized to control for age and sex. Mean head circumference, brain volume, and cognitive scores were significantly reduced in the prenatal alcohol exposure group relative to controls, albeit with considerable overlap between groups. Males with prenatal alcohol exposure had reductions in all three measures, whereas females with prenatal alcohol exposure had reduced brain volumes and cognitive scores, but no difference in head circumference relative to controls. Microcephaly (defined here as head circumference ≤ 3rd percentile) occurred more often in prenatal alcohol exposed participants than controls, but 90% of the exposed sample had head circumferences above this clinical cutoff indicating that head circumference is not a sensitive marker of prenatal alcohol exposure. Normalized head circumference and brain volume were positively correlated in both groups, and subjects with very low head circumference typically had below-average brain volumes. Conversely, over half of the subjects with very low brain volumes had normal head circumferences, which may stem from differential effects of alcohol on the skeletal and nervous systems. There were no significant correlations between head circumference and any cognitive score. These findings confirm group-level reductions in head circumference and increased rates of microcephaly in children with prenatal alcohol exposure, but raise concerns about the predictive value of this metric at an individual-subject level.


Conflict of interest statement

Competing Interests: The authors have declared that no competing interests exist.

Figures

Fig 1
Fig 1
Inter-site reliability of (A) brain volume and (B) head circumference measurements from 8 adult subjects, scanned twice each at all four sites. For both brain volume and head circumference measurements, within-subject variability was much lower than between subject variability (as reflected by ICCs of 0.994 and 0.995, respectively) suggesting that data can be combined across scanners for these measures without obvious bias.
Fig 2
Fig 2
Head circumference increased with age for both males (blue) and females (red) in both groups (A, B), and HC was lower in PAE than controls for males but not females (C). Brain volume did not change with age in either group (D,E), and was consistently reduced in PAE relative to controls for both males and females (F). IQ standard scores did not change with age in either group (G, H), and were again lower in the PAE group (I). Sex differences within groups were larger in the control group for both head circumference (C) and brain volume (F). ns = non-significant.
Fig 3
Fig 3
(A) Head circumference (HC) standard deviation distributions showing a shift towards the number of participants with higher normed HC in controls and lower normed HC in PAE subjects, albeit with substantial overlap between groups. (B) Z score distribution for total brain volume is left- shifted in the PAE group (grey curve) relative to controls (black curve). PAE distribution curves for brain lobe volumes show similar leftward shifts towards negative Z scores. (C) Likewise, IQ score profile is right-shifted in the control group compared to PAE (C), peaking above the population norm of 100 in controls, and below in the PAE group.
Fig 4
Fig 4
Brain volume Z scores and normed head circumference (HC) standard deviations are shown to positively correlate in both the control (A) and prenatal alcohol exposure (PAE) groups (B).
Fig 5
Fig 5
Age-standardized IQ versus normed head circumference standard deviation, showing non-significant relationships in both the control (A) and PAE groups (B), despite significant correlations between brain volume Z score and normed HC SD in this subset of participants (C,D). Likewise, there does not appear to be any systematic pattern/grouping of IQ in controls (C) or PAE (D) again demonstrating that those with the smallest normed HC and brain volume did not show consistently lower IQ scores.
Fig 6
Fig 6. When only including the 14 PAE participants below the clinical cutoff for microcephaly (HC ≤ 3rd percentile, A–column 1), it is notable that 10 (~70%) of the subjects have brain volumes below the 3rd percentile.
Similarly, ~80% of the subjects with HC ≤ 10th percentile have brain volumes under the 10th percentile (A–column 2). Conversely, among the PAE participants with total brain volume ≤ 3rd (n = 14, B–column 1) or 10th percentile (n = 22, B—column 2), 55–65% of subjects have HC in the ‘normal’ range from the 11th-99th percentiles, suggesting a disconnect between small brain volumes and head circumference. Note that the category of ≤ 10th percentile on the x-axis of A and B includes subjects who are ≤ 3rd percentile (to match cutoffs used in various diagnostic guidelines), while colour divisions within each bar are non-overlapping.

References

    1. Rollins JD, Collins JS, Holden KR. United States Head Circumference Growth Reference Charts: Birth to 21 Years. Journal of Pediatrics. 2010;156(6):907–913. 10.1016/j.jpeds.2010.01.009 - DOI - PubMed
    1. Bartholomeusz HH, Courchesne E, Karns CM. Relationship between head circumference and brain volume in healthy normal toddlers, children, and adults. Neuropediatrics. 2002;33(5):239–41. - PubMed
    1. Ivanovic DM, Leiva BP, Perez HT, Olivares MG, Diaz NS, Urrutia MSC, et al. Head size and intelligence, learning, nutritional status and brain development Head, IQ, learning, nutrition and brain. Neuropsychologia. 2004;42(8):1118–31. - PubMed
    1. O'Connell EJ, Feldt RH, Stickler GB. Head Circumference Mental Retardation and Growth Failure. Pediatrics. 1965;36(1):62–66. - PubMed
    1. Wright CM, Emond A. Head Growth and Neurocognitive Outcomes. Pediatrics. 2015;135(6):E1393–E8. 10.1542/peds.2014-3172 - DOI - PubMed

Publication types