. 2016 Apr;22(4):369-78.
doi: 10.1038/nm.4053. Epub 2016 Feb 29.

Substantial interindividual and limited intraindividual genomic diversity among tumors from men with metastatic prostate cancer

Affiliations

Substantial interindividual and limited intraindividual genomic diversity among tumors from men with metastatic prostate cancer

Akash Kumar et al. Nat Med. 2016 Apr.

Abstract

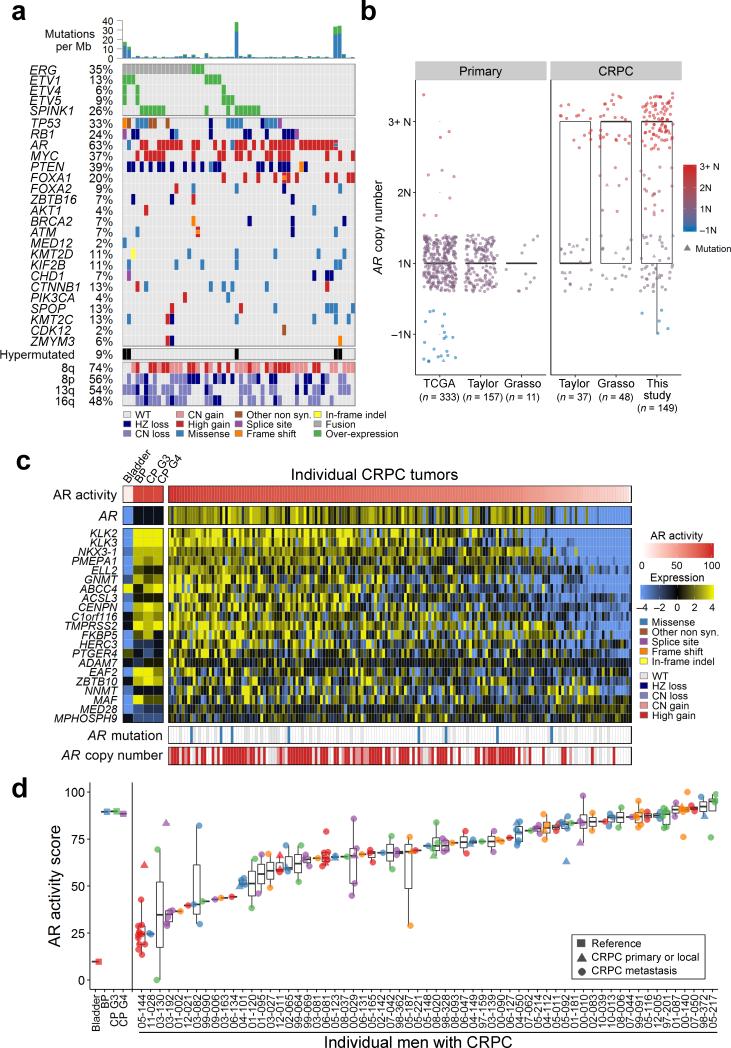
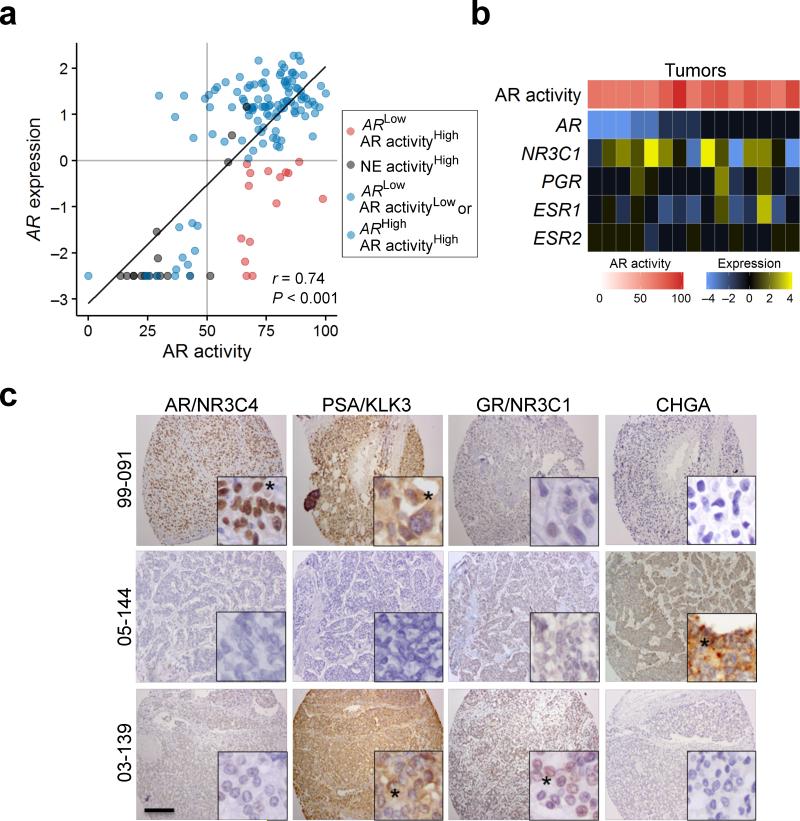
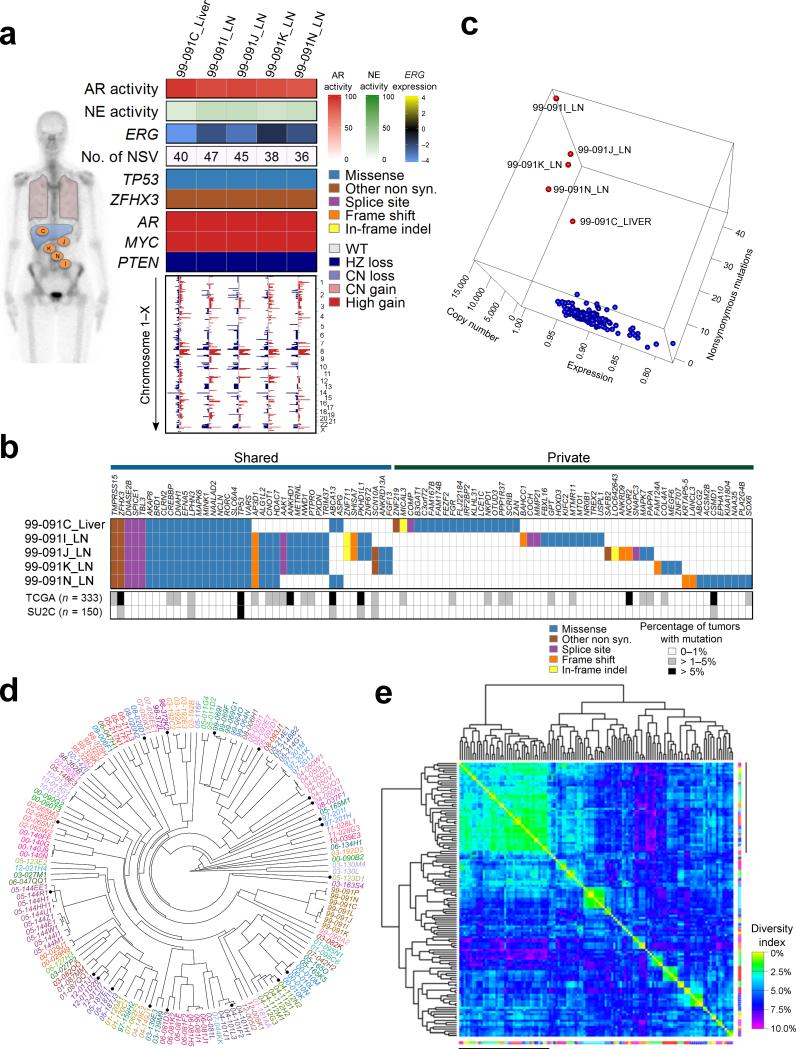
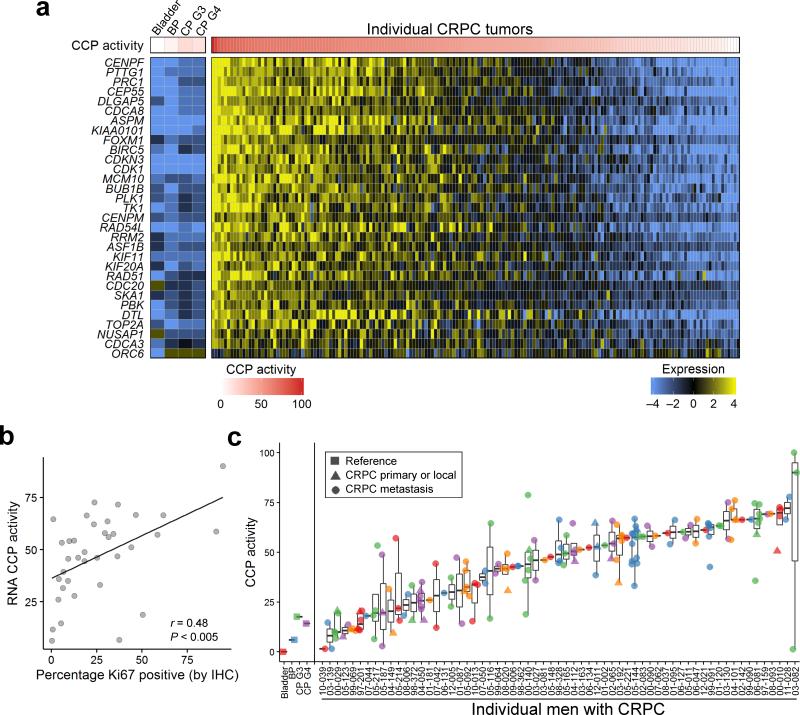
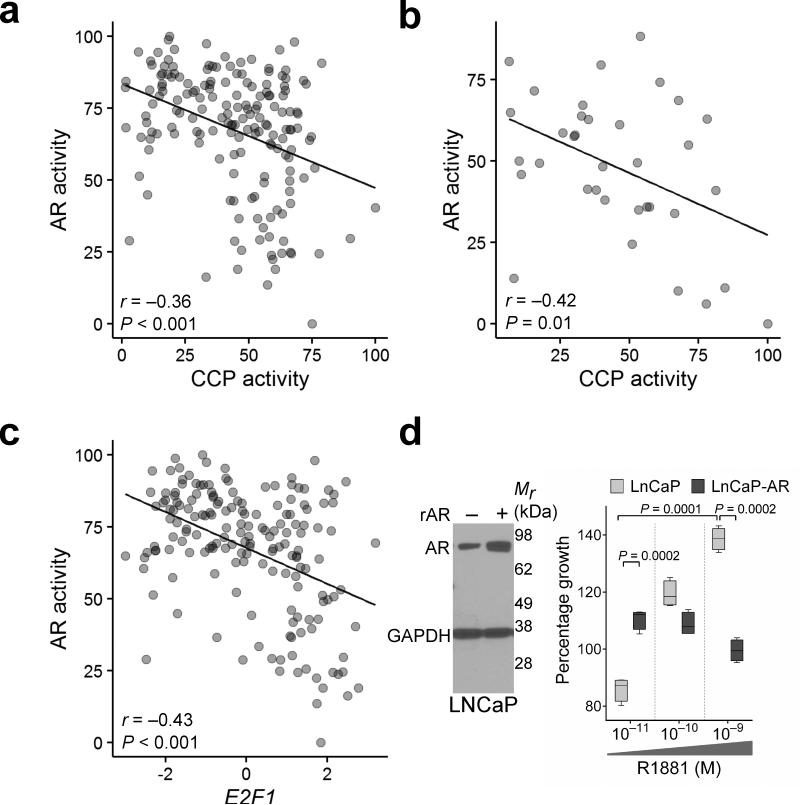
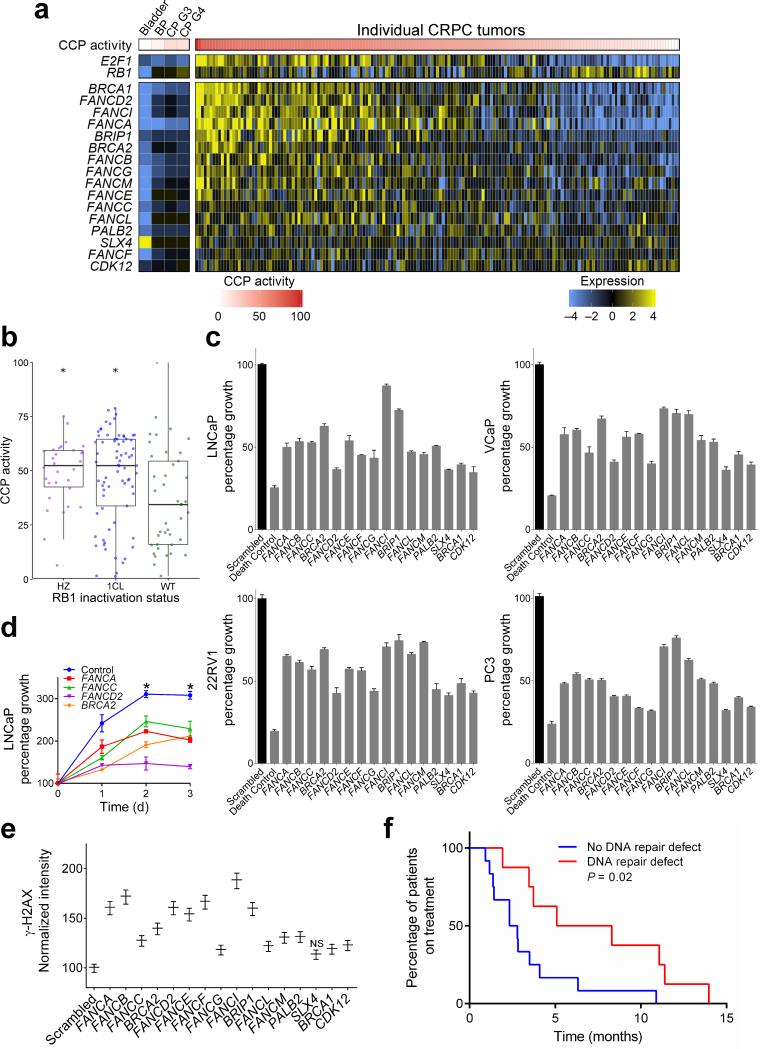
Tumor heterogeneity may reduce the efficacy of molecularly guided systemic therapy for cancers that have metastasized. To determine whether the genomic alterations in a single metastasis provide a reasonable assessment of the major oncogenic drivers of other dispersed metastases in an individual, we analyzed multiple tumors from men with disseminated prostate cancer through whole-exome sequencing, array comparative genomic hybridization (CGH) and RNA transcript profiling, and we compared the genomic diversity within and between individuals. In contrast to the substantial heterogeneity between men, there was limited diversity among metastases within an individual. The number of somatic mutations, the burden of genomic copy number alterations and aberrations in known oncogenic drivers were all highly concordant, as were metrics of androgen receptor (AR) activity and cell cycle activity. AR activity was inversely associated with cell proliferation, whereas the expression of Fanconi anemia (FA)-complex genes was correlated with elevated cell cycle progression, expression of the E2F transcription factor 1 (E2F1) and loss of retinoblastoma 1 (RB1). Men with somatic aberrations in FA-complex genes or in ATM serine/threonine kinase (ATM) exhibited significantly longer treatment-response durations to carboplatin than did men without defects in genes encoding DNA-repair proteins. Collectively, these data indicate that although exceptions exist, evaluating a single metastasis provides a reasonable assessment of the major oncogenic driver alterations that are present in disseminated tumors within an individual, and thus may be useful for selecting treatments on the basis of predicted molecular vulnerabilities.


Figures

Figure 1
Figure 1. Integrated landscape of somatic aberrations and AR activity in mCRPC
(a) Recurrent somatic molecular aberrations from an index metastasis from each of 54 men with mCRPC (columns) ascertained by transcript microarray, array CGH and WES on the same tumor. Columns represent the index tumor from each individual, and rows represent specific genes. Mutations per Mb are shown in the upper histogram. The frequency of the aberration in the cohort is shown as a percentage (%). Copy number variations (CNVs) common to mCRPC are shown in the lower matrix, with red representing gain and blue representing loss. Color legends including amplification, two-copy loss, one copy loss, copy neutral loss of heterozygosity (LOH), splice site mutation, frameshift mutation, missense mutation, in-frame indel, and gene fusion. Cases with more than one aberration in a gene are represented by split colors. Except for arm level CNVs, only high-level gain and loss are shown. The 54 patients with expression, CN, and mutations data are shown. (b) AR copy number quantitation in three studies of untreated primary prostate cancer and three studies comprising mCRPC. (c) AR activity as determined by transcript levels of 21 AR-regulated genes across CRPC tumors obtained at rapid autopsy. AR activity scores are also shown for microdissected cell populations of bladder urothelium (Bladder) benign prostate epithelium (BP), primary PC of Gleason grade 6 (CP G3) and primary PC of Gleason grade >6 (CP G4). AR somatic mutation and copy number status for each tumor sample are shown in the lower matrix. (d) Consistency of the AR activity score for metastatic tumors within individuals and diversity of the AR activity score in tumors between individuals. The x-axis is the AR activity score and y-axis shows individual men. Scores for individual tumors are plotted over a range of 0–100% and colors are used to denote different patients. Circles are metastatic tumors (n = 149) and triangles are primary tumors (n = 22) resected at rapid autopsy.
Figure 2
Figure 2. Relationships between AR activity and the expression of AR and other nuclear hormone receptors
(a) The relationship between AR transcript expression plotted as mean centered log2 ratio to the AR activity score for each tumor. Blue points represent adenocarcinomas where AR activity levels correlate with AR level; black points are neuroendocrine tumors; red circles are tumors with high AR activity and relatively low AR expression. There was a positive overall correlation between AR transcript levels and AR activity score (r = 0.74, P < 0.001) using Pearson's correlation coefficient, (b) Transcript levels of nuclear hormone receptors for the 15 tumors with high AR activity and low AR expression. NR3C1, glucocorticoid receptor; PGR, progesterone receptor; ESR1, estrogen receptor alpha, ESR2, estrogen receptor beta. (c) Immunohistochemical assessment of AR (NR3C4), GR (NR3C1), PSA (KLK3) and chromogranin (CHGA) protein in mCRPC tumors from three men with different AR expression and AR activity relationships: 99-091 expresses AR and the AR regulated protein PSA while 03-139 lacks AR expression but expresses GR (NR3C1) and PSA (KLK3). Black asterisk indicates cells with positive staining. Black scale bar is 200 micrometers.
Figure 3
Figure 3. Molecular aberrations are shared between metastasis within individuals with mCRPC
(a) Gene expression pathways and putative somatic driver aberrations are consistent across metastasis within an individual. Shown are selected features from five metastatic tumors from patient 99-091. Activity scores comprise transcripts of genes regulated by the AR (AR activity score), genes expressed in neuroendocrine carcinoma (NE activity score). ERG transcript levels are relative to the mean-centered ratio for the cohort. NSV is the number of somatic nonsynonymous nucleotide variants. Genome wide copy number losses (blue) and gains (red) are shown for each tumor ordered by chromosome. (b) Distribution of all 91 nonsynonymous point mutations and indels identified in the five tumors from patient 99-091. The table indicates the presence of a mutation (blue/tan/purple/orange/yellow) or its absence (white) in each tumor. The grey scale bars indicate the frequency of a mutation in the specified gene in the TCGA (primary tumors) or SU2C (metastatic tumors) datasets. (c) Relationships of tumors derived from a single patient (red points) relative to tumors from all other individuals (blue points) based on a calculated a sample similarity score that comprised single nucleotide alterations, copy number alterations, and gene expression using the 133 tumors with data on all three platforms. (d) Unsupervised clustering of 149 tumors by correlation of genome-wide copy number variations. Tumors from the same individual are designated with the same color. Primary tumors are noted by a black circle. (e) Heatmap of the percent of the total of 984 distinct copy number losses and gains identified in the entire cohort of tumors that differ between samples and sorted based on complete linkage dendrograms. Margin line denotes tumors with very low copy number aberration burden. The diversity index is defined as the proportion of corresponding aberrations that differed between samples.
Figure 4
Figure 4. Tumor cell cycle activity within and between patients
(a) Cell cycle progression (CCP) scores based on the expression of 31 cell cycle-associated transcripts vary across tumors. The genes comprising the CCP score are shown with expression levels colored to reflect high (yellow) or low (blue) transcript abundance. Columns represent individual tumors excepting Bladder; BP, benign prostate; CP3, primary PC with Gleason grade 6; CP4, primary PC with Gleason pattern ≥ 7, which are composites of 10 to 20 samples. The 171 CRPC tumors from 63 patients with expression data are shown. (b) Correlation between CCP score and Ki67 IHC (r = 0.48, P < 0.005) in 36 tumors with matching protein and RNA expression data. (c) Cell cycle progression scores (y-axis) for each of 171 tumors grouped by patient (x-axis). BP, benign prostate epithelium; CP, primary prostate cancer; G, Gleason pattern.
Figure 5
Figure 5. Cell cycle progression activity and E2F1 expression are inversely associated with AR activity
(a) CCP scores are inversely associated with AR activity scores as determined by the expression levels of 21 AR-regulated genes in 171 tumors (r = −0.36, P < 0.001). (b) Inverse association between CCP scores and AR activity scores was also observed in the Grasso et al. dataset of 35 CRPC tumors (r = −0.42, P = 0.01). (c) AR activity is inversely associated with E2F1 transcript expression in 171 tumors (r = −0.43, P < 0.001). (d) AR expression level influences cellular responses to the AR ligand R1881. Representative Western blot (n = 2) of AR and GAPDH protein levels in wild type LNCaP cells and LNCaP-AR cells engineered to overexpress AR (rAR) (left panel). LNCaP and LNCaP-AR cell growth measured 72 h after exposure to the indicated R1881 concentration, n = 4 in each group (right panel).
Figure 6
Figure 6. Expression levels of Fanconi Anemia complex genes are associated with cell cycle progression and E2F1 expression
(a) CCP scores for each tumor are ordered from high (left) to low (right). Corresponding Fanconi Anemia complex genes expressed in each tumor are colored to reflect high (yellow) or low (blue) transcript abundance. Columns represent individual tumors excepting Bladder; BP, benign prostate; CP G3, primary PC with Gleason pattern 3; CP G4, primary PC with Gleason pattern 4, which are composites of 10 to 20 samples. The 171 CRPC tumors from 63 patients with expression data are shown. (b) Higher cell cycle progression score is associated with heterozygous and homozygous RB1 inactivation by copy loss and/or mutation (asterisk indicates P < 0.01 by pairwise t-test to WT group). HZ, homozygous loss; 1CL, heterozygous loss, WT, wild-type. (c) Suppression of individual Fanconi anemia complex genes reduces the proliferation of multiple prostate cancer cell lines. Cell numbers were measured 5 d after introducing siRNAs targeting the specified genes relative to scrambled control siRNAs (n = 3 biological replicates per gene). All gene knockdowns produced a significant reduction in growth compared to scrambled control (2 sample t-test P < 0.05). (d) Time course of LNCaP growth following the suppression of individual Fanconi Anemia complex genes. Growth curves measured over 3 days after introducing siRNAs targeting the specified genes. Asterisk indicates a significant difference in percent growth compared to control for each time point using two-sample t-tests with P < 0.05). (e) Assessment of DNA damage in LNCaP cells by γ–H2AX assays following the knockdown of individual FA genes by siRNA and exposure to 50μM carboplatin. All FA knockdowns produced significantly greater γ–H2AX compared to scrambled siRNA controls (P < 0.05) excepting SLX4. (f) Kaplan-Meier plot comparing the duration of carboplatin treatment (months) for 21 men with metastatic CRPC with or without a germline or somatic alteration in genes involved in DNA repair: BRCA2, PALB2, or ATM (P = 0.02 by logrank test).

References

    1. National Research Council (U.S.) Toward precision medicine : building a knowledge network for biomedical research and a new taxonomy of disease. National Academies Press; Washington, D.C.: 2011. Committee on A Framework for Developing a New Taxonomy of Disease. - PubMed
    1. Perou CM, et al. Molecular portraits of human breast tumours. Nature. 2000;406:747–752. - PubMed
    1. Frattini V, et al. The integrated landscape of driver genomic alterations in glioblastoma. Nat Genet. 2013;45:1141–1149. - PMC - PubMed
    1. Sato Y, et al. Integrated molecular analysis of clear-cell renal cell carcinoma. Nat Genet. 2013;45:860–867. - PubMed
    1. Verhaak RG, et al. Prognostically relevant gene signatures of high-grade serous ovarian carcinoma. J Clin Invest. 2013;123:517–525. - PMC - PubMed

Publication types

MeSH terms