. 2016 Apr;22(4):397-403.
doi: 10.1038/nm.4052. Epub 2016 Feb 29.

Major histocompatibility complex class I molecules protect motor neurons from astrocyte-induced toxicity in amyotrophic lateral sclerosis

Affiliations

Major histocompatibility complex class I molecules protect motor neurons from astrocyte-induced toxicity in amyotrophic lateral sclerosis

SungWon Song et al. Nat Med. 2016 Apr.

Abstract

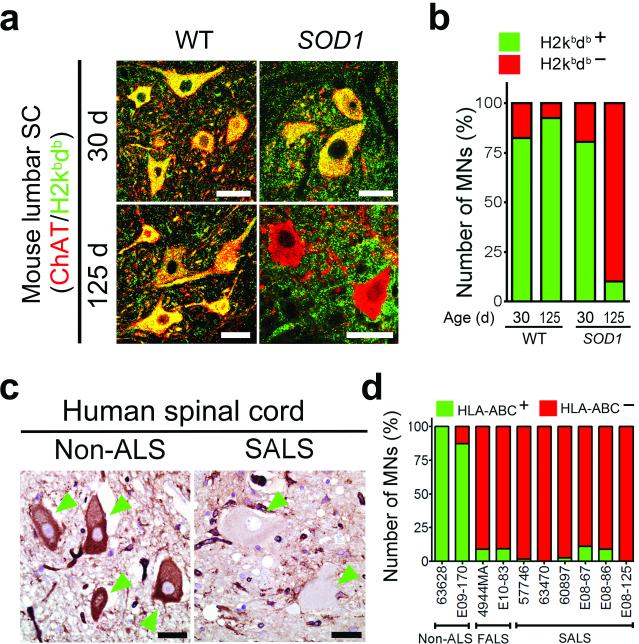
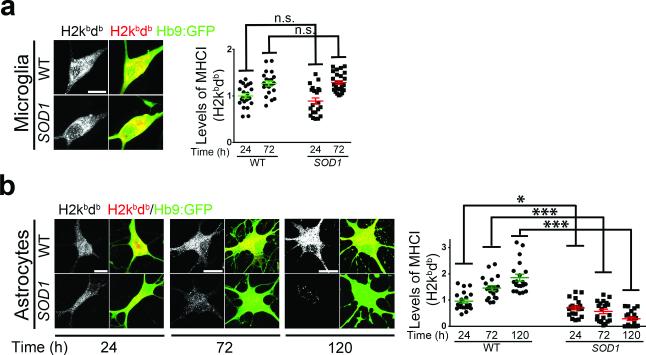
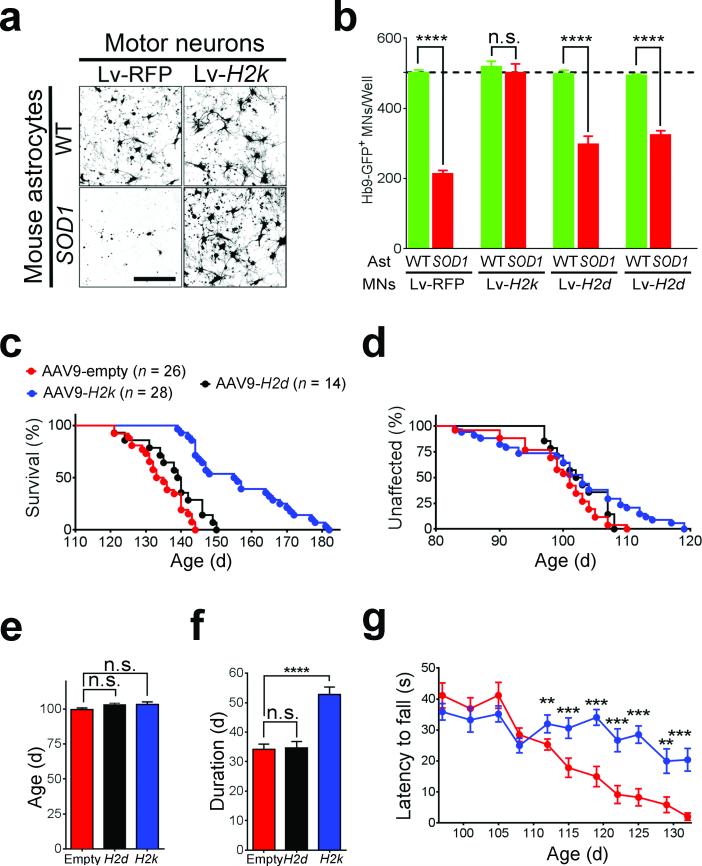
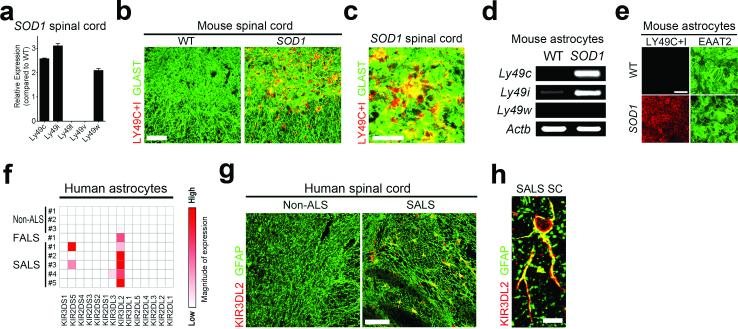
Astrocytes isolated from individuals with amyotrophic lateral sclerosis (ALS) are toxic to motor neurons (MNs) and play a non-cell autonomous role in disease pathogenesis. The mechanisms underlying the susceptibility of MNs to cell death remain unclear. Here we report that astrocytes derived from either mice bearing mutations in genes associated with ALS or human subjects with ALS reduce the expression of major histocompatibility complex class I (MHCI) molecules on MNs; reduced MHCI expression makes these MNs susceptible to astrocyte-induced cell death. Increasing MHCI expression on MNs increases survival and motor performance in a mouse model of ALS and protects MNs against astrocyte toxicity. Overexpression of a single MHCI molecule, HLA-F, protects human MNs from ALS astrocyte-mediated toxicity, whereas knockdown of its receptor, the killer cell immunoglobulin-like receptor KIR3DL2, on human astrocytes results in enhanced MN death. Thus, our data indicate that, in ALS, loss of MHCI expression on MNs renders them more vulnerable to astrocyte-mediated toxicity.


Figures

Figure 1
Figure 1. MHCI expression is reduced on spinal MNs in end-stage ALS
(a) Representative immunofluorescence images (from three images evaluated) showing MHCI (H2db/H2kb) expression in MNs at 30 and 125 days in SOD1G93A mice. (b) Percent of MHCI positive lumbar spinal cord MNs in SOD1G93A and control mice evaluated as shown in (a) For each group, two animals were used and MNs counts were pulled together. 321, 216, 216, 154 MNs were counted in graph columns 1 through 4. (c) Immunohistochemical analysis of MHCI (HLA-ABC) expression in spinal MNs of individuals with ALS post-mortem. Green arrowheads point to MNs. (d) Percent of MHCI positive MNs in the spinal cords of individuals with ALS individuals and controls determined as shown in (c). For analysis two non-ALS, two FALS and 6 SALS individuals were analyzed. 50, 60, 35, 51, 71, 87, 45, 46, 68 and 22 of MNs were counted in graph columns 1 through 10. WT, wild-type mouse. SOD1, SOD1G93A mouse. Scale bars 20 μm.
Figure 2
Figure 2. ALS astrocytes induce down-regulation of MHCI expression in MNs
(a,b) Representative immunofluorescence images (of three independent experiments) showing MHCI (H2db/H2kb) expression in MNs cultured in the presence of either wild type or SOD1G93A microglia for 72 hours (a) and measurement of their MHCI expression relative to levels found in MNs cultured with wild type microglia for 24h (b). (c,d) Representative immunofluorescence images (of three independent experiments) showing MHCI (H2db/H2kb) expression in MNs cultured in the presence of either wild type or SOD1G93A astrocytes during a 120 hours period (c) and measurement of their MHCI expression relative to levels found in MNs cultured with wild type astrocytes for 24h (d). Experiments were made in triplicate. Levels of MHCI are expressed as mean fluorescence intensity (MFI) found in MNs. Error bars represent s.e.m.. Each dot in graphs (b and d) represents MHCI level found per MN (One-Way ANOVA, *P<0.05; ***P<0.001; n.s., non-significant P≥0.05). WT, wild-type mouse. SOD1, SOD1G93A mouse. Scale bars 10 μm.
Figure 3
Figure 3. H2kb expression protects MNs from ALS astrocyte-induced toxicity and delays disease progression in SOD1G93A mice
(a) Representative immunofluorescence images (of three independent experiments) of MNs expressing either RFP or H2k and cultured in the presence of wild type or SOD1G93A astrocytes for 120 hours. Scale bar 100 μm. (b) Survival of MNs expressing either, RFP, H2k, H2k or H2l and cultured in the presence of wild type or SOD1G93A astrocytes for 120 hours. Data shown is a representative of three independent experiments and is displayed as the mean ± s.e.m of counts three replicates (****P<0.0001; n.s., non-significant, one-Way ANOVA). (c) Kaplan-Meier survival curve of female SOD1G93A mice treated with AAV9-H2k (n = 28), AAV9-H2k (n = 14) or AAV9-empty controls (n = 26). Mean survival, AAV9-H2k 156.9 ± 2.6, AAV9-H2k 139.2 ± 1.4, AAV-9-empty 135.5 ± 1.6 days, mean ± s.e.m, P< 0.0001, unpaired t-test. (d,e) Age of onset observed in AAV9 treated SOD1G93A mice and displayed by the Kaplan-Meier curve (d) and the mean age of onset (e). AAV9-H2k 103.3 ± 2.0, AAV9-H2k 103.1 ± 1.2 days, AAV-9-empty 99.73 ± 1.2, mean ± s.e.m, P=0.1, unpaired t- test. (f) Mean disease progression observed in AAV9 treated SOD1G93A mice. AAV9-H2k, 52.7 ± 2.6; AAV9-H2k, 34.62 ± 2.2; AAV9-empty 34.1 ± 1.8 days, mean ± s.e.m, P<0.0001, unpaired t-test. (g) Rotarod performance of AAV9-H2k treated SOD1G93A mice compared with age-matched controls, mean ± s.e.m, *P<0.05; **P<0.01; ***P<0.005, unpaired t- test. WT, wild-type. SOD1, SOD1G93A. Ast, astrocytes.
Figure 4
Figure 4. ALS astrocytes express MHCI inhibitory receptors
(a-e) Evaluation of the expression of MHCI inhibitory receptors found in SOD1G93A mice spinal cord at disease end-stage (a-c) or astrocytes lines (d-e), by RNA analysis (a,d) or immunohistochemistry analysis (b,c,e). (f-h) Expression of the MHCI inhibitory receptor KIR3DL2 in human ALS astrocytes cell lines as determined by RNA analysis (f) and in sections of spinal cord from SALS post–mortem tissue (g-h). Data presented in (a-h) is a representative of finding form three independent experiments. WT, wild-type. SOD1, SOD1G93A. Scale bars 50 μm (b), 200 μm (e, g), 10 μm (c), 5 μm (h).
Figure 5
Figure 5. HLA-F expression protects human MNs from ALS astrocyte-induced toxicity
(a) Representative images (from three independent experiments) of immunohistochemistry analysis performed in human spinal cord tissue probing for HLA-F expression. Green arrowheads point to MNs. HLA-F was visualized by 3,3'-Diaminobenzidine (DAB) staining. (b) Percent of HLA-F positive MNs found in human spinal cords of ALS individuals and control determined as shown in (a). For columns 1 through 5, the total number of MNs was 62, 58, 54, 26 and 42, respectively. Scale bars 20 μm. Number at the bottom of the columns represent subject ID number. (c) Microscope images of human ESC derived MNs used to evaluate morphology and expression of prototypic MN markers. (d) RNA (upper panel) and immunocytochemistry analysis (lower panel) of lentivirus infected cells displaying HLA-F and eGFP expression in human MNs. (e) Representative images (from three independent experiments) of human MNs expressing HLA-F and co-cultured with FALS and SALS astrocyte visualized by ChAT staining. (f) Quantification of the number of surviving MNs as shown in (e). Dotted line represents average MN counts when co-cultured with non-ALS controls. Data shows a representative of three independent experiments and is displayed as the mean ± s.e.m counts of triplicates. (One-Way ANOVA, *P< 0.05; **P< 0.01; ***P<0.001; ns, non-significant P≥0.5). Scale bars 20 μm (a), 50 μm (c-d), 100 μm (e).

Comment in

References

    1. Hardiman O, van den Berg LH, Kiernan MC. Clinical diagnosis and management of amyotrophic lateral sclerosis. Nat Rev Neurol. 2011;7:639–649. - PubMed
    1. Brown RH., Jr. Amyotrophic lateral sclerosis. Insights from genetics. Arch Neurol. 1997;54:1246–1250. - PubMed
    1. Kwiatkowski TJ, Jr., et al. Mutations in the FUS/TLS gene on chromosome 16 cause familial amyotrophic lateral sclerosis. Science. 2009;323:1205–1208. - PubMed
    1. Rosen DR, et al. Mutations in Cu/Zn superoxide dismutase gene are associated with familial amyotrophic lateral sclerosis. Nature. 1993;362:59–62. - PubMed
    1. Sreedharan J, et al. TDP-43 mutations in familial and sporadic amyotrophic lateral sclerosis. Science. 2008;319:1668–1672. - PMC - PubMed

Publication types

MeSH terms