. 2016 Apr;34(4):419-23.
doi: 10.1038/nbt.3460. Epub 2016 Feb 29.

High-throughput identification of genotype-specific cancer vulnerabilities in mixtures of barcoded tumor cell lines

Affiliations

High-throughput identification of genotype-specific cancer vulnerabilities in mixtures of barcoded tumor cell lines

Channing Yu et al. Nat Biotechnol. 2016 Apr.

Abstract

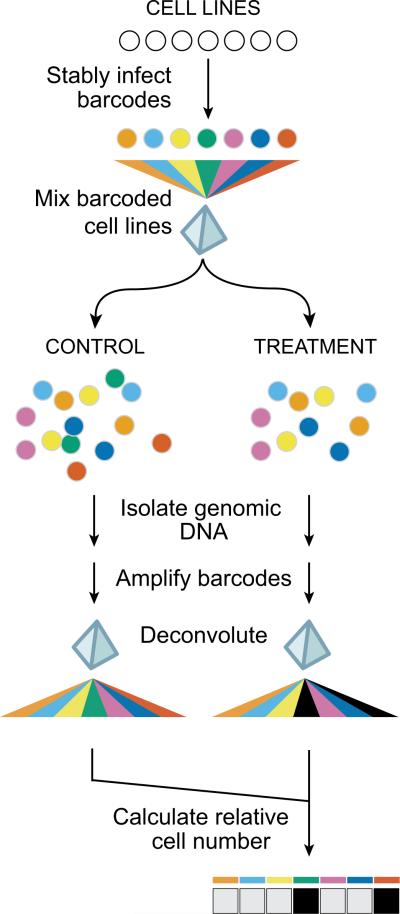
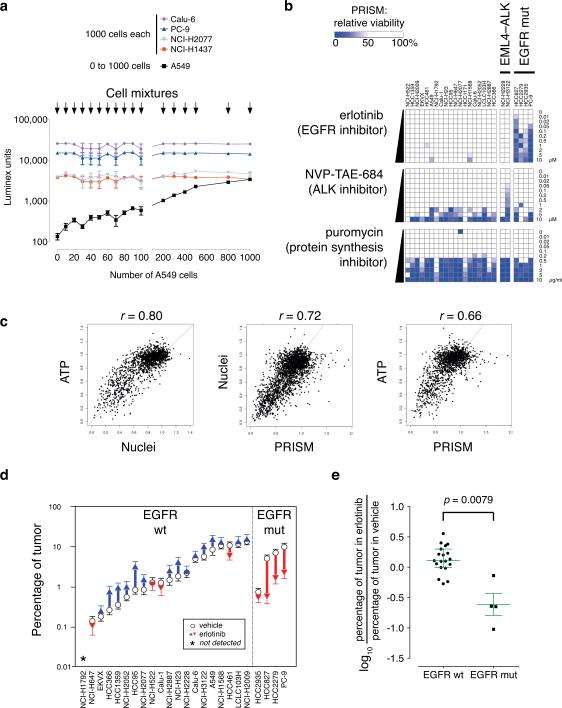
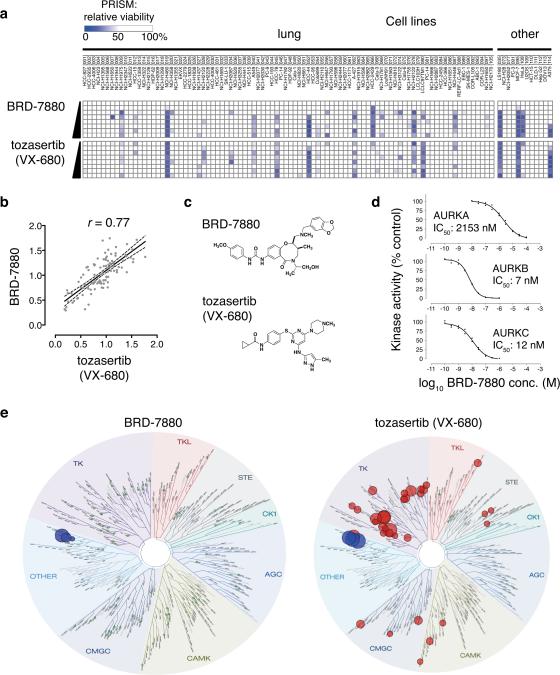
Hundreds of genetically characterized cell lines are available for the discovery of genotype-specific cancer vulnerabilities. However, screening large numbers of compounds against large numbers of cell lines is currently impractical, and such experiments are often difficult to control. Here we report a method called PRISM that allows pooled screening of mixtures of cancer cell lines by labeling each cell line with 24-nucleotide barcodes. PRISM revealed the expected patterns of cell killing seen in conventional (unpooled) assays. In a screen of 102 cell lines across 8,400 compounds, PRISM led to the identification of BRD-7880 as a potent and highly specific inhibitor of aurora kinases B and C. Cell line pools also efficiently formed tumors as xenografts, and PRISM recapitulated the expected pattern of erlotinib sensitivity in vivo.


Figures

Figure 1
Figure 1. PRISM method
24-basepair DNA barcodes encoded within lentiviruses are stably integrated into individual tumor cell lines after blasticidin selection, and barcoded cell lines are individually frozen and later thawed to generate mixtures of equal numbers of barcoded cell lines, which are frozen again. Thawed mixtures are plated and then rearrayed into tissue culture assay plates. Mixtures are treated with test compounds or vehicle (DMSO) controls. At assay conclusion, genomic DNA is harvested from the mixture of remaining viable cells. Barcode sequences are amplified using polymerase chain reaction and universal primers (one of which is biotinylated), and amplified sequences are hybridized to individual microbeads harboring antisense barcode sequences and then to streptavidin-phycoerythrin. A Luminex FlexMap detector quantitates fluorescent signal for each bead. To adjust for differing barcoding efficiencies and differing cell doubling, the signal for each barcoded cell line is scaled to that of vehicle-treated control, thus demonstrating relative inhibition profiles for specific test compounds across multiple cell lines in mixture.
Figure 2
Figure 2. PRISM in vitro and in vivo
a. Barcode signal is proportional to cell number. Five human lung adenocarcinoma cell lines (NCI-H1437, PC-9, NCI-H2077, Calu-6, and A549) were labeled with lentivirus encoding one of five specific 24-basepair DNA barcode sequences and driving expression of the bsd blasticidin resistance gene; each cell line was selected for blasticidin resistance. Designated numbers of cells were plated together in mixture in a well of a 96-well tissue culture plate: 1000 cells each of four cell lines (NCI-H1437, PC-9, NCI-H2077, and Calu-6) and 0–1000 cells of one cell line (A549). The following day, genomic DNA was prepared from cell mixtures, and polymerase chain reaction-amplified barcodes were hybridized to microbeads corresponding to each barcode; quantitative fluorescent signals were read on a Luminex FlexMap detector. The fluorescent Luminex signal for barcoded A549 cells (mean ± S.E.M., n = 4) is directly proportional to the number of cells. b. Relative inhibition profiles of erlotinib, NVP-TAE-684, and puromycin in a mixture of 25 barcoded lung adenocarcinoma cell lines (non-small cell lung carcinoma, NSCLC) in mixture. Twenty-five barcoded lung adenocarcinoma cell lines were tested in mixture against varying concentrations of the epidermal growth factor receptor (EGFR) inhibitor erlotinib or the anaplastic lymphoma kinase (ALK) inhibitor NVP-TAE-684 (at 0–10 μM) or the ribosomal inhibitor puromycin (at 0–10 μg/ml) and viability relative to DMSO-treated control is plotted as a color gradient. Cell lines are listed with bracketed barcode numbers. EML4-ALK, cell lines containing EML4-ALK translocations; EGFR mut, cell lines containing EGFR mutations. See text for details. c. Area under the curve comparisons of cell viability measures with PRISM. Three methods were used to determine cell viability after subjecting 100 human cancer cell lines (representing 18 tissues of origin)—either individually (ATP using CellTiter-Glo, or Nuclei using Opera) or in 4 mixtures of 25 cell lines (PRISM)—to 23 antitumor compounds at 8 concentrations. The AUC (Area Under the Curve) for the viability vs. log(concentration), scaled to 1 (=100% viability over all concentrations), was determined for each cell line–compound combination for each method by taking the mean viability across all tested concentrations, and pairwise correlations between the methods are shown. Pearson correlation of ATP vs. Nuclei (left panel) r = 0.80, p < 0.0001; ATP vs. PRISM (center) r = 0.66, p < 0.0001; Nuclei vs. PRISM (right) r = 0.72, p < 0.0001. d. Relative tumor cell line growth in mixture in animals. PRISM was used to quantitate barcode signals from tumors in 10 erlotinib- and 10 vehicle-treated animals. Tumor barcode signals were scaled first to corresponding barcode signals of the injected cell mixture to determine the number of cell equivalents; the scaled signal for each barcode line was then used to determine the percentage contribution of each tumor cell line to the mixture. The same 23 of 24 lines were detected in all 10 vehicle-treated animals. Circles denote mean percentage tumor volume; error bars denote standard error of the mean across 10 animals in each group. e. EGFR mutation status and response to erlotinib in animals. Within tumors, EGFR mutation in cell lines was associated with a significant decrease in relative cell number (log ratio of percentage of tumor of each cell line in erlotinib-treated over vehicle-treated) compared to wt EGFR in cell lines (two-sided two-sample Kolmogorov-Smirnov test, D = 0.84, p = 0.0079). Median ± interquartile ranges are shown for each group.
Figure 3
Figure 3. BRD-7880 inhibits aurora kinase B
a. Comparison of PRISM profiles across 102 cell lines for BRD-7880 (0.25, 0.5, 1, 2, 4, 8, 16, 32 μM) or tozasertib (0.07, 0.13, 0.26, 0.52, 1, 2, 4, 8 μM). b. Correlation of PRISM AUC between BRD-7880 (a.k.a. BRD-K01737880) and tozasertib. Area under the curve (AUC) of viability vs. concentration curve was calculated for each cell line across 8 doses of compound. Least-squares (ordinary fit) regression line is shown with 95% confidence bands. Spearman r = 0.77. c. Structures of BRD-7880 and tozasertib. d. In vitro aurora kinase assays. Incorporation of radioactivity from 10 μM γ-33P-ATP was measured in in vitro kinase assays across 8 doses in duplicate by the EMD Millipore KinaseProfiler service under published standard conditions with 10 mM ATP. Full-length human AURKA was assayed with 200 μM LRRASLG (Kemptide); full-length human AURKB with 30 μM AKRRRLSSLRA (ribosomal protein S6 peptide); and full-length human AURKC with 30 μM AKRRRLSSLRA. IC50 values were modeled using least-squares and variable slope with GraphPad Prism 6.0 software. e. KinomeScan profile for BRD-7880 across 98 kinases. Left, schematic representation of relative affinity of BRD-7880 for specific kinases in the KinomeScan assay (data available in Supplementary Table 9). Green circles represent tested kinases for which BRD-7880 decreases binding < 75% control. Right, published relative affinities of tozasertib (VX-680) for same 98 kinases (where available , ).

References

    1. McDermott U, et al. Identification of genotype-correlated sensitivity to selective kinase inhibitors by using high-throughput tumor cell line profiling. Proc Natl Acad Sci U S A. 2007;104:19936–19941. - PMC - PubMed
    1. Sos ML, et al. Predicting drug susceptibility of non-small cell lung cancers based on genetic lesions. J Clin Invest. 2009;119:1727–1740. - PMC - PubMed
    1. Barretina J, et al. The Cancer Cell Line Encyclopedia enables predictive modelling of anticancer drug sensitivity. Nature. 2012;483:603–607. - PMC - PubMed
    1. Garnett MJ, et al. Systematic identification of genomic markers of drug sensitivity in cancer cells. Nature. 2012;483:570–575. - PMC - PubMed
    1. Sharma SV, Haber DA, Settleman J. Cell line-based platforms to evaluate the therapeutic efficacy of candidate anticancer agents. Nature reviews. Cancer. 2010;10:241–253. - PubMed

Publication types