. 2016 May;20(5):825-35.
doi: 10.1111/jcmm.12808. Epub 2016 Mar 1.

Interaction of extracellular S100A4 with RAGE prompts prometastatic activation of A375 melanoma cells

Affiliations

Interaction of extracellular S100A4 with RAGE prompts prometastatic activation of A375 melanoma cells

Nadine Herwig et al. J Cell Mol Med. 2016 May.

Abstract

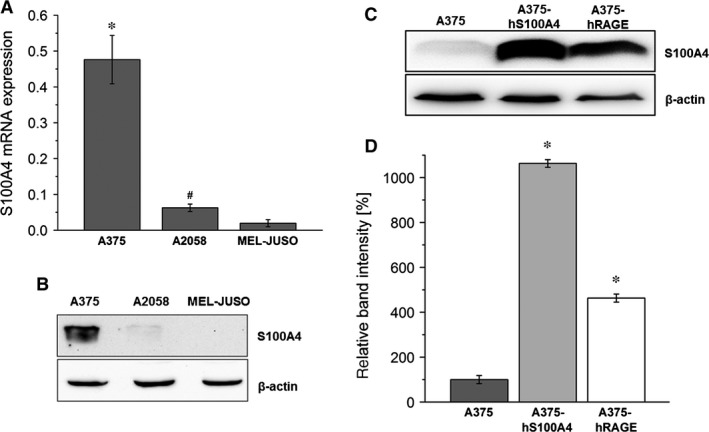
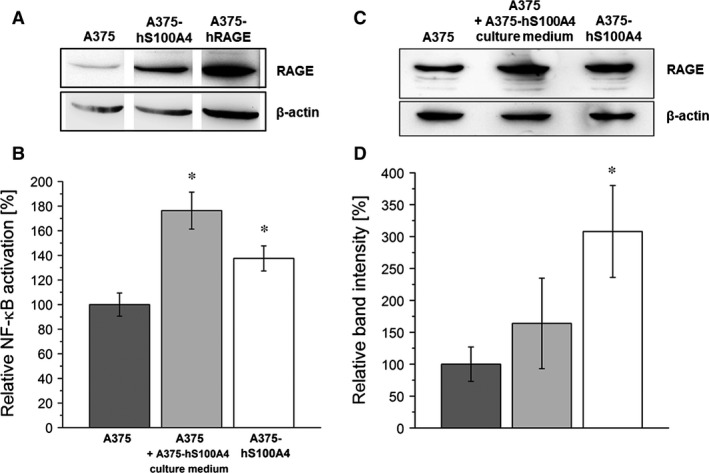
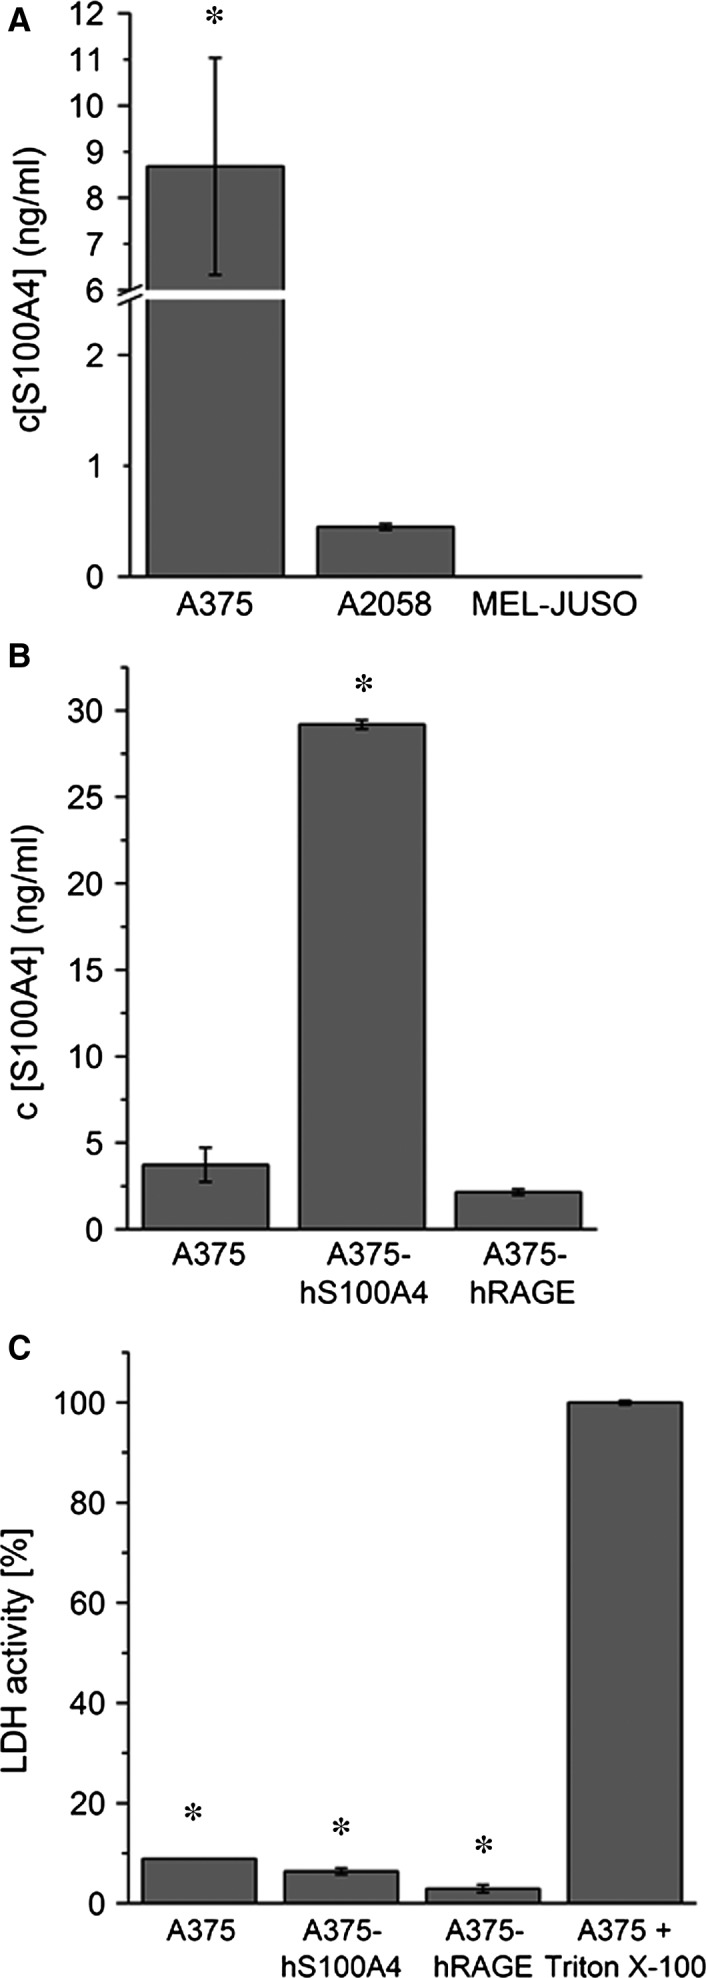
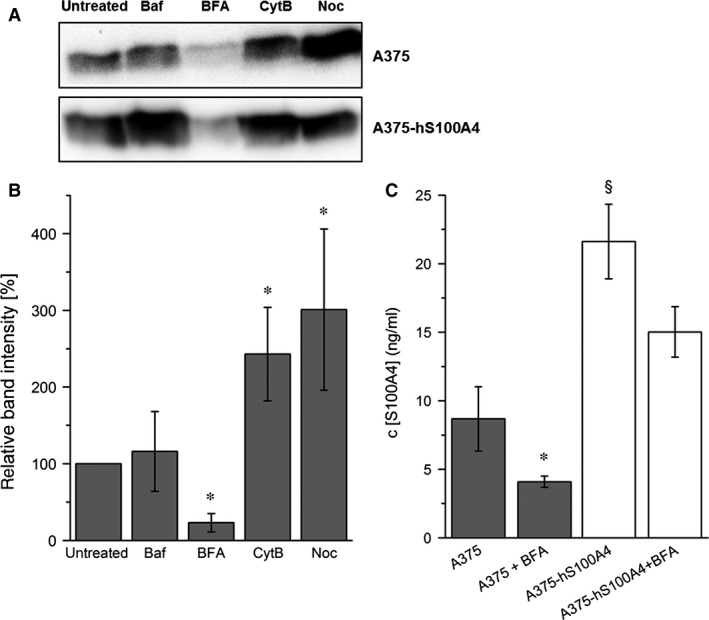
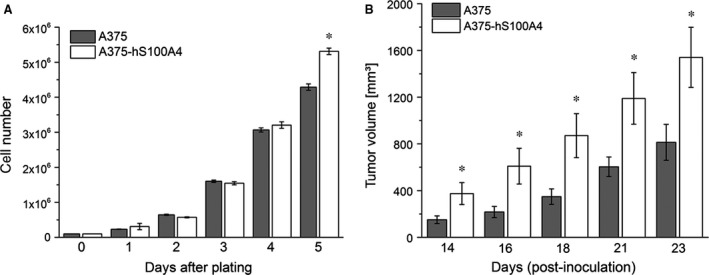
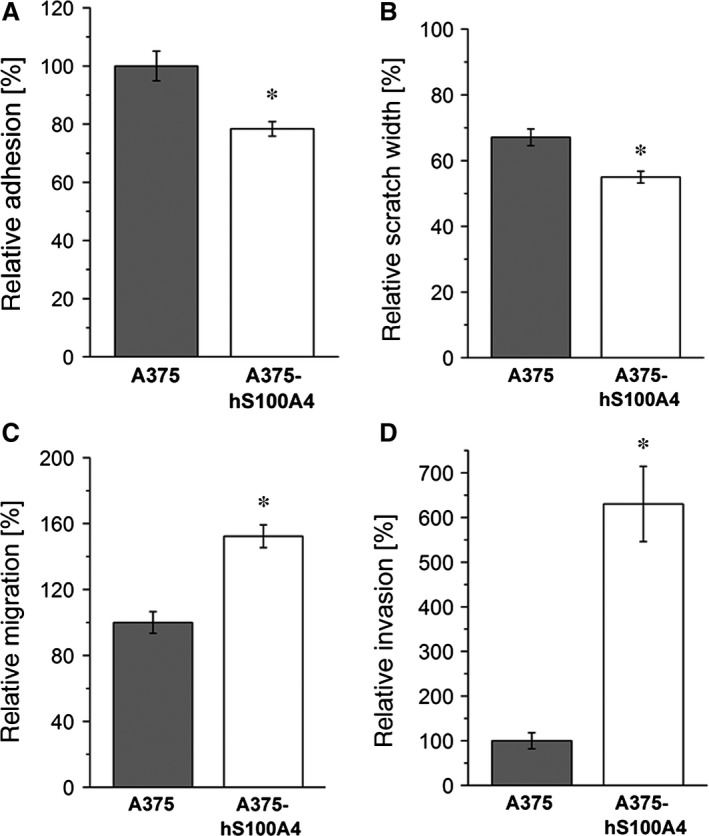
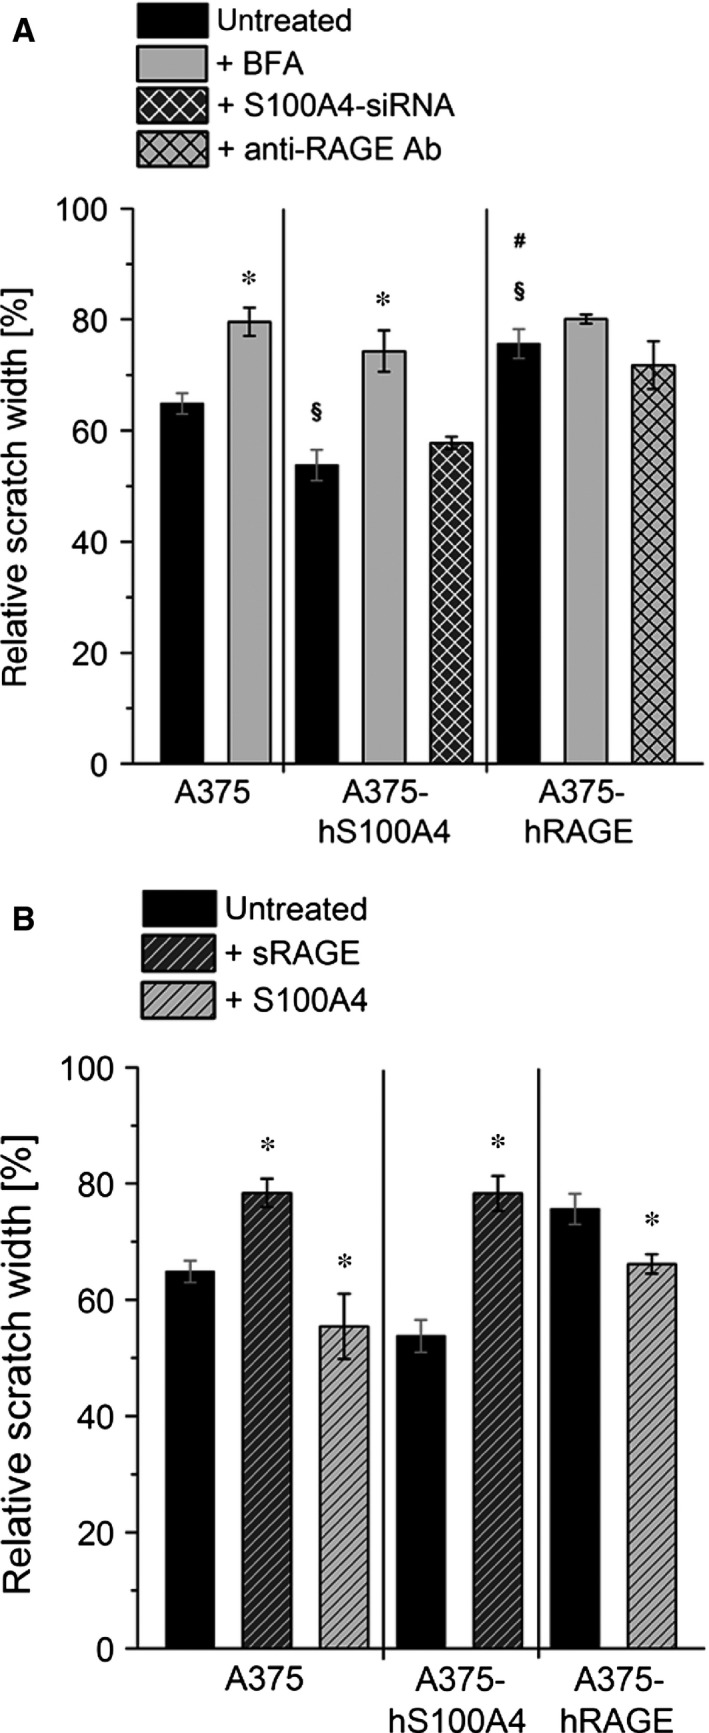
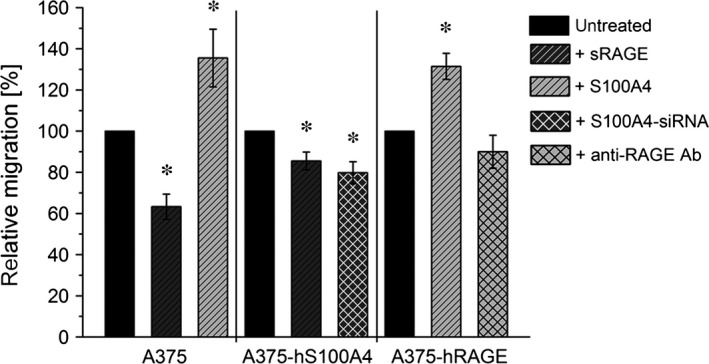
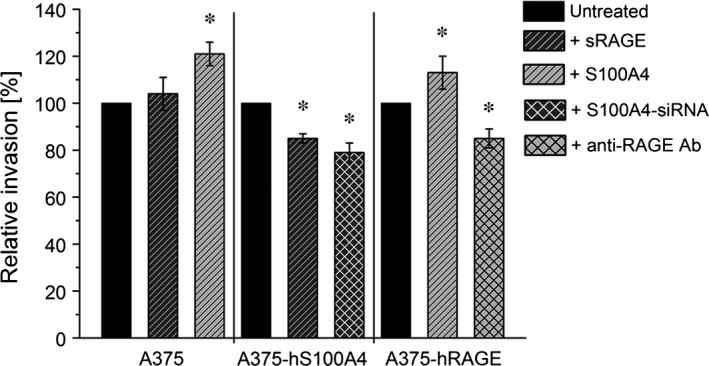
S100A4, a member of the S100 protein family of EF-hand calcium-binding proteins, is overexpressed in various tumour entities, including melanoma, and plays an important role in tumour progression. Several studies in epithelial and mesenchymal tumours revealed a correlation between extracellular S100A4 and metastasis. However, exact mechanisms how S100A4 stimulates metastasis in melanoma are still unknown. From a pilot experiment on baseline synthesis and secretion of S100A4 in human melanoma cell lines, which are in broad laboratory use, A375 wild-type cells and, additionally, newly generated A375 cell lines stably transfected with human S100A4 (A375-hS100A4) or human receptor for advanced glycation endproducts (A375-hRAGE), were selected to investigate the influence of extracellular S100A4 on cell motility, adhesion, migration and invasion in more detail. We demonstrated that A375 cells actively secrete S100A4 in the extracellular space via an endoplasmic reticulum-Golgi-dependent pathway. S100A4 overexpression and secretion resulted in prometastatic activation of A375 cells. Moreover, we determined the influence of S100A4-RAGE interaction and its blockade on A375, A375-hS100A4, A375-hRAGE cells, and showed that interaction of RAGE with extracellular S100A4 contributes to the observed activation of A375 cells. This investigation reveals additional molecular targets for therapeutic approaches aiming at blockade of ligand binding to RAGE or RAGE signalling to inhibit melanoma metastasis.

Keywords: ER-Golgi-dependent secretion pathway; S100 protein secretion; calcium-binding proteins; cancer metastasis; soluble receptor for advanced glycation endproducts.


Figures

Figure 1
Figure 1
Expression and synthesis of S100A4. (A) Relative mRNA expression of S100A4 in A375, A2058 and MELJUSO cell lysates was analysed by quantitative real‐time RTPCR. Displayed are the 2−ΔCt values, representing the S100A4 gene expression normalized to the β‐actin endogenous reference gene (mean ± S.E.M., n ≥ 6, *P < 0.05, versus A2058 and MELJUSO, # P < 0.05, versus MELJUSO). Representative Western blots show S100A4 protein synthesis in wild type A375, A2058 and MELJUSO cell lysates (B) and in wild type A375, A375‐hS100A4, and A375‐hRAGE cell lysates (C). Exposition time of S100A4 blot was 1 min. (C) up to 10 min. (B). β‐actin was used as loading control. (D) Densitometric analysis of S100A4 expression in wild type and transgenic A375 cells related to β‐actin expression (mean ± S.E.M., n = 5, *P < 0.05, versus A375).
Figure 2
Figure 2
Synthesis of RAGE and S100A4‐mediated NF‐κB p65 activation in melanoma cells. (A) Representative Western blot shows RAGE protein synthesis in A375, A375‐hS100A4, and A375‐hRAGE cell lysates. β‐actin was used as loading control. (B) NF‐κB p65 activation in nuclear extracts of wild type A375, wild type A375 cells re‐treated with culture medium of A375‐hS100A4 cells, and A375‐hS100A4 cells (mean ± S.E.M., n = 4). (C) Representative Western blot shows S100A4‐mediated up‐regulation of RAGE protein synthesis in wild type A375 cells re‐treated with culture medium of A375‐hS100A4 cells and A375‐hS100A4 cells compared to wild type A375 cells. β‐actin was used as loading control. (D) Densitometric analysis of RAGE expression in wild type A375, wild type A375 cells re‐treated with culture medium of A375‐hS100A4 cells, and A375‐hS100A4 cells related to β‐actin expression (mean ± S.E.M., n = 3, *P < 0.05, versus A375).
Figure 3
Figure 3
Active secretion of S100A4. (A) Extracellular S100A4 was detected after 4 hrs of incubation in cell culture supernatants of A375, A2058, and MELJUSO cells via ELISA (mean ± S.E.M., n = 3, *P < 0.05, versus A2058 cells). (B) Detection of extracellular S100A4 in cell culture supernatants of A375, A375‐hS100A4, and A375‐hRAGE cells showing highest amounts of S100A4 in supernatant of A375‐hS100A4 cells after 8 hrs of incubation (mean ± S.E.M., n = 3, *P < 0.05, versus A375 cells). (C) Detection of LDH activity in cell culture supernatants of A375, A375‐hS100A4, and A375‐hRAGE cells. Incubation with medium was set as 0% LDH activity and incubation with Triton X‐100 was set as 100% (mean ± S.E.M., n = 3, *P < 0.01, versus Triton X‐100).
Figure 4
Figure 4
Identification of secretion pathway of S100A4. (A) Representative Western blots show detection of extracellular S100A4 in concentrated samples of cell culture supernatants of A375 and A375‐hS100A4 cells analysed untreated or after incubation with bafilomycin A1 (Baf), brefeldin A (BFA), cytochalasin B (CytB), or nocodazole (Noc) after 4 hrs of incubation. (B) Densitometric analysis of Western blots showing detection of extracellular S100A4 in A375 cells after 4 hrs incubation with different inhibitors related to β‐actin expression (mean ± S.E.M., n = 5, *P < 0.05, versus untreated). (C) Untreated and BFA‐treated A375 and A375‐hS100A4 cells were incubated for 4 hrs and concentration of extracellular S100A4 in cell culture supernatants were measured via ELISA (mean ± S.E.M., n = 3, *P < 0.05, versus untreated; § P < 0.05, versus A375 cells).
Figure 5
Figure 5
Influence of S100A4 overexpression on cellular growth in vitro and in vivo. (A) Cell growth was evaluated for wild type A375 and A375‐hS100A4 cells (mean ± S.E.M., n ≥ 9, *P < 0.05, versus wild type A375). (B) To assess tumour growth A375 and A375‐hS100A4 cells were injected subcutaneously into the right upper flank of female NMRI (nu/nu) mice. The average volume of the tumours was measured for a period of three weeks (mean ± S.E.M., n ≥ 9, *P < 0.05, versus wild type A375).
Figure 6
Figure 6
Effect of S100A4 overexpression on cell adhesion, motility, migration, and invasion in A375 cells. Relative adhesion (A), relative scratch widths (B), relative migration (C), or relative invasive capability (D) of A375 and A375‐hS100A4 cells was measured after 24 hrs. Adhesion, migration, and invasion rate of untreated control cells were set as 100%. Initial scratch width was set as 100% (mean ± S.E.M., n = 3, *P < 0.05, versus A375 cells).
Figure 7
Figure 7
Regulation of cell motility by S100A4‐RAGE interaction. Relative scratch widths of wild type A375, A375‐hS100A4, and A375‐hRAGE cells either (A) untreated, treated with BFA, S100A4‐siRNA, and blocking Anti‐RAGE antibody, or (B) treated with fivefold molar excess (150 ng/ml) of sRAGE, fivefold (150 ng/ml; in A375 cells) or 100‐fold molar excess (3000 ng/ml) of S100A4 (in A375‐hRAGE cells) are shown. Initial scratch width was set as 100% (mean ± S.E.M., n ≥ 3, *P < 0.05, versus untreated; § P < 0.05, versus untreated A375 cells; # P < 0.05 versus untreated A375‐hS100A4 cells).
Figure 8
Figure 8
Regulation of cell migration by S100A4‐RAGE interaction. Relative migration of wild type A375, A375‐hS100A4, and A375‐hRAGE cells (untreated, fivefold molar excess (150 ng/ml) of sRAGE, fivefold (150 ng/ml; in A375 cells) or 100‐fold molar excess (3000 ng/ml) of S100A4 (in A375‐hRAGE cells), S100A4‐siRNA, and blocking Anti‐RAGE antibody) are shown. Migration rate of untreated control cells were set as 100% (mean ± S.E.M., n ≥ 3, *P < 0.05, versus untreated).
Figure 9
Figure 9
Regulation of cell invasion by S100A4‐RAGE interaction. Relative invasion of wild type A375, A375‐hS100A4, and A375‐hRAGE cells (untreated, fivefold molar excess (150 ng/ml) of sRAGE, fivefold (150 ng/ml; in A375 cells) or 100‐fold molar excess (3000 ng/ml) of S100A4 (in A375‐hRAGE cells), S100A4‐siRNA, and blocking Anti‐RAGE antibody) are shown. Invasion rate of untreated control cells were set as 100% (mean ± S.E.M., n ≥ 3, *P < 0.05, versus untreated).

References

    1. Ko JM, Fisher DE. A new era: melanoma genetics and therapeutics. J Pathol. 2011; 223: 242–51. - PubMed
    1. Tandler N, Mosch B, Pietzsch J. Protein and non‐protein biomarkers in melanoma: a critical update. Amino Acids. 2012; 43: 2203–30. - PubMed
    1. Garrett SC, Varney KM, Weber DJ, et al S100A4, a mediator of metastasis. J Biol Chem. 2006; 281: 677–80. - PubMed
    1. Wolf S, Haase‐Kohn C, Lenk J, et al Expression, purification and fluorine‐18 radiolabeling of recombinant S100A4: a potential probe for molecular imaging of receptor for advanced glycation endproducts in vivo? Amino Acids. 2011; 41: 809–20. - PubMed
    1. Maelandsmo GM, Flørenes VA, Mellingsaeter T, et al Differential expression patterns of S100A2, S100A4 and S100A6 during progression of human malignant melanoma. Int J Cancer. 1997; 74: 464–9. - PubMed

Publication types

MeSH terms

Substances