Review
. 2017 Apr;23(2):169-184.
doi: 10.1177/1073858416635986. Epub 2016 Jul 7.

Functional Connectivity of the Infant Human Brain: Plastic and Modifiable

Affiliations
Review

Functional Connectivity of the Infant Human Brain: Plastic and Modifiable

Wei Gao et al. Neuroscientist. 2017 Apr.

Abstract

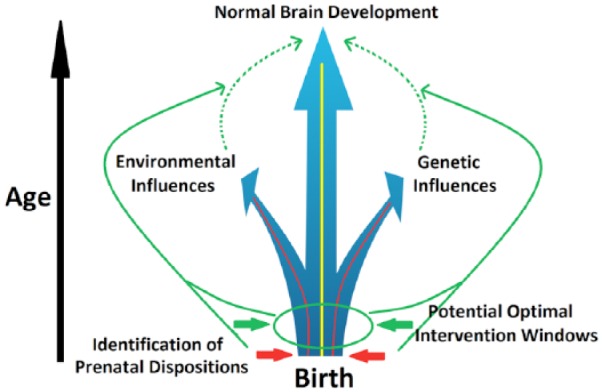
Infancy is a critical and immensely important period in human brain development. Subtle changes during this stage may be greatly amplified with the unfolding of different developmental processes, exerting far-reaching consequences. Studies of the structure and behavioral manifestations of the infant brain are fruitful. However, the specific functional brain mechanisms that enable the execution of different behaviors remained elusive until the advent of functional connectivity fMRI (fcMRI), which provides an unprecedented opportunity to probe the infant functional brain development in vivo. Since its inception, a burgeoning field of infant brain functional connectivity study has emerged and thrived during the past decade. In this review, we describe (1) findings of normal development of functional connectivity networks and their relationships to behaviors and (2) disruptions of the normative functional connectivity development due to identifiable genetic and/or environmental risk factors during the first 2 years of human life. Technical considerations of infant fcMRI are also provided. It is our hope to consolidate previous findings so that the field can move forward with a clearer picture toward the ultimate goal of fcMRI-based objective methods for early diagnosis/identification of risks and evaluation of early interventions to optimize developing functional connectivity networks in this critical developmental window.

Keywords: early brain development; functional connectivity; functional networks; genetic risks; premature birth; prenatal drug exposure; resting state.


Conflict of interest statement

Declaration of Conflicting Interests: The author(s) declared no potential conflicts of interest with respect to the research, authorship, and/or publication of this article.

Figures

Figure 1.
Figure 1.
The goal of rectifying abnormal brain growth trajectories induced by genetic and/or environmental risk factors through early identification of potential prenatal dispositions and subsequent preventive intervention.
Figure 2.
Figure 2.
Development of the brain’s nine functional connectivity networks during the first year of life. Thresholded maps evaluated at each of the five time points are shown from the first to the fifth rows and the corresponding adult maps are shown at the bottom row (green dots show the locations of seeds). Color bar indicates correlation strength. V1 = medial occipital network; V2 = occipital pole network; V3 = lateral visual/parietal network; DM = default-mode network; SM = sensorimotor network; AN = auditory/language network; SA = salience network; FPNL/R = left/right frontoparietal networks. Adapted from Gao and others (2015a).
Figure 3.
Figure 3.
Development of thalamocortical functional connectivity during the first 2 years of life. (A) The 3D-rendering of each thalamic cluster is visualized alongside its cortical projection map for all three age groups. Color bar denotes connectivity strength. SM = sensorimotor; SA = salience; DM = default-mode; MV = medial visual. (B) Relationship between thalamus-salience network connectivity in 1-year-olds and working memory score in 2-year-olds. (C) Relationship between thalamus-salience network connectivity in 1-year-olds and Mullen ELCSS in 2-year-olds. Adapted from Alcauter and others (2014).
Figure 4.
Figure 4.
Functional segregation of the insula and associated functional networks during the first 2 years of life. Sagittal images visualize the functional parcellation of the insula into anterior (red) and posterior (green) parts based on similarity of functional connectivity patterns. The surface plots above sagittal images show the corresponding network structures of the anterior and posterior insula clusters. Adapted from Alcauter and others (2015a).
Figure 5.
Figure 5.
Development of the within-default-mode (A), within-dorsal attention (B), and their internetwork connectivity (C) during the first 2 years of life. *Denotes significant differences after FDR correction. Adapted from Gao and others (2013b).
Figure 6.
Figure 6.
Development of the brain’s whole brain functional system based on graph theoretical measures. (A) The group mean correlation matrices at a cost of 10% are visualized using spring embedding plots for all three groups. Nodes are color coded with respect to the lobe they belong to. Each edge represents the mean connectivity strength between a pair of nodes. The rCL and rCP represent the ratio of the clustering coefficient and characteristic path length between the infants’ functional graph and those of a random graph. SW represents the small-worldness measure. (B) Statistical comparison of local (LE) and global efficiency (GE) at connectivity density of 10% based on individual subject’s correlation matrices. Red asterisks represents significant difference at P < 0.05 (FDR correction). (C) LE, GE, and mean connection distance (CD) curve across the cost range of 1% to 50%. Significant increase of LE occurs from neonates to 1-year-olds for a range of cost spanning from 2% through 21% and GE from 4% to 44% (P < 0.05, FDR corrected). The calculation was based on individual subjects and the mean values for each age group are plotted. Adapted from Gao and others (2011).
Figure 7.
Figure 7.
Disruption of amygdala functional connectivity by prenatal cocaine exposure. (A) Visualization of the subcluster (highlighted in red) that shows cocaine specific disruptions in functional connectivity within a big cluster showing overall drug-common effects (blue). (B) Post hoc comparison of functional connectivity by group within the detected subcluster. (*) indicate significant (P ≤ 0.05 Dunn-Sidak corrected) pairwise differences between groups. Data plotted as mean ± SEM. Adapted from Salzwedel and others (2015).
Figure 8.
Figure 8.
Frequency shift of spontaneous BOLD signals during infancy and its behavioral associations. (A) Average power spectral density (PSD) of spontaneous BOLD signal across of whole brain gray matter the three age groups. Error bars denote standard error of the mean for each frequency point. (B) Spectral power at 0.0056 Hz (i.e., the neonatal peak frequency) for each age group visualized on brain surfaces. (C) Spectral power at 0.0278 Hz (i.e., the 2-year-olds’ peak frequency) for each age group visualized on brain surfaces. (D) Significant positive correlation between the spectral power for the sensorimotor (SM) network and the Mullen Fine Motor Scale score in 1-year-olds. (E) Significant positive correlation between the spectral power for the lateral visual (LV) network and the Mullen Visual Perception Scale score in 1-year-olds. Adapted from Alcauter and others (2015b).

References

    1. Ackerman JP, Llorente AM, Black MM, Ackerman CS, Mayes LA, Nair P. 2008. The effect of prenatal drug exposure and caregiving context on children’s performance on a task of sustained visual attention. J Dev Behav Pediatr 29:467–74. - PMC - PubMed
    1. Afif A, Bouvier R, Buenerd A, Trouillas J, Mertens P. 2007. Development of the human fetal insular cortex: study of the gyration from 13 to 28 gestational weeks. Brain Struct Funct 212:335–46. - PubMed
    1. Alcauter S, Lin W, Smith JK, Gilmore JH, Gao W. 2015a. Consistent anterior-posterior segregation of the insula during the first 2 years of life. Cereb Cortex 25:1176–87. - PMC - PubMed
    1. Alcauter S, Lin W, Smith JK, Goldman BD, Reznick JS, Gilmore JH, and others. 2015b. Frequency of spontaneous BOLD signal shifts during infancy and correlates with cognitive performance. Dev Cogn Neurosci 12:40–50. - PMC - PubMed
    1. Alcauter S, Lin W, Smith JK, Short SJ, Goldman BD, Reznick JS, and others. 2014b. Development of thalamocortical connectivity during infancy and its cognitive correlations. J Neurosci 34:9067–75. - PMC - PubMed

Publication types