. 2016 Mar 15;113(11):3036-41.
doi: 10.1073/pnas.1516036113. Epub 2016 Feb 29.

Critical role for Epac1 in inflammatory pain controlled by GRK2-mediated phosphorylation of Epac1

Affiliations

Critical role for Epac1 in inflammatory pain controlled by GRK2-mediated phosphorylation of Epac1

Pooja Singhmar et al. Proc Natl Acad Sci U S A. .

Abstract

cAMP signaling plays a key role in regulating pain sensitivity. Here, we uncover a previously unidentified molecular mechanism in which direct phosphorylation of the exchange protein directly activated by cAMP 1 (EPAC1) by G protein kinase 2 (GRK2) suppresses Epac1-to-Rap1 signaling, thereby inhibiting persistent inflammatory pain. Epac1(-/-) mice are protected against inflammatory hyperalgesia in the complete Freund's adjuvant (CFA) model. Moreover, the Epac-specific inhibitor ESI-09 inhibits established CFA-induced mechanical hyperalgesia without affecting normal mechanical sensitivity. At the mechanistic level, CFA increased activity of the Epac target Rap1 in dorsal root ganglia of WT, but not of Epac1(-/-), mice. Using sensory neuron-specific overexpression of GRK2 or its kinase-dead mutant in vivo, we demonstrate that GRK2 inhibits CFA-induced hyperalgesia in a kinase activity-dependent manner. In vitro, GRK2 inhibits Epac1-to-Rap1 signaling by phosphorylation of Epac1 at Ser-108 in the Disheveled/Egl-10/pleckstrin domain. This phosphorylation event inhibits agonist-induced translocation of Epac1 to the plasma membrane, thereby reducing Rap1 activation. Finally, we show that GRK2 inhibits Epac1-mediated sensitization of the mechanosensor Piezo2 and that Piezo2 contributes to inflammatory mechanical hyperalgesia. Collectively, these findings identify a key role of Epac1 in chronic inflammatory pain and a molecular mechanism for controlling Epac1 activity and chronic pain through phosphorylation of Epac1 at Ser-108. Importantly, using the Epac inhibitor ESI-09, we validate Epac1 as a potential therapeutic target for chronic pain.

Keywords: Epac1; Epac1 translocation; GRK2; Piezo2; chronic pain.


Conflict of interest statement

The authors declare no conflict of interest.

Figures
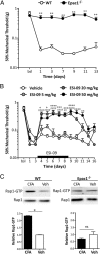
Fig. 1.
Fig. 1.
Role of Epac1 in mechanical hyperalgesia. (A) CFA-induced mechanical hyperalgesia in WT (n = 6) and Epac1−/− (n = 10) mice. Changes in 50% paw withdrawal threshold were monitored over time. Repeated-measures two-way ANOVA genotype effect: P < 0.0001. **P < 0.01 (post hoc Bonferroni analysis). (B) Dose–response curve for the effect of ESI-09 (5, 20, or 50 mg/kg) on CFA-induced mechanical hyperalgesia in WT mice (n = 8). Treatment was started on the third day after CFA administration. *P < 0.05; **P < 0.01 (50 mg/kg ESI-09 compared with the vehicle-treated mice); ***P < 0.001; ****P < 0.0001; ##P < 0.01 (20 mg/kg ESI-09 compared with the vehicle-treated mice); ####P < 0.0001. (C) Rap1 activation in lumbar DRG of WT and Epac1−/− mice 5 d after CFA administration. Results are means ± SEM of at least three independent experiments. *P < 0.05 (t test); ns, not significant.
Fig. S1.
Fig. S1.
Heat hyperalgesia in Epac1 knockout mice. CFA‐induced heat hyperalgesia in WT (n = 8) and Epac1−/− (n = 8) mice. Data represent paw heat‐withdrawal latency in seconds and are means ± SEM.
Fig. S2.
Fig. S2.
Effect of ESI-09 on mechanical allodynia and heat hyperalgesia in WT mice. (A) Mechanical allodynia was measured in WT mice with 6 d treatment of ESI‐09 20 mg/kg (n = 6) to control for a potential effect on baseline mechanical sensitivity. (B) Early time points of ESI‐09 (20 mg/kg) administration started on the third day after CFA injection, when mechanical allodynia is fully developed (n = 8). *P < 0.05; **P < 0.01. (C) Effect of ESI‐09 on CFA‐induced heat hyperalgesia. Mice were treated with vehicle or ESI‐09 at 20 mg/kg for 6 d starting after CFA injection (n = 8). (D) Heat sensitivity of saline-treated mice with 20 mg/kg ESI‐09 (n = 8). Latency is paw heat‐withdrawal latency in seconds. Data represent mean ± SEM.
Fig. S3.
Fig. S3.
Hematoxylin/eosin-stained sections of foot pad of paws from mice treated with CFA and/or ESI‐09 at 4x magnification.
Fig. 2.
Fig. 2.
GRK2-mediated regulation of Epac1-to-Rap1 signaling and chronic pain. (A) Effect of overexpression of kinase dead GRK2 (K220R) on mechanical hyperalgesia (n = 8 per group). Mice were treated intraplantarly with HSV–GRK2 or –GFP (empty vector) or HSV–K220R on days 4, 6, 13, and 16 after intraplantar CFA injection. Changes in 50% paw withdrawal threshold were monitored over time. Data represent mean ± SEM. *P < 0.05; **P < 0.01; ***P < 0.001; ****P < 0.0001. Data were analyzed by using two-way ANOVA followed by Tukey’s post hoc analyses. (B) Rap1 activation in HEK293 (HEK) or HEK293 cells overexpressing GRK2 (HEK–GRK2) cells. Cells transfected with HA–Epac1 were treated with 8-pCPT or vehicle for 20 min followed by a Rap1–GTP pull-down assay. Bar graph depicts means ± SEM of at least three independent experiments. **P < 0.01; ***P < 0.001; ****P < 0.0001 (analyzed using t test). (C) Pull-down of Rap1-GTP from N2A cells or N2A overexpressing GRK2 (N2A–GRK2). The two right lanes represent two different GRK2-overexpressing clones. (D) Rap1 activation in N2A–GRK2 or –K220R cells transfected with HA–Epac1. Cells were stimulated as in B. Data are representative of at least three independent experiments. Bar graphs represent band density for Rap1–GTP levels normalized to total Rap1, with Rap1–GTP levels in 8-pCPT–treated control N2A cells set as 1. ***P < 0.001; ****P < 0.0001.
Fig. S4.
Fig. S4.
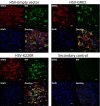
HSV‐mediated overexpression of GRK2 and K220R in IB4+ lumbar DRG neurons. (Scale bars, 20 μm.)
Fig. S5.
Fig. S5.
GRK2 and Epac1 interaction. (A) Pull‐down of GRK2 with Epac1 in N2A cells. YFP‐Epac1 or GFP were co‐expressed with GRK2‐V5 in N2A cells. Lysates were subjected to GFP‐TRAP pull‐down followed by Western blotting with anti‐V5‐HRP (V5) and anti‐Epac1 antibody. Levels of GRK2‐V5 and Epac1 in the pull-down and input (5% of sample used for pull‐down) are shown. (B) Pull‐down of GRK2 deletion mutants by YFP‐Epac1. (Upper) Schematic of deletion constructs of GRK2 used in the pull‐down with YFP‐Epac1. Numbers indicate amino acid residues. (C) Localization of Epac1 and GRK2 in N2A cells. (Upper) N2A cells were transiently transfected with YFP‐Epac1 (green) and mcherry‐GRK2 (red) by fluorescence microscopy. (Lower) Distribution of YFP‐Epac1 in N2A cells cotransfected with mcherry‐GRK2gg. Arrow shows GRK2gg and Epac1 co‐localization at the plasma PM. The images are representative of >50 cells examined in at least two independent experiments.
Fig. 3.
Fig. 3.
GRK2 phosphorylates Epac1 at Ser-108 residue. (A) In vitro phosphorylation of Epac1 by GRK2. Visualization of 32P incorporation by autoradiography analysis of GST–Epac1 incubated with purified recombinant GRK2 (50 nM) and [γ32P]ATP (32P) in the absence or presence of 0.01 U/µL heparin. (B) Representative autoradiogram of 32P incorporation in 25 to 1,000 nM GST–Epac1 incubated with 25 nM GRK2. (C) Alignment of Epac1 sequence surrounding Ser-108 across multiple species. (D) Autoradiogram of 32P incorporation in WT–Epac1 and Epac1–S108A incubated with purified recombinant GRK2 (50 nM). (E) Rap1 activation in N2A and N2A–GRK2 (NG) cells transfected with WT–Epac1 (WT), Epac1–S108A (S108A), or Epac1–S108E (S108E) treated with 8-pCPT. Shown are data representative of three independent experiments. Bar graph represents band density for Rap1–GTP levels normalized to total Rap1, with Rap1–GTP levels in 8-pCPT–treated cells expressing WT Epac1 set as 1. ***P < 0.001; ****P < 0.0001.
Fig. S6.
Fig. S6.
Lineweaver‐Burk analysis of Epac1 phosphorylation by GRK2. Recombinant GRK2 (25 nM) was used to phosphorylate increasing amounts of purified GST‐Epac1 (25 nM to 1 μM) in the presence of [γ32P]ATP in vitro. The amount of labeled Epac1 was quantified by Cerenkov counting of the radioactive bands and used to calculate Km using a Lineweaver–Burk representation. Data are from a representative experiment out of three.
Fig. S7.
Fig. S7.
Electron transfer dissociation MS/MS spectrum of the phosphorylated Epac1 peptide 108‐(pS)QVVGICQVLLDEGALCHVK‐127 (where p indicates phosphorylation) detected after trypsin digestion of GST‐Epac1 protein incubated with ATP and purified GRK2. Samples were analyzed by using the LC/MS/MS method.
Fig. 4.
Fig. 4.
Effects of phospho-mimicking Epac1 mutant on Epac1-to-Rap signaling. (A) FRET analyses of 8-pCPT–AM-induced conformational changes of Epac1 in cells. HEK293 cells were transfected with either WT ECFP–EPAC1–citrine (WT) or ECFP–Epac1–S108E–citrine (S108E) FRET probes. Cells were analyzed by flow cytometry after treatment with 30 µM 8-pCPT–AM. Representative panels show FRET ratios (405/530) and the percent of YFP-positive cells with FRET signal. Bar graph shows percent FRET signal decrease in response to 8-pCPT–AM treatment compared with vehicle-treated cells for three experiments performed in triplicate. ****P < 0.0001 (two-way ANOVA). (B) In vitro Epac1 GEF activity using a Rap1b–bodipy–GDP (Rap1b-bGDP) fluorescence assay. A concentration of 0.2 µM WT GST–Epac1 (WT), the phospho-deficient mutant GST–Epac1–S108A (S108A), or the phospho-mimic mutant GST–Epac1–S108EE (S108EE) was incubated with 0.5 µM fluorescent Rap1b–bGDP and 50 µM GDP in the presence or absence of 25 µM cAMP added at 0 min. Decrease in fluorescence intensity was recorded as a measure of GEF activity. Bar graph fluorescence signal at 12 min after cAMP addition. (C) Effect of addition of GRK2 (0.2 µM) and ATP (100 µM) on in vitro Epac1 GEF activity as assessed in B. No significant differences were observed between WT GST–Epac1 and the two mutants or after addition of GRK2 (n = 3).
Fig. 5.
Fig. 5.
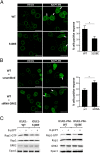
Impaired 8-pCPT–induced PM translocation of Epac1–S108E. (A) N2A were cells transfected with WT YFP–Epac1 (WT) or the phospho-mimic mutant YFP–Epac1–S108E, and stimulated with 8-pCPT–AM for 10 min. (Scale bars, 25 µm.) *P < 0.05. (B) N2A cells transfected with WT YFP–Epac1 and siRNA GRK2 or scrambled siRNA (scr) and stimulated with 8-pCPT–AM as in A. Shown are representative images. Bar graph represents mean percentage of cells with Epac1 accumulation in the PM in response to 8-pCPT as determined in three independent experiments each including >50 cells per condition. (Scale bars, 25 µm.) *P < 0.05. (C) Rap1 activation in N2A cells transfected with WT Epac1 (ICUE1-WT) or Epac1–S108E (ICUE1-S108E) (Left) or with PM-tagged WT Epac1 (ICUE1-PM-WT) or PM-tagged Epac1–S108E (ICUE1-PM-S108E) (Right), and stimulated with 8-pCPT–AM for 10 min.
Fig. S8.
Fig. S8.
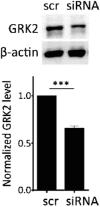
siRNA‐mediated GRK2 knockdown in N2A cells as assessed by Western blot. ***P < 0.001.
Fig. 6.
Fig. 6.
Role of Piezo2 in CFA-induced mechanical hyperalgesia. (A) Effect of asODN against Piezo2 on CFA-induced mechanical hyperalgesia. Treatment, P < 0.0001; interaction, P < 0.0001 (two-way ANOVA). *P < 0.1; **P < 0.01; ***P < 0.001; ****P < 0.0001 (Bonferroni posttest). (B) Effect of an asODN against Piezo2 on CFA-induced thermal hyperalgesia. For A and B, Piezo2 or scrambled asODNs were administered intrathecally on days 1, 2, 3, 5, 6, 7, and 8 after CFA injection. (C) Mechanically evoked currents in HEK cells transfected with Piezo2 and YFP–Epac1 overexpressing GRK2 (HEK-PE-GRK2) (n = 22–26 cells) or control HEK–PE cells (n = 20–22 cells). The 8-pCPT or bath solution was added, and cells were voltage-clamped at −60 mV in a whole-cell configuration. Mechanically evoked currents were elicited by increasing displacement of the cell membrane in 1-μm increments. **P < 0.01; ***P < 0.001. (D) Peak current elicited by the largest mechanical stimulus before whole-cell configuration was lost. **P < 0.01.
Fig. S9.
Fig. S9.
Effect of asODN against Piezo2 on CFA-induced mechanical hyperalgesia. asODNs against Piezo2 or scrambled control ODN were administered intrathecally (i.t.) on days −3, −2, and −1 before CFA injection. Mechanical hyperalgesia was assessed at the indicated time points by using von Frey hairs.

References

    1. Simon LS. Relieving pain in America: A blueprint for transforming prevention, care, education, and research. J Pain Palliat Care Pharmacother. 2012;26(2):197–198.
    1. Wei F, et al. Genetic elimination of behavioral sensitization in mice lacking calmodulin-stimulated adenylyl cyclases. Neuron. 2002;36(4):713–726. - PubMed
    1. Eijkelkamp N, Singhmar P, Heijnen CJ, Kavelaars A. 2015. Sensory neuron cAMP signaling in chronic pain. Cyclic Nucleotide Signaling, Methods in Signal Transduction Series, ed Cheng X (CRC, Boca Raton, FL), pp 113–134.
    1. Taiwo YO, Levine JD. Further confirmation of the role of adenyl cyclase and of cAMP-dependent protein kinase in primary afferent hyperalgesia. Neuroscience. 1991;44(1):131–135. - PubMed
    1. Aley KO, Levine JD. Role of protein kinase A in the maintenance of inflammatory pain. J Neurosci. 1999;19(6):2181–2186. - PMC - PubMed

Publication types

MeSH terms