. 2016 Mar 15;113(11):E1442-51.
doi: 10.1073/pnas.1509428113. Epub 2016 Feb 29.

Functional and topological diversity of LOV domain photoreceptors

Affiliations

Functional and topological diversity of LOV domain photoreceptors

Spencer T Glantz et al. Proc Natl Acad Sci U S A. .

Abstract

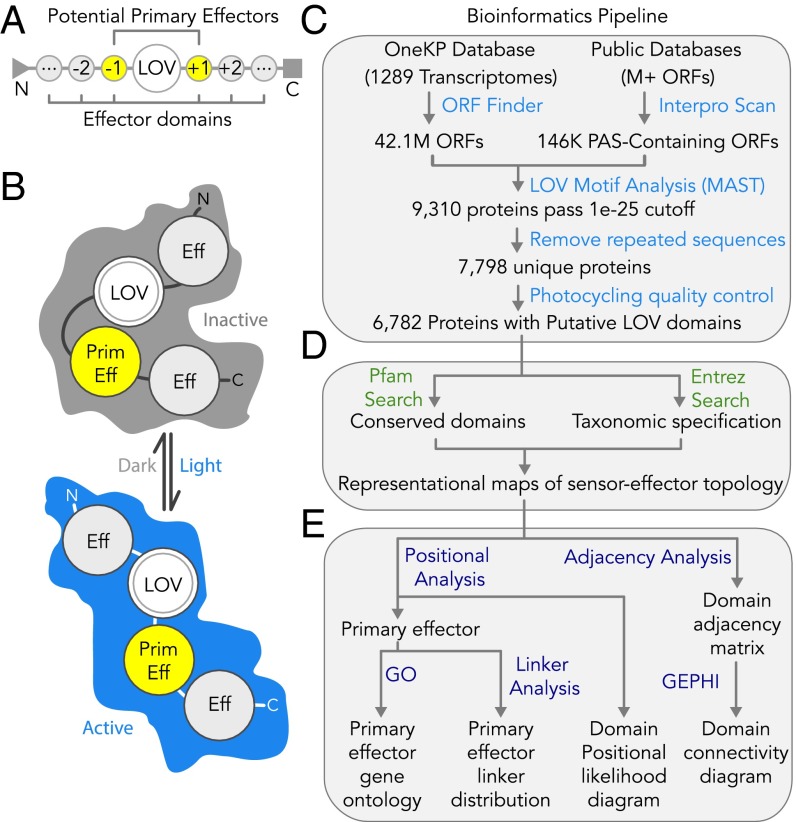
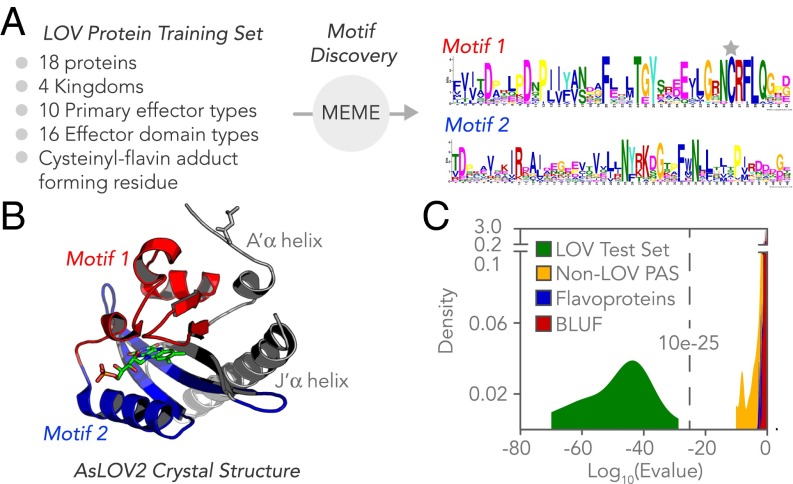
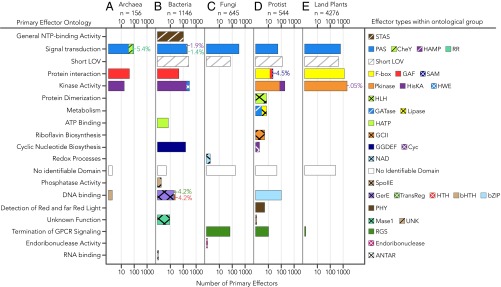
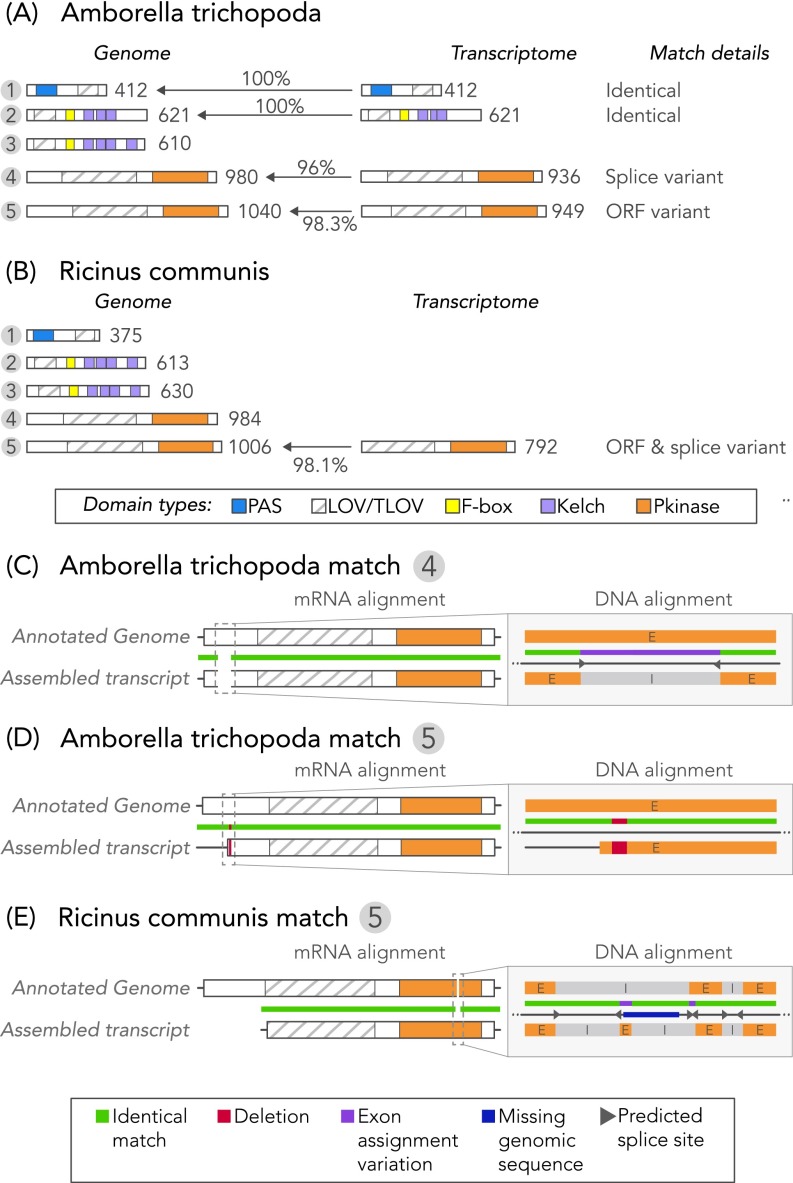
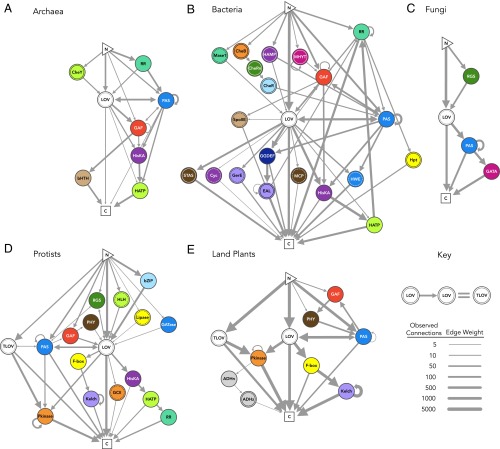
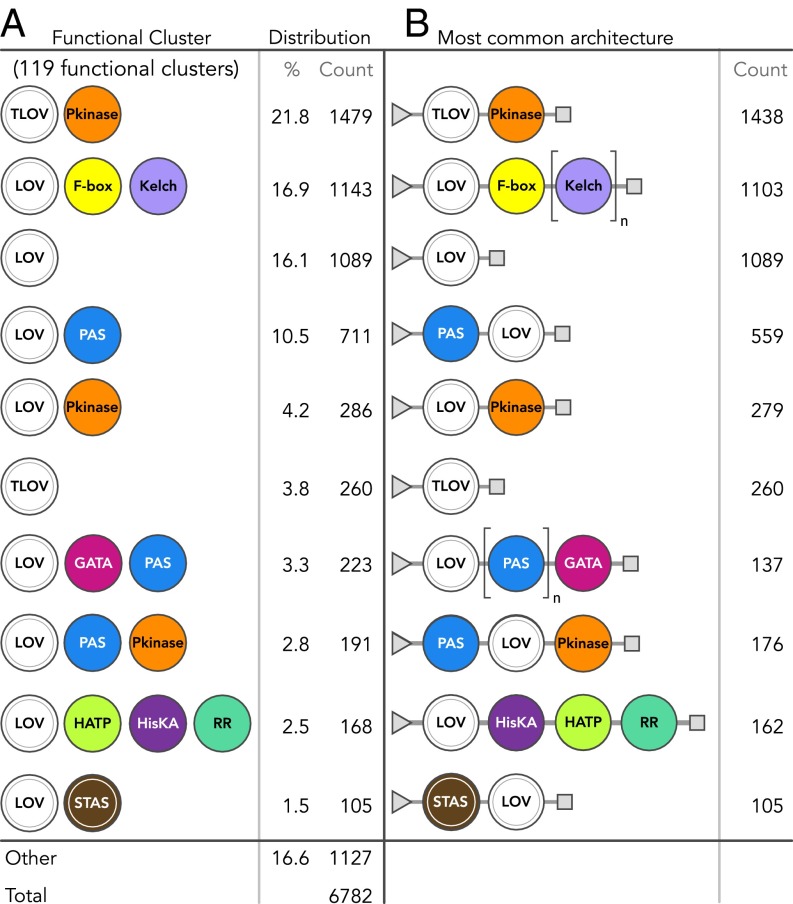
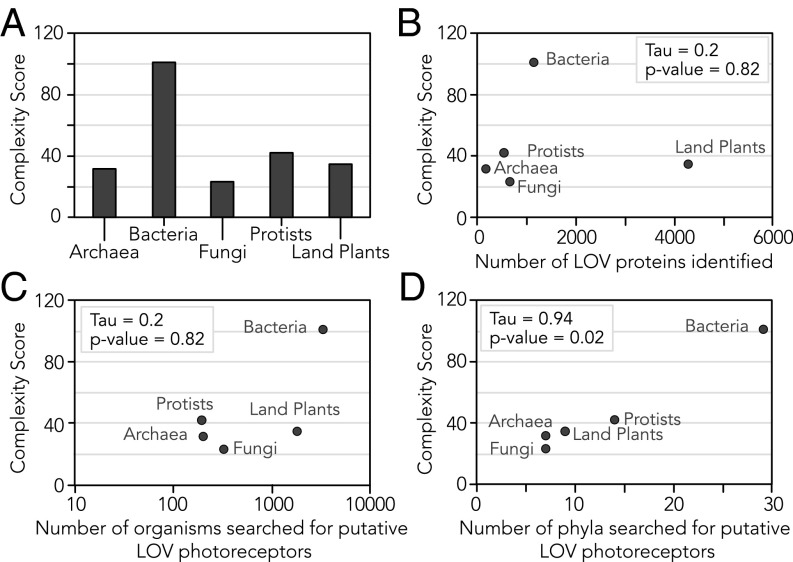
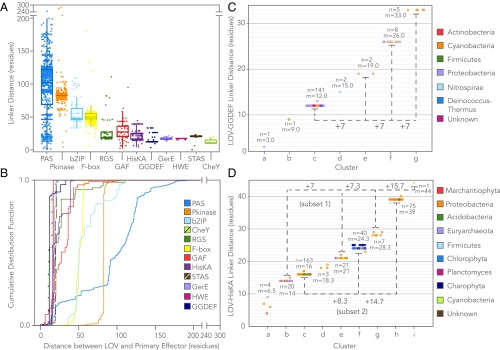
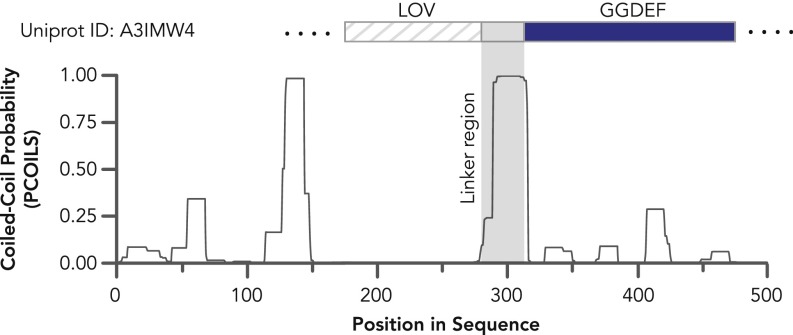
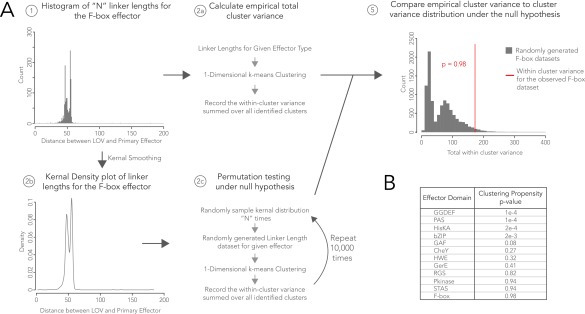
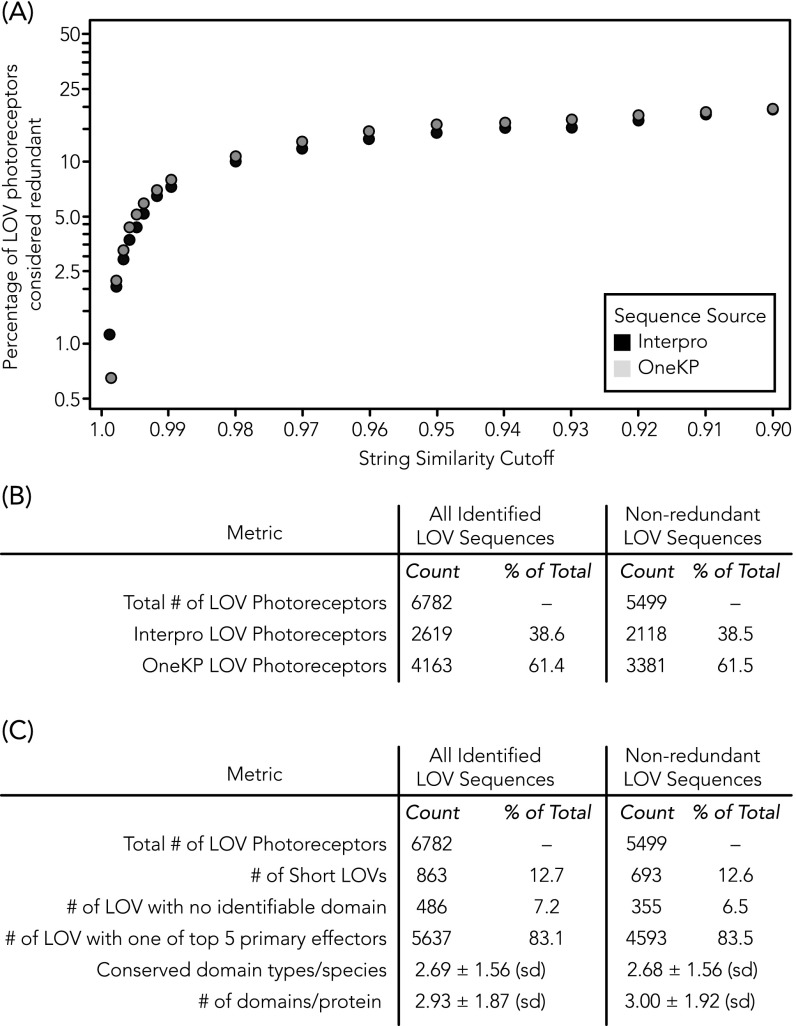
Light-oxygen-voltage sensitive (LOV) flavoproteins are ubiquitous photoreceptors that mediate responses to environmental cues. Photosensory inputs are transduced into signaling outputs via structural rearrangements in sensor domains that consequently modulate the activity of an effector domain or multidomain clusters. Establishing the diversity in effector function and sensor-effector topology will inform what signaling mechanisms govern light-responsive behaviors across multiple kingdoms of life and how these signals are transduced. Here, we report the bioinformatics identification of over 6,700 candidate LOV domains (including over 4,000 previously unidentified sequences from plants and protists), and insights from their annotations for ontological function and structural arrangements. Motif analysis identified the sensors from ∼42 million ORFs, with strong statistical separation from other flavoproteins and non-LOV members of the structurally related Per-aryl hydrocarbon receptor nuclear translocator (ARNT)-Sim family. Conserved-domain analysis determined putative light-regulated function and multidomain topologies. We found that for certain effectors, sensor-effector linker length is discretized based on both phylogeny and the preservation of α-helical heptad repeats within an extended coiled-coil linker structure. This finding suggests that preserving sensor-effector orientation is a key determinant of linker length, in addition to ancestry, in LOV signaling structure-function. We found a surprisingly high prevalence of effectors with functions previously thought to be rare among LOV proteins, such as regulators of G protein signaling, and discovered several previously unidentified effectors, such as lipases. This work highlights the value of applying genomic and transcriptomic technologies to diverse organisms to capture the structural and functional variation in photosensory proteins that are vastly important in adaptation, photobiology, and optogenetics.

Keywords: LOV; flavoproteins; optogenetics; photoreceptors.


Conflict of interest statement

The authors declare no conflict of interest.

Figures

Fig. 1.
Fig. 1.
Automated bioinformatics pipeline to identify LOV proteins and analyze their functional and structural diversity. (A) Multidomain topology of an LOV photosensor (or tandem sensors) fused to neighboring N- and/or C-terminal effectors (negative and positive positions, respectively). (B) Transduction of photosensory inputs into signaling outputs through light-gated structural rearrangements between sensor and neighboring effector(s). (C–E) Automated cataloging of LOV proteins via Python scripts. (C) Motif-based sensor identification from OneKP and PAS InterPro databases, followed by quality control measures and a check for the conserved cysteine required for photocycling and signal transmission. (D) Annotation of up/downstream conserved domains within the protein cluster by Pfam and InterPro database queries and taxonomic specification of organism of protein origin by Entrez query. (E) Analysis of functional and structural diversity from the resultant computer readable maps, for nearest effector GO, sensor–effector linker length, and multidomain positional likelihood and connectivity.
Fig. 2.
Fig. 2.
Motif-based identification of LOV proteins and discrimination from related non-LOV proteins. (A) Sequence logos for motifs 1 and 2, identified by the MEME tool for a training set of 18 LOV proteins validated to photocycle, with the cysteine that forms the cysteinyl-flavin adduct during the photocycle marked with a gray star and (B) mapped onto the crystal structure of LOV2 from A. sativa (Protein Data Bank ID code 2V0U). The motifs encompass the flavin-binding pocket but not the linker region or the A’-alpha and J-alpha helices (shown in gray). (C) Histogram showing the likelihood (log10 of e-value) that motifs 1 and 2 are present in a given domain shows clear discrimination between known LOV sensors and closely related protein classes of non-LOV PAS proteins, BLUF domains, and other flavoproteins. When searching for the motifs in known test set LOV domains that were also in the training set, we applied a leave-one-out cross-validation scheme, in which the two sensor motifs were regenerated for the training LOV dataset minus one LOV photoreceptor, and the sensor motifs were then searched for with the MAST tool on the remaining LOV photoreceptor. The MEME training dataset proteins were selected to span a range of physiological functions, organisms of origin, and ecological niches and have been previously validated to photocycle. Training and test sets are provided in Dataset S1.
Fig. 3.
Fig. 3.
Diversity in primary effector identity and ontological function. Primary effectors are separated by (A) archaea, (B) bacteria, (C) fungi, (D) protists, and (E) land plants. Effectors are defined as the nearest conserved domain to sensors with respect to primary structure. Tandem LOVs are collapsed and treated as a single sensor domain, with possible effector domains N-terminal to the first LOV domain and C-terminal to the second LOV domain in the sequence. Bar plots indicate the number of effector domains of a given GO (assigned by Pfam and Interpro) for a given kingdom on a log10 scale. Bars are colored and hatched according to the fractional number (linear scale) and type of effector domains found with a given ontology. The percent relative distribution is provided for primary effectors that are not readily distinguishable by the eye. The order of domains in each figure legend corresponds to the priority with which bars were stacked, such that leftmost domains are stacked first and rightmost domains are stacked last. The total number of LOV proteins found in each kingdom is provided as n. Full names of effector abbreviations are provided in Dataset S2. Fifteen candidate sequences of uncertain taxonomic origin (Incertae sedis) are omitted.
Fig. S1.
Fig. S1.
Comparisons between candidate gene sequence matches derived from the genome and transcriptome of the same organism. De novo transcriptome assembly quality does not affect reported LOV photoreceptor domain topologies. (A and B) Comparison of candidate sequence annotations for organisms represented in OneKP that also possess draft genomes of similar size to predicted genome sizes, (A) A. trichopoda and (B) R. communis, each with five unique genome-derived LOVs. Transcriptome-derived sequences had a genome-derived match based on domain combinations and order. Because only highly expressed transcripts are successfully assembled, half the genome-predicted candidates were found in the transcriptomes. Percentages represent protein sequence homology between matches. (C–E) Observed differences were attributable to assignments of splice site (A. trichopoda match #4) or attributable to raw sequence read of either the genome (R. communis match #5) or transcriptome (A. trichopoda match #5).
Fig. 4.
Fig. 4.
Effector position distribution within multidomain LOV proteins. Linear maps of multidomain polypeptides are separated by (A) archaea, (B) bacteria, (C) fungi, (D) protists, and (E) land plants. The x-axis represents domain position relative to a single or tandem LOV sensor. Sensors are assigned the zero positions, and conserved effector domains are numbered in increasing value toward the termini (negative N-terminal, positive C-terminal). Bar height (log10 scale) represents the total number of domains of any type observed at a given relative position. Fraction of each stacked bar (linear scale) that is uniquely colored and hatched corresponds directly to the fraction of domains at the given position of a specific domain type. Domains that constitute <10% of the fraction of any position for any kingdom are placed in “Other.” The order of domains in the figure legend corresponds to the priority with which bars were stacked, such that LOV domains are stacked first and the Other category is stacked last. Full names of effector abbreviations are provided in Dataset S2. Fifteen candidate sequences of uncertain taxonomic origin (I. sedis) are omitted.
Fig. 5.
Fig. 5.
Network maps of conserved domain connectivity. Connectivity networks are separated by (A) archaea, (B) bacteria, (C) fungi, (D) protists, and (E) land plants. Nodes represent sensor or effector domains. Nodes are colored and hatched according to effector domain type, where a solid ring inside the node indicates a single hatch and a dashed ring inside the node represents a crosshatch (to be consistent with all other figures). Edges between nodes represent a fusion of two domains (here, limited to connections observed ≥3 times for a kingdom), where edge weight corresponds to observed frequency of the connection on log2 scale. Networks originate at the N terminus, and arrows indicate the relative position of each domain in the polypeptide that culminates at the C terminus. Arrows that begin and end at the same node denote repeated effectors, with the exception of consecutive LOV sensors, which were grouped into tandem LOVs. Note that all pathways must pass through the LOV sensor in the diagrams. Full names of effector abbreviations are provided in Dataset S2. Fifteen candidate sequences of uncertain taxonomic origin (I. sedis) are omitted.
Fig. 6.
Fig. 6.
Grouping of conserved domains commonly associated in LOV proteins into functional clusters. (A) Ten most prevalent functional clusters of LOV proteins, where domains are grouped by composition, but independent of domain order and repeats. Frequency of occurrence is for each type of grouped domains or clusters, not individual domains. (B) Most common protein architecture for highly prevalent clusters (triangles, N terminus; squares, C terminus). Domains surrounded by brackets are commonly repeated, found n times total. Full names of effector abbreviations are provided in Dataset S2.
Fig. 7.
Fig. 7.
Architectural complexity correlates with evolutionary diversity. (A) Computed complexity quotient for each kingdom quantifies domain architectural complexity as the product of the average number of effector domains per LOV photoreceptor in the kingdom and the total number of different effector types observed across the kingdom. (B–D) Complexity quotients for each kingdom plotted versus (B) the total number of putative LOV sequences identified in the kingdom, (C) the total number of organisms searched for LOV in the kingdom, and (D) the total number of phyla searched for LOV in the kingdom. Kendall’s rank correlation tau coefficients and their accompanying P values are shown on each scatterplot. A strong correlation between the number of phyla searched and the complexity of the resulting LOV photoreceptors suggests that evolutionary diversity is a greater predictor of complexity than sample size.
Fig. 8.
Fig. 8.
Effector-specific discretization in sensor–effector linker length. (A) Overlaid scatter- and box-and-whisker plots of the linker length between LOV or tandem LOV sensors and their nearest effector domains, shown for effectors observed >10 times (box, first to third quartile; internal band, median). (B) Cumulative linker length distributions for effector-specific linker length between LOV or tandem LOV sensors and their nearest effector domains. (C and D) Heptad periodicity observed for linker regions that adopt extended coiled-coil structures. Bands were defined by k-means clustering, where a Bayesian Information Criterion was used to optimally choose the number of clusters, k. The number of linkers in a given cluster (n) and cluster mean (m) are labeled on each cluster directly. Dotted lines grouping heptad repeats are provided to guide the eye, shown for (C) LOV-GGDEF and (D) LOV-HisKA. LOV-STAS proteins are omitted because only one linker band is observed. Tight banding observed in C and D is indicative of heptad repeats, potentially reflecting structural optimization of sensor–effector orientation and the capability to transmit photosensory structural changes over variable physical distances through an extended coiled-coil linker. Colors in C and D indicate phylum-level taxonomic origin of the LOV.
Fig. S2.
Fig. S2.
Linker regions of LOV-GGDEF proteins are extended coiled-coil linkers. A representative trace of coiled-coiled probability as a function of sequence position is shown based on PCOILS prediction analysis with an analytical window size of 14. Sensor and primary effector domains are overlaid for clarity. The average coiled-coil probability of the linker region shown is nearly unity.
Fig. S3.
Fig. S3.
Resampling analysis to test statistical significance of linker length clustering. (A) Overview of resampling methodology, shown with linker lengths for the F-box effector domain as an example. (B) P values calculate the likelihood that a randomly resampled dataset will form clusters with as small or smaller variance as the observed linker length dataset, where P values < 0.05 are considered significant. GGDEF and HisKA linker length distributions exhibit linker length clustering more tightly than what would be expected by random chance (P < 0.001) for a linker length distribution with the corresponding range.
Fig. S4.
Fig. S4.
Relative redundancy is the same across InterPro and OneKP databases. (A) Percentage of LOV photoreceptor sequences from each database that would be considered redundant and collapsed into a single sequence according to a given similarity threshold. Similar percentages of redundant LOV photoreceptors were derived from each source for all similarity thresholds tested. (B) Clustering of redundant sequences into consensus parent sequences reduces the dataset size by ∼20%, similarly for both OneKP and InterPro. (C) Key finding metrics are similar between the nonclustered dataset (i.e., all candidates) and the clustered parent-only dataset, including the prevalence of the five most commonly found conserved domain effectors, as well as domain architectures susceptible to truncation artifacts in redundant sequences (short LOV and LOV with no identifiable conserved domain effector).

References

    1. Zoltowski BD, Gardner KH. Tripping the light fantastic: Blue-light photoreceptors as examples of environmentally modulated protein-protein interactions. Biochemistry. 2011;50(1):4–16. - PMC - PubMed
    1. Losi A, Mandalari C, Gärtner W. From plant infectivity to growth patterns: The role of blue-light sensing in the prokaryotic world. Plants. 2014;3(1):70–94. - PMC - PubMed
    1. Krauss U, et al. Distribution and phylogeny of light-oxygen-voltage-blue-light-signaling proteins in the three kingdoms of life. J Bacteriol. 2009;191(23):7234–7242. - PMC - PubMed
    1. Herrou J, Crosson S. Function, structure and mechanism of bacterial photosensory LOV proteins. Nat Rev Microbiol. 2011;9(10):713–723. - PMC - PubMed
    1. Crosson S, Rajagopal S, Moffat K. The LOV domain family: Photoresponsive signaling modules coupled to diverse output domains. Biochemistry. 2003;42(1):2–10. - PubMed

Publication types

MeSH terms