. 2016 Mar 15;113(11):E1565-74.
doi: 10.1073/pnas.1601375113. Epub 2016 Feb 29.

Disruption of lipid homeostasis in the Gram-negative cell envelope activates a novel cell death pathway

Affiliations

Disruption of lipid homeostasis in the Gram-negative cell envelope activates a novel cell death pathway

Holly A Sutterlin et al. Proc Natl Acad Sci U S A. .

Abstract

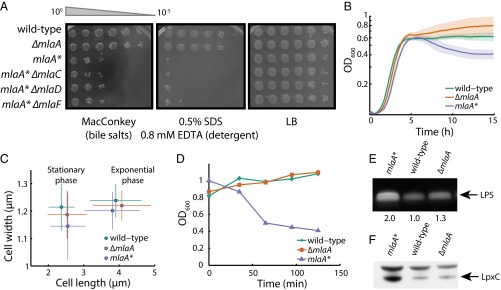
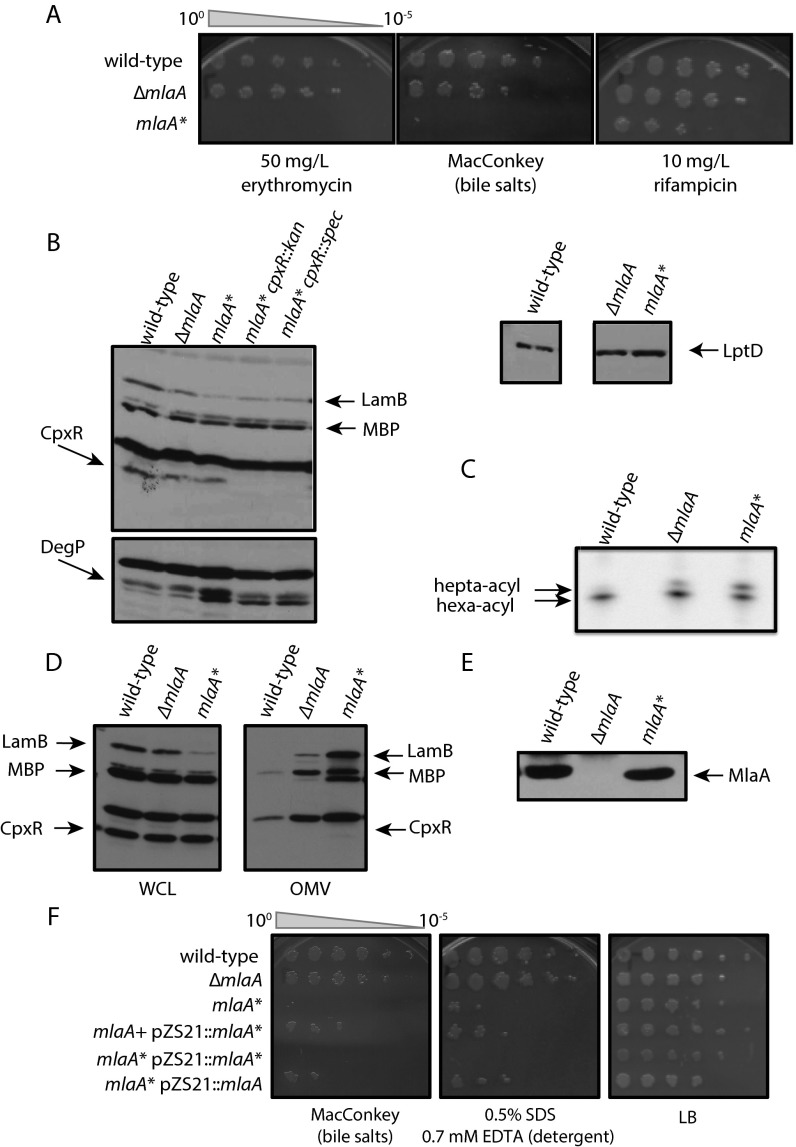
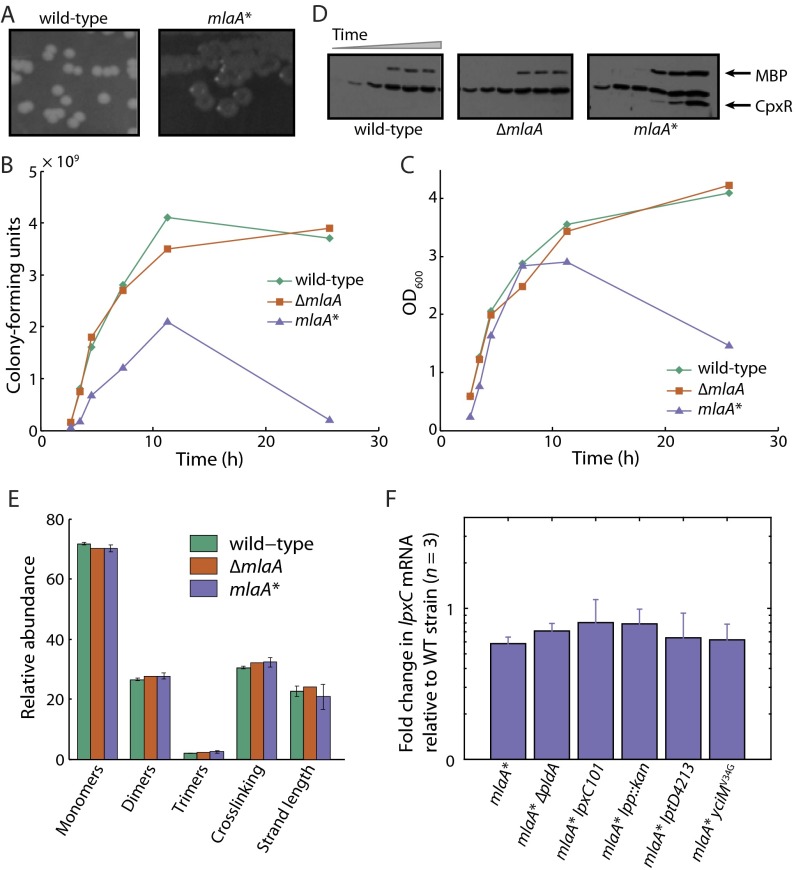
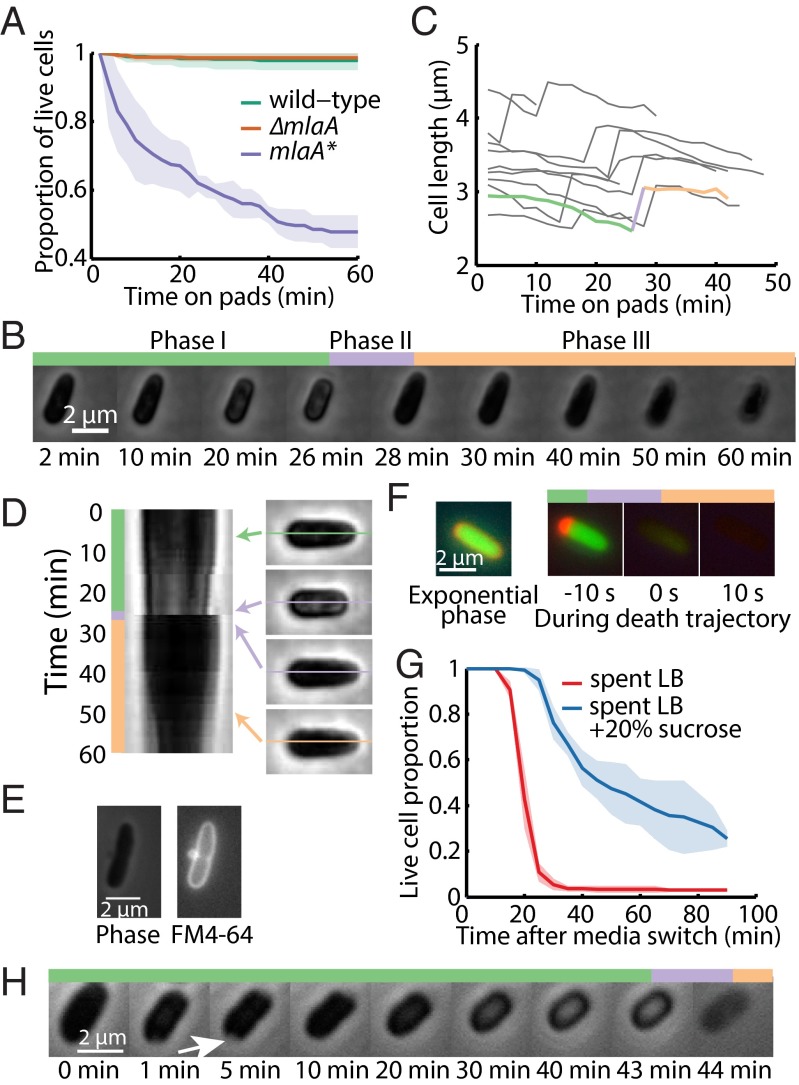
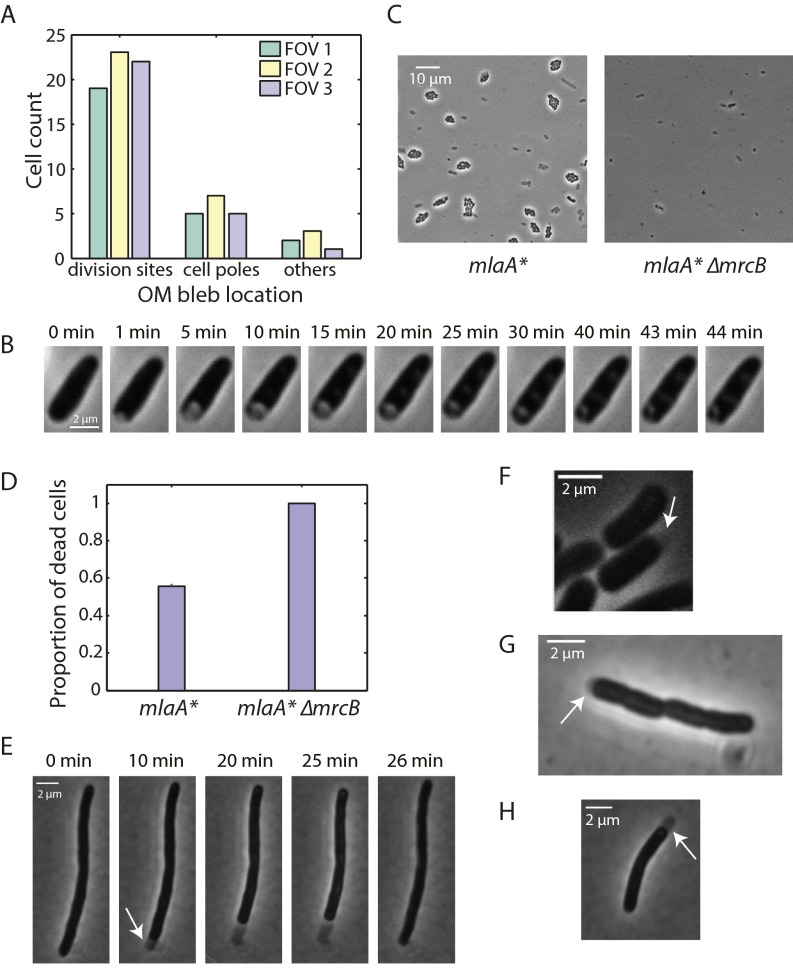
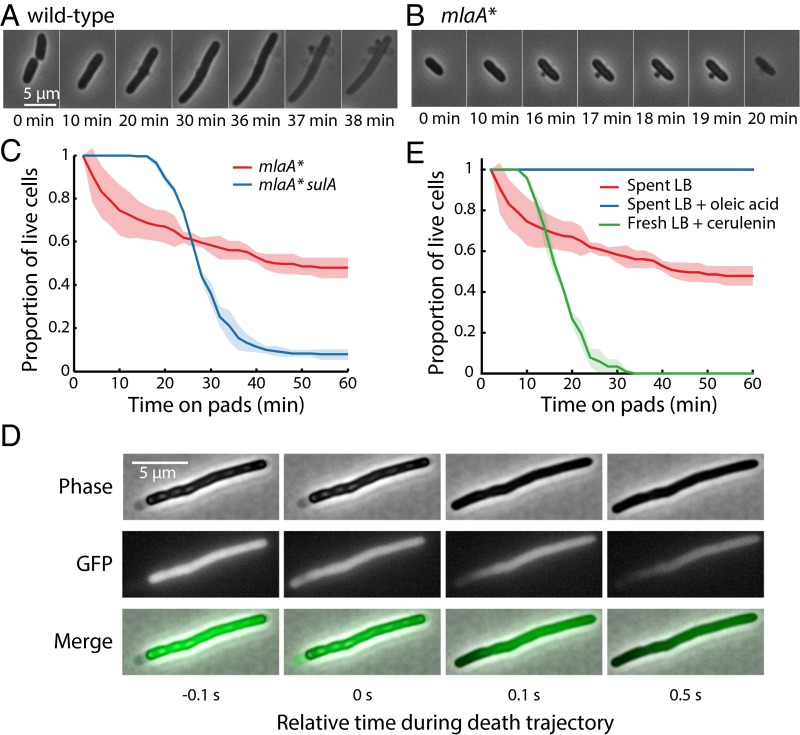
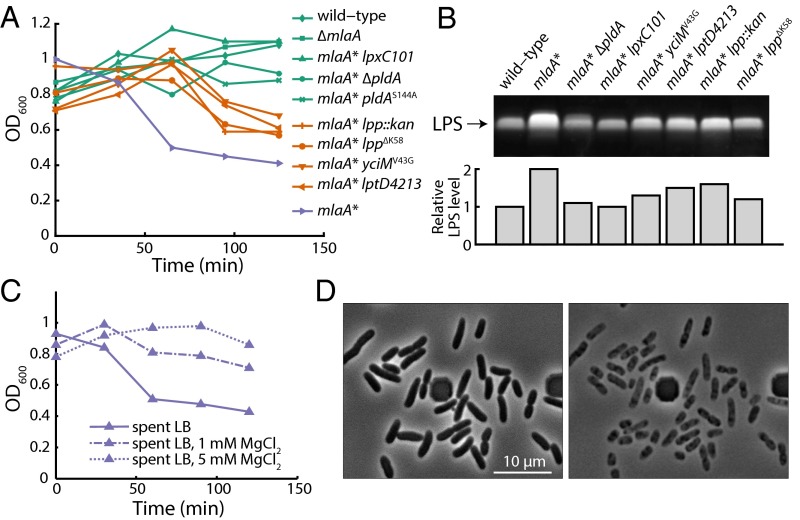
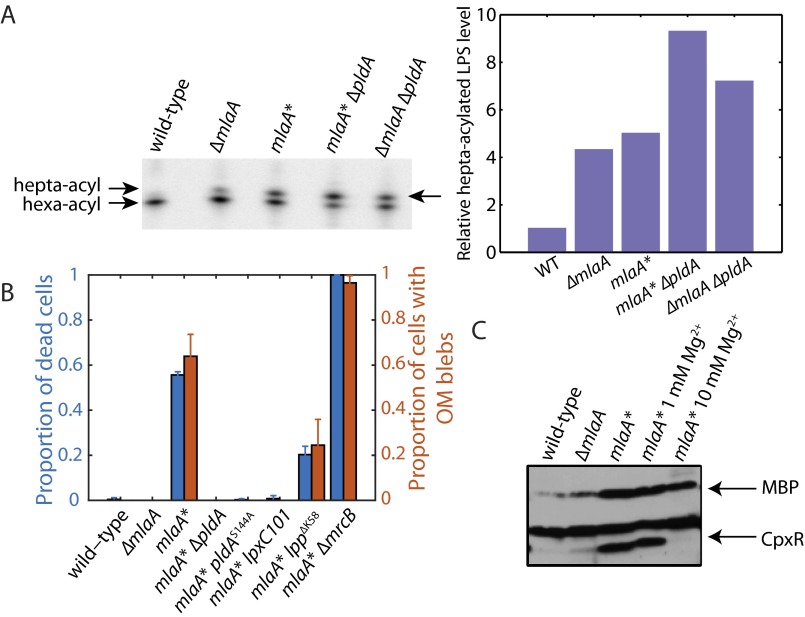
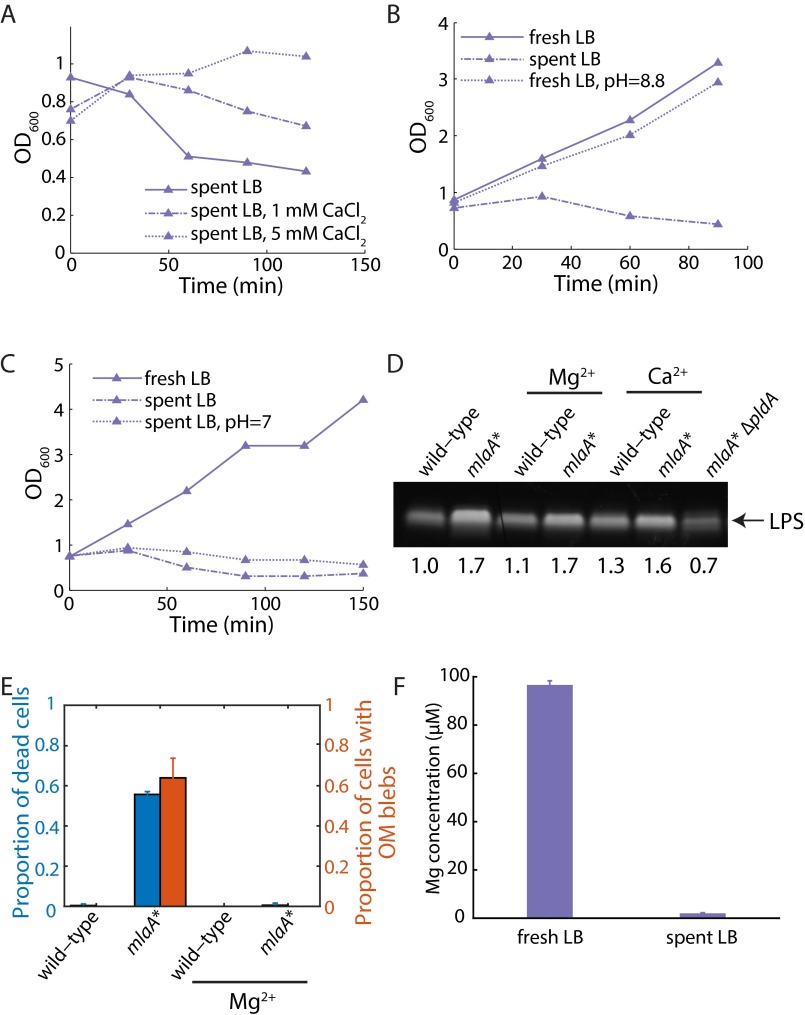
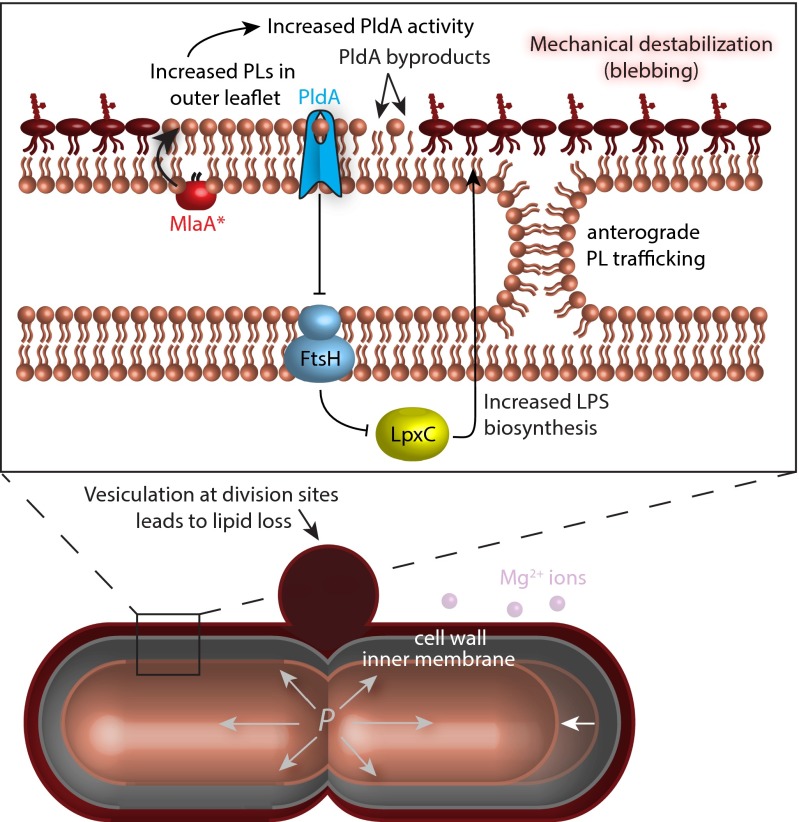
Gram-negative bacteria balance synthesis of the outer membrane (OM), cell wall, and cytoplasmic contents during growth via unknown mechanisms. Here, we show that a dominant mutation (designated mlaA*, maintenance of lipid asymmetry) that alters MlaA, a lipoprotein that removes phospholipids from the outer leaflet of the OM of Escherichia coli, increases OM permeability, lipopolysaccharide levels, drug sensitivity, and cell death in stationary phase. Surprisingly, single-cell imaging revealed that death occurs after protracted loss of OM material through vesiculation and blebbing at cell-division sites and compensatory shrinkage of the inner membrane, eventually resulting in rupture and slow leakage of cytoplasmic contents. The death of mlaA* cells was linked to fatty acid depletion and was not affected by membrane depolarization, suggesting that lipids flow from the inner membrane to the OM in an energy-independent manner. Suppressor analysis suggested that the dominant mlaA* mutation activates phospholipase A, resulting in increased levels of lipopolysaccharide and OM vesiculation that ultimately undermine the integrity of the cell envelope by depleting the inner membrane of phospholipids. This novel cell-death pathway suggests that balanced synthesis across both membranes is key to the mechanical integrity of the Gram-negative cell envelope.

Keywords: lipid transport; lipopolysaccharide; lysophospholipids; outer membrane; single-cell imaging.


Conflict of interest statement

The authors declare no conflict of interest.

Figures

Fig. 1.
Fig. 1.
mlaA* increases OM permeability and causes cell death in stationary phase. (A) Efficiency of plating assays on MacConkey or LB agar plates with the indicated supplements. Ten-fold dilutions of cultures are indicated above the left plate. mlaA* cells exhibited increased sensitivity to bile salts and detergent. Introduction of ΔmlaC::kan, ΔmlaD::kan, or ΔmlaF::kan in an mlaA* background did not decrease the severity of the mlaA* phenotype. (B) OD600 of a culture of mlaA* cells decreased during entrance into stationary phase, unlike wild-type or ∆mlaA cells. Maximal growth rates were approximately the same for all three strains (0.88 ± 0.04/h, 0.86 ± 0.03/h, and 0.90 ± 0.04/h, respectively). Solid curves are mean values from six independent samples; shaded areas represent the standard deviation (SD) of the samples. (C) Single-cell microscopy measurements of cellular dimensions for exponential-phase and stationary-phase cells. Wild-type, ΔmlaA, and mlaA* cells had virtually identical distributions of cellular dimensions during exponential growth and in stationary phase, with stationary-phase cells being shorter. Data points represent mean ± SD across >200 cells. (D) In the spent medium transition assay (Materials and Methods), the OD of mlaA* cells decreased within 30 min after the switch from exponential growth to resuspension in supernatant from an overnight culture. (E) mlaA* cells have higher LPS levels, as measured by SDS/PAGE (Materials and Methods). (F) Whole-cell protein lysates were prepared, separated by SDS/PAGE, and analyzed by immunoblotting (Materials and Methods). mlaA* increases the LpxC protein level.
Fig. S1.
Fig. S1.
mlaA* phenotypes indicate perturbations to OM composition. (A) Efficiency of plating assay on LB agar plates with the indicated supplements. Ten-fold dilutions of cultures are indicated above the left plate. mlaA* cells exhibit increased sensitivity to bile salts, erythromycin, and rifampicin. (B) Whole-cell protein lysates were prepared, separated by SDS/PAGE, and analyzed by immunoblotting (Materials and Methods). mlaA* induces the σE and Cpx envelope stress responses. (C) 32PO4-radiolabeled lipid A samples were isolated and separated by TLC (Materials and Methods). mlaA* cells have more hepta-acylated lipid A than wild-type or ΔmlaA cells. (D) Whole-cell lysates (WCL) and OM vesicles (OMVs) were prepared, separated by SDS/PAGE, and analyzed by immunoblotting. mlaA* cells hypervesiculated in comparison with wild-type or ΔmlaA cells. (E) Whole-cell lysates were prepared, separated by SDS/PAGE, and analyzed by immunoblotting. MlaA* levels are comparable to levels of MlaA in wild-type cells. (F) The efficiency of plating assay on LB agar or MacConkey plates with the indicated supplements indicates that mlaA* is a gain-of-function mutation. Ten-fold dilutions of cultures are indicated above the left plate.
Fig. S2.
Fig. S2.
mlaA* causes partial cell death in stationary phase, and cell death is related to LPS levels. (A) mlaA* cells form colonies with distinct depressed colony centers. (BD) Growth assays with simultaneous quantification of cells by enumerating colony-forming units and immunoblotting for CpxR protein levels in the culture supernatant. Time points shown for each strain on each graph correspond to the six lanes on the immunoblot. The number of viable mlaA* cells decreased upon entrance into stationary phase. At later time points, the cytoplasmic stress response protein CpxR and the periplasmic maltose-binding protein (MBP) accumulated in the culture supernatant. (E) Digested wild-type, ΔmlaA, and mlaA* sacculi had quantitatively similar muropeptide abundances as measured by UPLC. Monomers refer to uncrosslinked muropeptides; dimers and trimers refer to double- and triple-crosslinked muropeptides, respectively. Crosslinking is the number of crosslinked muropeptides divided by the total number of disaccharides, and strand length is the length of the glycan strands as measured by the presence of terminating anhydro-muropeptides (55). Bars represent mean ± SD for three independent samples. (F) Quantitative RT-PCR of lpxC mRNA levels, normalized to the wild-type level. lpxC mRNA levels remain unchanged in mlaA* cells and in suppressors of the mlaA* phenotype.
Fig. 2.
Fig. 2.
Single-cell growth trajectories implicate an increase in cytoplasmic density and OM blebbing at the septum in cell death. (A) Growth on agarose pads made with spent LB medium led to a dead-cell fraction over 1 h similar to that observed in liquid LB (Fig. 1D). Dead cells were identified by the three phases discussed below, and death was defined by the rapid popping event. Solid curves are mean values from three independent experiments; shaded areas represent SDs. Each measurement involved >80 cells. (B) For cells that died, cell length displayed a characteristic trajectory of three phases involving gradual shortening (phase I), a rapid popping event (phase II), and steady shrinking coupled to a decrease in phase contrast toward the background level, indicating a slow loss of cytoplasmic contents (phase III). (C) Dynamics of cell length reflected the three phases of death, with the cell in B denoted by the thick curve; colors correspond to the three phases in B. (D) Kymograph of cell midline for the cell in B. In phase I, part of the cell gradually became bright; this bright region disappeared once the cell entered phase II at ∼30 min. (E) FM 4-64 labeling of the OM (Right) revealed a midcell bleb that is typical of the death trajectory and is not clearly visible under phase-contrast microscopy (Left). (F, Left) Exponentially growing mlaA* cells had an approximately uniform distribution of periplasmic mCherry surrounding the cytoplasmic GFP signal. (Right) During the death trajectory upon transition into spent LB, mCherry initially accumulated at one pole in the periplasm, indicating cytoplasmic shrinkage away from the OM. At the time of the popping event, both fluorescence signals leaked out of the cytoplasm, and the fluorescence intensity decreased to background levels within 10 s of popping. (G) The addition of sucrose to spent medium delayed cell death by tens of minutes. (The popping event following cell shrinkage was used as a signature of cell death.) The spent LB control also was performed in a microfluidic flow cell, without the hyperosmotic shock. Solid curves are mean values from three fields of view, and shaded areas represent SDs. Each measurement involved >50 cells. (H) After a hyperosmotic shock in a microfluidic flow cell caused by transfer from fresh LB to spent LB supplemented with 20% sucrose at t = 0 min, mlaA* cells plasmolyzed, with visible detachment of the cytoplasm from the cell wall and OM forming a concave region (arrow). The IM then shrank in area and resolved the concave region. The cells eventually underwent a death trajectory similar to that in B.
Fig. S3.
Fig. S3.
mlaA*-mediated stationary-phase death is related to cell division and IM shrinkage. (A) mlaA* cells stained with FM 4-64 exhibited blebbing when placed on agarose pads made with spent medium. The frequency of blebbing events was higher at division sites and cell poles than at other locations. Frequencies were measured in three fields of view (FOVs). (B) After a hyperosmotic shock in a microfluidic flow cell induced by transfer from fresh LB to spent LB supplemented with 20% sucrose at t = 0 min, wild-type cells first plasmolyzed, with visible detachment of the cytoplasm from the cell wall and OM that formed a concave region. The concave region gradually resolved because of the expansion of cytoplasm until the entire cell outline was again phase dark. (C) Exponentially growing mlaA* and mlaA* ∆mrcB cells were spotted onto agarose pads containing spent LB. The pads were incubated for 2.5 h and then were imaged. Dead cells appeared as gray ghosts, and live cells grew into microcolonies. (Left) Approximately half of the mlaA* cells were dead after 2.5 h. (Right) Nearly all mlaA*mrcB cells died. (D) The proportions of cells that underwent cell death in the spent medium transition assay in fields of view similar to those in C were calculated by counting the number of dead cells and microcolonies. The proportion of cell death is defined as the number of dead cells divided by the sum of dead cells and microcolonies. Bars represent mean ± SD for three fields of view. (E) SulA-induced mlaA* cells were placed onto an agarose pad containing spent LB. The cells exhibited a death trajectory similar to that of nonfilamentous cells as shown in Fig. 2B. In phase I, the IM detached from the cell wall and OM, leaving a visible periplasmic region (arrow). In phase II (25–26 min), the cytoplasmic region expanded to fill the whole region delimited by the cell wall and OM. (F) IM detachment also occurred during phase I of the death trajectory of nonfilamentous mlaA* cells. The periplasmic region is harder to observe because the cells are shorter. (G and H) IM detachment still occurred with the addition of the proton ionophore CCCP to spent LB in the transition assay, in both nonfilamentous mlaA* (G) and SulA-induced mlaA* cells (H).
Fig. 3.
Fig. 3.
Cell death in mlaA* cells is linked to cell division and fatty acid limitation. (A) Under 10 µg/mL cephalexin treatment, wild-type cells elongated for several doublings without dividing, eventually lysing because of bulging defects followed by rapid mechanical failure. (B) mlaA* cells rapidly developed OM blebs near midcell or at the poles and died within 20 min of cephalexin treatment. (C) Induction of sulA caused cell filamentation and delayed cell death in mlaA* cells for ∼20 min. (D) Phase-contrast and cytoplasmic GFP fluorescence images of a sulA-induced mlaA* cell during a short interval encompassing the popping event in the cell-death trajectory. Initially, the cytoplasm and IM shrank away from the cell wall, exposing periplasmic space near the left pole, and GFP signal was confined to the cytoplasm. At the popping event (t = 0 s), GFP filled the entire region encompassed by the cell envelope. After this time, GFP exited the cell, leaving a gradient of fluorescence increasing toward the right pole. (E) Cerulenin treatment of exponentially growing mlaA* cells on fresh LB pads caused cells to die, with a death trajectory at the single-cell level similar to that of untreated cells shifted onto spent LB pads. The addition of 1 mg/mL oleic acid in spent LB completely suppressed cell death.
Fig. 4.
Fig. 4.
Genetic suppressors of cell death reverse the increases in LPS levels in mlaA* cells, whereas divalent cations stabilize the OM and suppress death. (A) The spent-medium transition growth assay demonstrated that mlaA* suppressors prevent death to differing degrees. (B) LPS levels correlated with the degree of suppression of mlaA*-mediated death during the transition to spent LB. (C) During a spent medium transition assay (Materials and Methods), supplementation with MgCl2 suppressed death in a concentration-dependent manner. (D) After the shift to spent LB in a microfluidic flow cell with constant flow, nearly every mlaA* cell died, with a death trajectory similar to that on pads shown in Fig. 2B. The dark square-like structures are part of the microfluidic device.
Fig. S4.
Fig. S4.
Suppressors of mlaA*-mediated death reduce LPS levels and suppress OM blebs. Chemical suppression of mlaA*-mediated stationary-phase death indicates restoration of OM mechanical stability. (A) 32PO4-radiolabeled lipid A samples were isolated and separated by TLC (Materials and Methods). pldA::kan in an mlaA* background has increased levels of hepta-acylated LPS, indicative of an increase in the levels of PLs in the outer leaflet of the OM. (Left) Gel image. (Right) Relative hepta-acylated LPS levels quantified from the gel. (B) Transition assay into spent medium was performed on mlaA* suppressor strains stained with FM 4-64. The wild-type, ∆mlaA, mlaA* lpxC101, mlaA*pldA, and mlaA* pldAS144A strains did not show any cell death; the mlaA* lpp∆K58 strains and the mlaA* ∆mrcB strains showed less and more death than mlaA*, respectively. The degree of OM blebbing in each case correlated with cell-death proportion. Bars represent mean ± SD in three fields of view. (C) Whole-cell protein lysates were prepared, separated by SDS/PAGE, and analyzed by immunoblotting (Materials and Methods). mlaA* strains grown overnight in the presence of excess magnesium do not accumulate CpxR in the culture supernatant.
Fig. S5.
Fig. S5.
Divalent cations are sufficient to suppress mlaA*-mediated cell death by mechanically stabilizing the OM. (A) The effects of CaCl2 on the suppression of death of mlaA* cells during the spent medium transition assay are similar to those of MgCl2 (Fig. 4C). (B) Growth in fresh LB with pH increased to 8.8 does not induce death of mlaA* cells. (C) Shifting the pH of spent LB to 7 does not suppress the death of mlaA* cells in the spent medium transition assay. (D) The addition of Ca2+ or Mg2+ does not reduce LPS levels in mlaA* cells. (E) The transition assay into Mg2+-supplemented spent medium was performed on mlaA* cells stained with the membrane dye FM –4-64. OM blebbing and cell death in mlaA* cells were both suppressed with 5 mM Mg2+. No blebs were observed in 136 of 136 mlaA* cells in medium supplemented with Mg2+. Bars represent mean ± SD in three fields of view. (F) Magnesium levels in LB and spent LB, measured by coupled plasma optical emission spectrometry. Fresh LB contains ∼100 µM Mg. The Mg level drops to ∼2 µM in spent LB. Bars represent mean ± SD in three independent samples.
Fig. 5.
Fig. 5.
Model of MlaA*-mediated death. The mlaA* allele increases LPS levels, and we hypothesize that this increase is caused by the cell’s response to the activation of PldA caused by MlaA* transferring PLs from the inner to the outer leaflet (the reverse of its wild-type activity). Because of this change in composition, OM material is lost through vesiculation at cell-division sites when cations are depleted. Because the area of the OM is constrained to be larger than the rigid cell wall, this loss is compensated by lipid flow to the OM from the IM in an energy-independent manner, possibly through sites of membrane hemifusion. Starved cells cannot synthesize fatty acids, and consequently the IM shrinks away from the cell wall (white arrow) and eventually ruptures because of the increase in turgor pressure. Cells die through slow leakage of cytoplasmic contents out of the envelope rather than through rapid lysis.

References

    1. Silhavy TJ, Kahne D, Walker S. The bacterial cell envelope. Cold Spring Harb Perspect Biol. 2010;2(5):a000414. - PMC - PubMed
    1. Bos MP, Robert V, Tommassen J. Biogenesis of the Gram-negative bacterial outer membrane. Annu Rev Microbiol. 2007;61:191–214. - PubMed
    1. Typas A, Banzhaf M, Gross CA, Vollmer W. From the regulation of peptidoglycan synthesis to bacterial growth and morphology. Nat Rev Microbiol. 2012;10(2):123–136. - PMC - PubMed
    1. Vollmer W, Blanot D, De Pedro MA. Peptidoglycan structure and architecture. FEMS Microbiol Rev. 2008;32(2):149–167. - PubMed
    1. Navarro Llorens JM, Tormo A, Martínez-García E. Stationary phase in Gram-negative bacteria. FEMS Microbiol Rev. 2010;34(4):476–495. - PubMed

Publication types

MeSH terms

LinkOut - more resources