

Avian responses to an extreme ice storm are determined by a combination of functional traits, behavioural adaptations and habitat modifications
- PMID: 26929387
- PMCID: PMC4772112
- DOI: 10.1038/srep22344
Avian responses to an extreme ice storm are determined by a combination of functional traits, behavioural adaptations and habitat modifications
Abstract
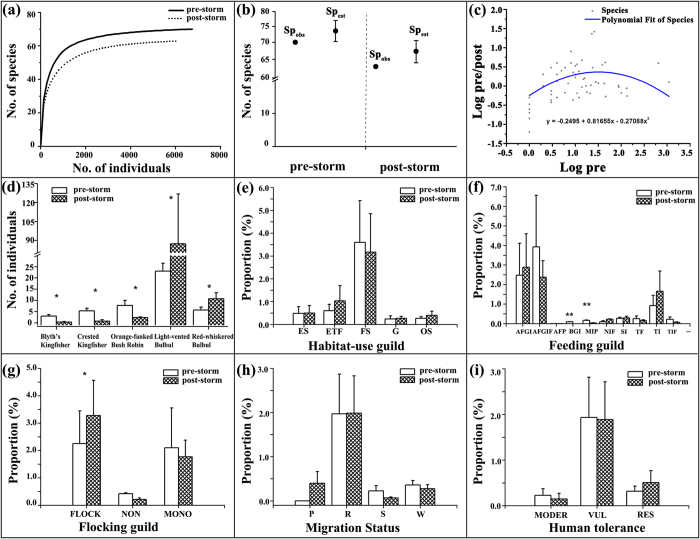
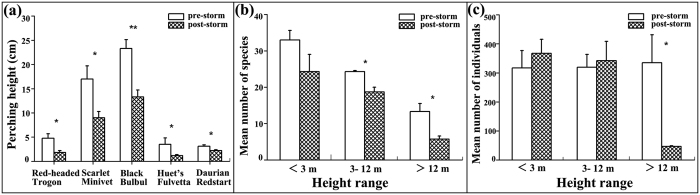
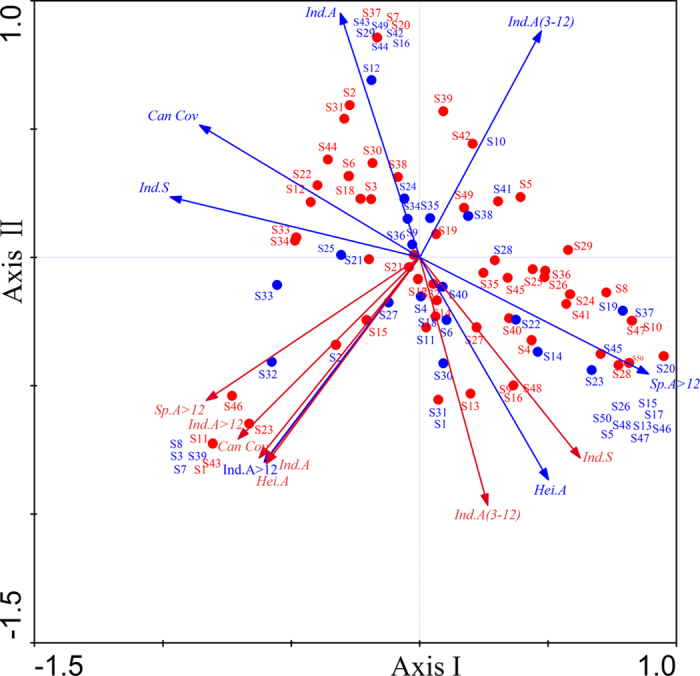
The extent to which species' traits, behavior and habitat synergistically determine their response to extreme weather events (EWE) remains poorly understood. By quantifying bird and vegetation assemblages before and after the 2008 ice storm in China, combined with interspecific interactions and foraging behaviours, we disentangled whether storm influences avian reassembly directly via functional traits (i.e. behavioral adaptations), or indirectly via habitat variations. We found that overall species richness decreased, with 20 species detected exclusively before the storm, and eight species detected exclusively after. These shifts in bird relative abundance were linked to habitat preferences, dietary guild and flocking behaviours. For instance, forest specialists at higher trophic levels (e.g. understory-insectivores, woodpeckers and kingfishers) were especially vulnerable, whereas open-habitat generalists (e.g. bulbuls) were set to benefit from potential habitat homogenization. Alongside population fluctuations, we found that community reassembly can be rapidly adjusted via foraging plasticity (i.e. increased flocking propensity and reduced perching height). And changes in preferred habitat corresponded to a variation in bird assemblages and traits, as represented by intact canopy cover and high density of large trees. Accurate predictions of community responses to EWE are crucial to understanding ecosystem disturbances, thus linking species-oriented traits to a coherent analytical framework.
Figures
References
-
- Easterling D. R. et al. Climate extremes: observations, modeling, and impacts. Science. 289, 2068–2074 (2000). - PubMed
-
- Walther G.-R. et al. Ecological responses to recent climate change. Nature. 416, 389–395 (2002). - PubMed
-
- Parmesan C. Ecological and evolutionary responses to recent climate change. Annu. Rev. Ecol. Evol. S. 37, 637–669 (2006).
-
- Mouillot D., Graham N. A., Villéger S., Mason N. W. & Bellwood D. R. A functional approach reveals community responses to disturbances. Trends. Ecol. Evol. 28, 167–177 (2013). - PubMed
-
- Easterling D. R. et al. Observed Variability and Trends in Extreme Climate Events: A Brief Review*. B. Am. Meteorol. Soc. 81, 417–425 (2000).
Publication types
MeSH terms
Substances
LinkOut - more resources
Full Text Sources
Other Literature Sources
