

A PEDIATRIC AIRWAY ATLAS AND ITS APPLICATION IN SUBGLOTTIC STENOSIS
- PMID: 26929791
- PMCID: PMC4769591
- DOI: 10.1109/ISBI.2013.6556697
A PEDIATRIC AIRWAY ATLAS AND ITS APPLICATION IN SUBGLOTTIC STENOSIS
Abstract
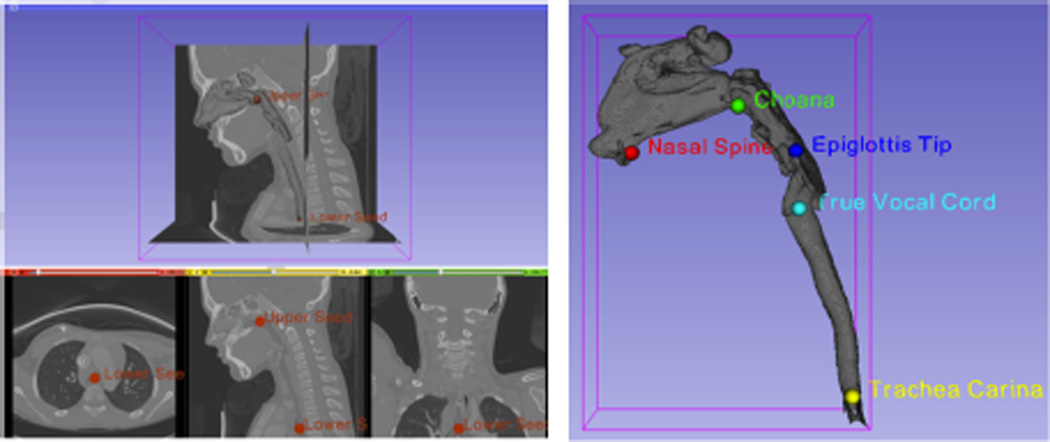
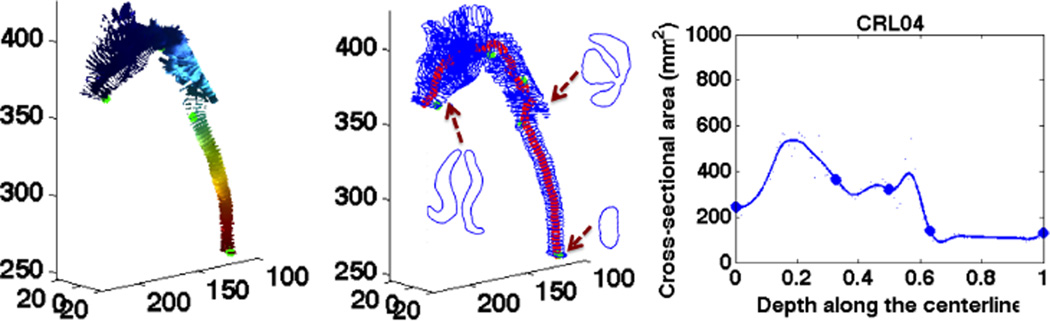
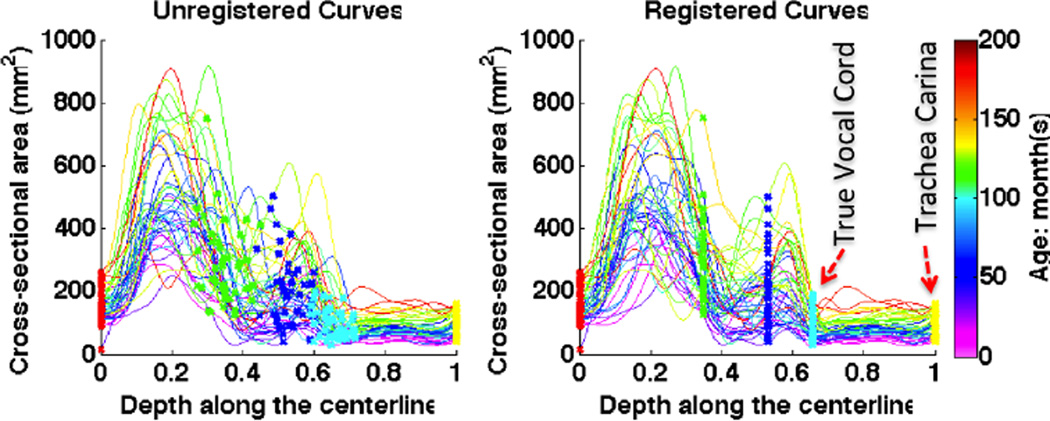
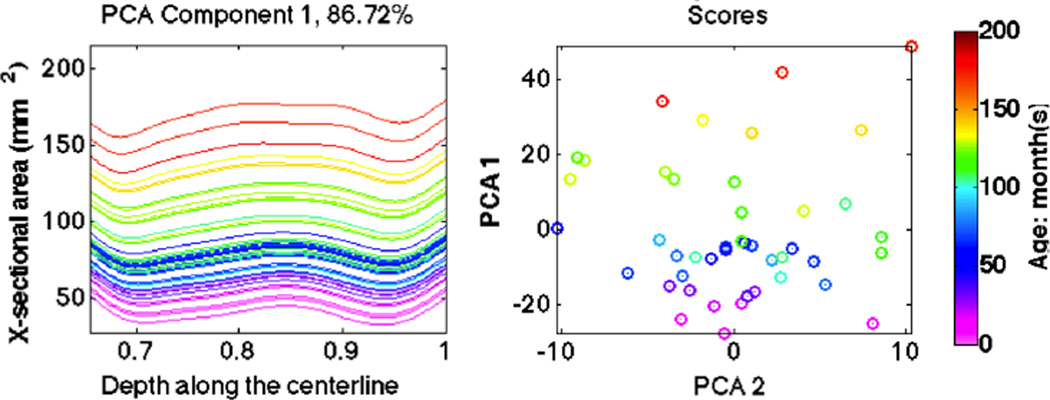
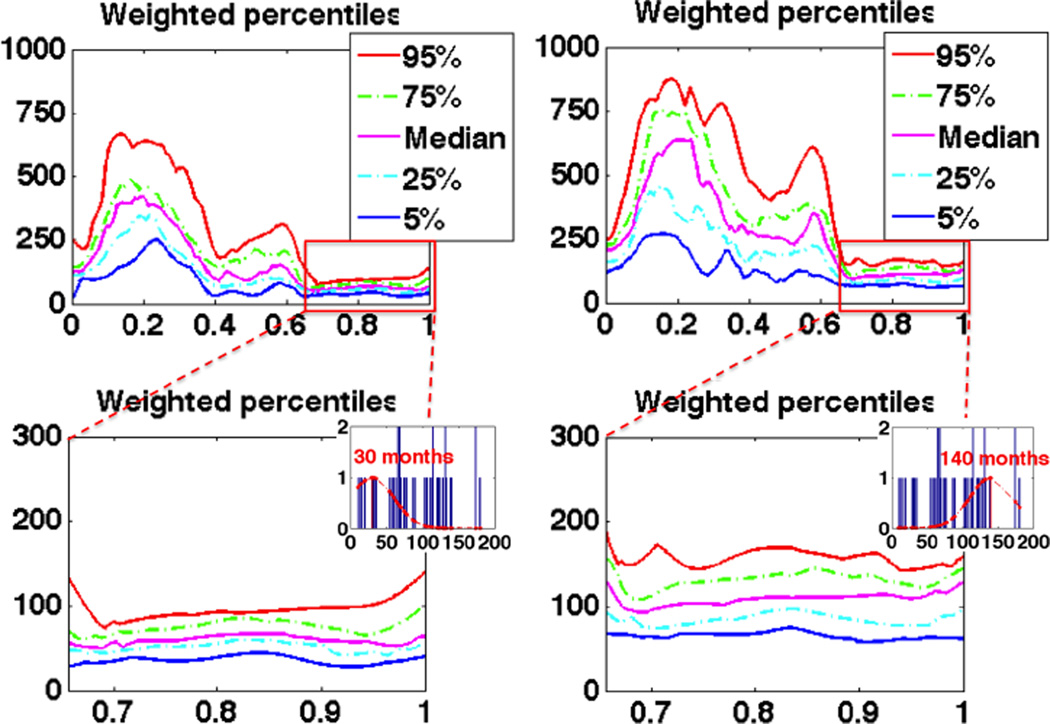
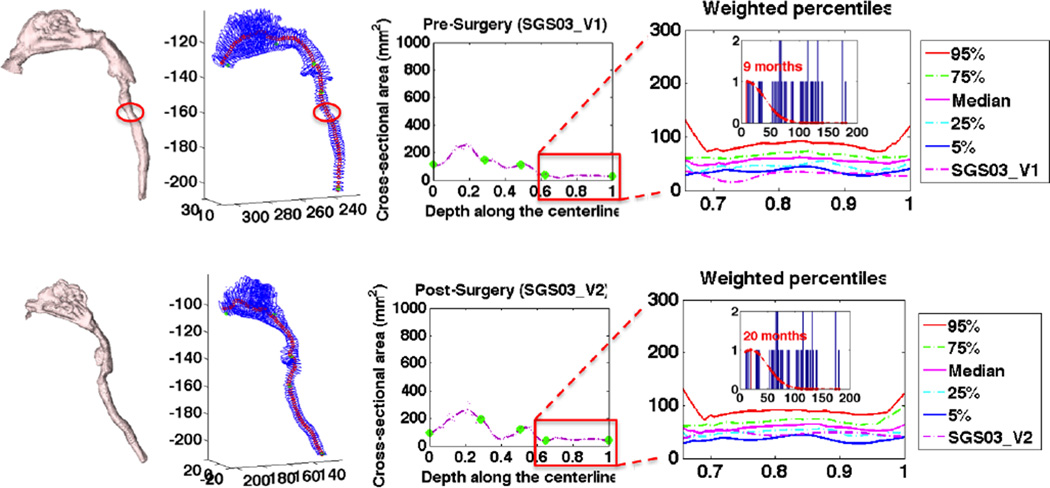
Young children with upper airway problems are at risk for hypoxia, respiratory insufficiency and long term morbidity. Computational models and quantitative analysis would reveal airway growth patterns and benefit clinical care. To capture expected growth patterns we propose a method to build a pediatric airway atlas as a function of age. The atlas is based on a simplified airway model in combination with kernel regression. We show experimental results on children with subglottic stenosis to demonstrate that our method is able to track and measure the stenosis in pediatric airways.
Keywords: Pediatric airway atlas; simplified airway model; subglottic stenosis; weighted percentiles.
Figures
References
-
- Daniel SJ. The upper airway: Congential malformations. Pediatric Respiratory Reviews. 2006 Jun;7S:S260–S263. - PubMed
-
- Arens R, mcDonough JM, Corbin AM, Rubin NK, Carroll ME, Pack AI, Liu J, Udupa JK. Upper airway size analysis by magnetic resonance imaging of children with obstructive sleep apnea syndrome. American Journal of Respiratory and Critical Care Medicine. 2003 Oct;167:65–70. - PubMed
-
- Wand MP, Jones MC. Kernel Smoothing. Chapman and Hall/CRC Press; 1994.
-
- Myer CM, O’Connor DM, Cotton RT. Proposed grading system for subglottic stenosis based on endotracheal tube sizes. Ann Otol Rhinol Laryngol. 1994 Apr;103:319–323. - PubMed
Grants and funding
LinkOut - more resources
Full Text Sources
Other Literature Sources