. 2016 Mar 1;11(3):e0150092.
doi: 10.1371/journal.pone.0150092. eCollection 2016.

Intra- and Interhemispheric Propagation of Electrophysiological Synchronous Activity and Its Modulation by Serotonin in the Cingulate Cortex of Juvenile Mice

Affiliations

Intra- and Interhemispheric Propagation of Electrophysiological Synchronous Activity and Its Modulation by Serotonin in the Cingulate Cortex of Juvenile Mice

Víctor Rovira et al. PLoS One. .

Abstract

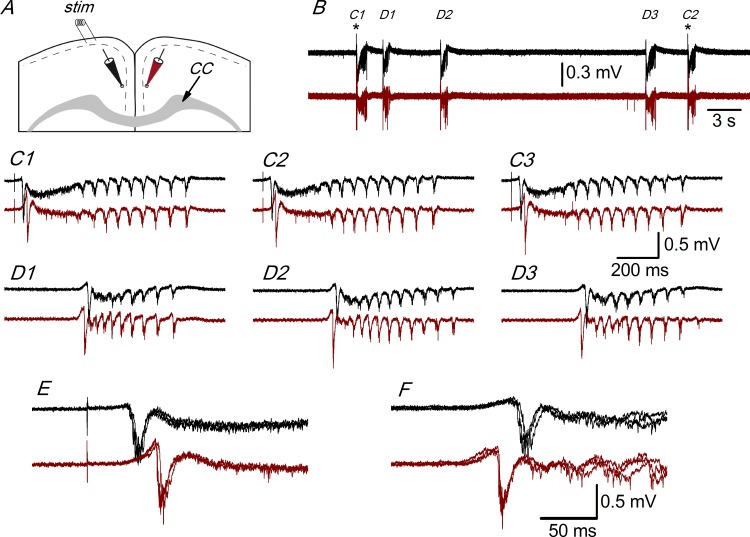
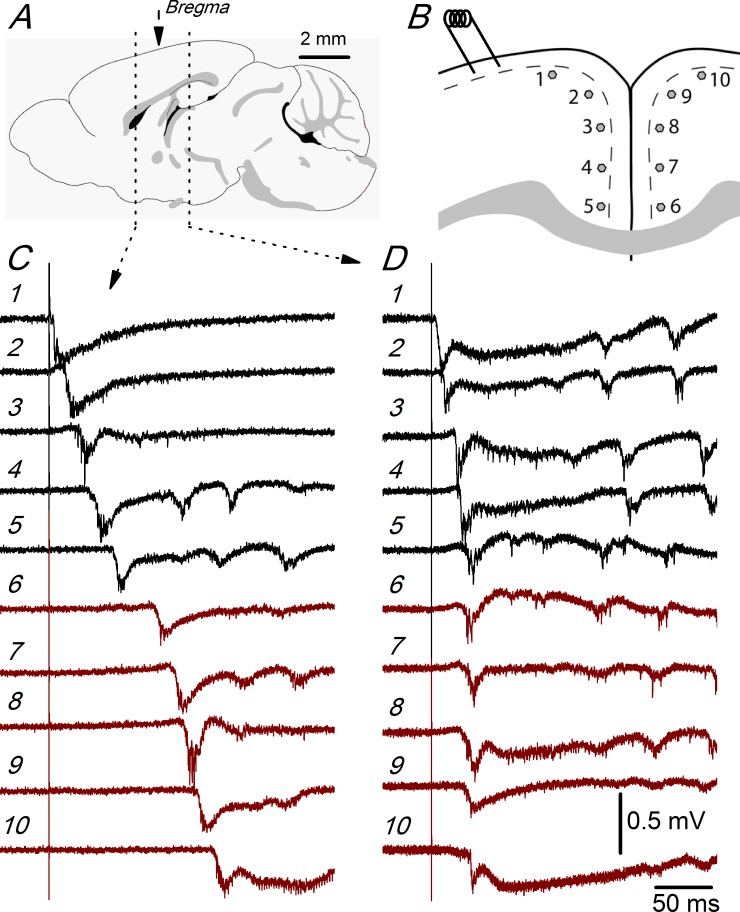
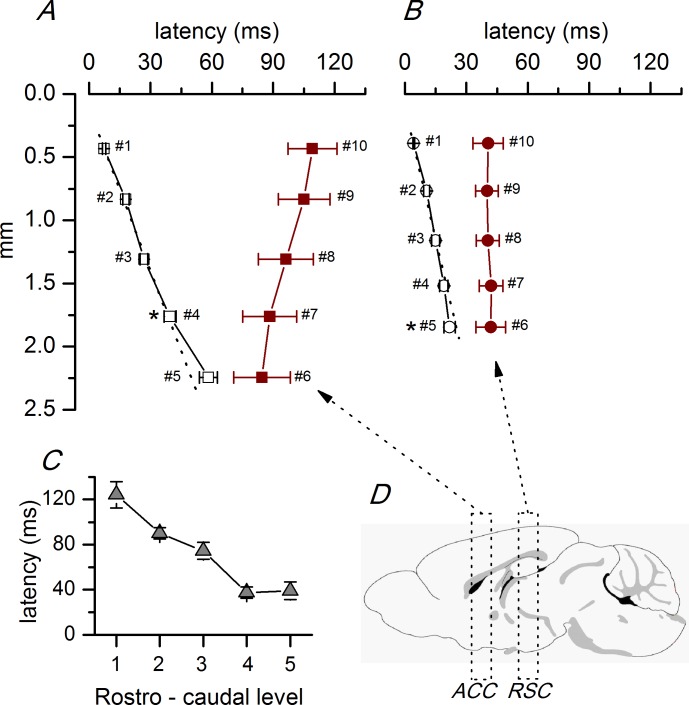
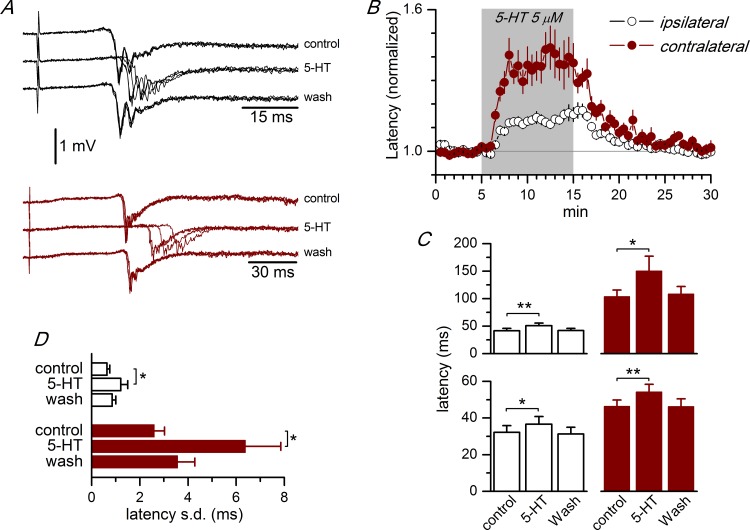
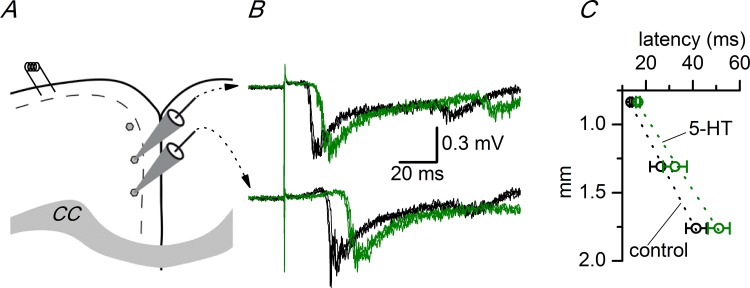
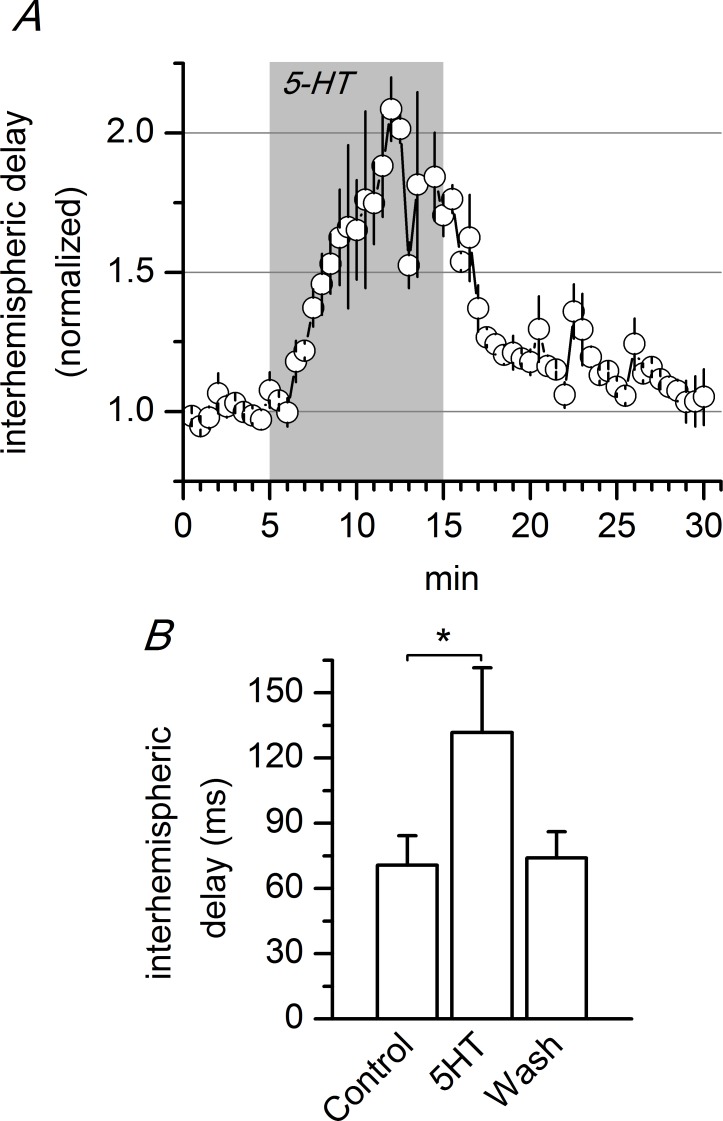
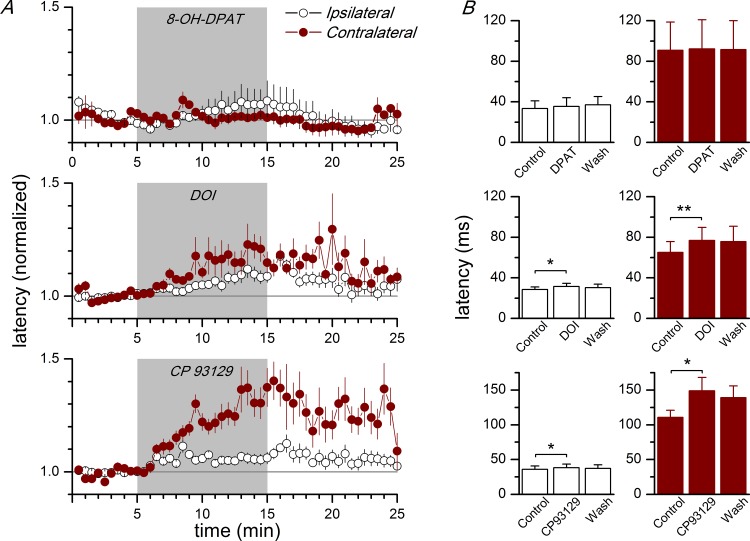
Disinhibition of the cortex (e.g., by GABA -receptor blockade) generates synchronous and oscillatory electrophysiological activity that propagates along the cortex. We have studied, in brain slices of the cingulate cortex of mice (postnatal age 14-20 days), the propagation along layer 2/3 as well as the interhemispheric propagation through the corpus callosum of synchronous discharges recorded extracellularly and evoked in the presence of 10 μM bicuculline by electrical stimulation of layer 1. The latency of the responses obtained at the same distance from the stimulus electrode was longer in anterior cingulate cortex (ACC: 39.53 ± 2.83 ms, n = 7) than in retrosplenial cortex slices (RSC: 21.99 ± 2.75 ms, n = 5; p<0.05), which is equivalent to a lower propagation velocity in the dorso-ventral direction in ACC than in RSC slices (43.0 mm/s vs 72.9 mm/s). We studied the modulation of this propagation by serotonin. Serotonin significantly increased the latency of the intracortical synchronous discharges (18.9% in the ipsilateral hemisphere and 40.2% in the contralateral hemisphere), and also increased the interhemispheric propagation time by 86.4%. These actions of serotonin were mimicked by the activation of either 5-HT1B or 5-HT2A receptors, but not by the activation of the 5-HT1A subtype. These findings provide further knowledge about the propagation of synchronic electrical activity in the cerebral cortex, including its modulation by serotonin, and suggest the presence of deep differences between the ACC and RSC in the structure of the local cortical microcircuits underlying the propagation of synchronous discharges.


Conflict of interest statement

Competing Interests: The authors have declared that no competing interests exist.

Figures

Fig 1
Fig 1. Interhemispheric propagation of synchronous discharges.
A, Drawing of a coronal slice indicating the position of the stimulus electrode ("stim") and two extracellular recording electrodes. CC: corpus callosum. B, Simultaneous extracellular recordings obtained with electrodes placed as shown in panel A; black trace: recording from the ipsilateral hemisphere (with respect to the stimulus electrode); dark red trace: recording from the contralateral hemisphere. In both recordings, there are evoked responses (C1 and C2) and spontaneous responses (D1-D3); asterisks mark the stimulation time. C1-C3, Evoked responses from the recordings of panel B shown at enlarged scale; C3 is the following evoked response not shown in panel B. D1-D3, Spontaneous responses from panel B shown at enlarged scale. The initial negative spikes of the evoked (C1-C3) and spontaneous (D1-D3) responses are shown enlarged and superimposed in panels E and F, respectively. Recordings from a P17 animal.
Fig 2
Fig 2. Propagation of synchronous discharges in the ACC and RSC.
A, Sagital drawing of the mouse brain showing the two rostro-caudal levels from which the recordings shown in panels C and D were obtained. The middle arrow shows the position of the bregma reference point. The rostral level to the bregma is at the ACC and the caudal level to the bregma is at the RSC. Fig taken from the mouse brain atlas of the Allen Institute (www.brain-map.org). B, Position of the stimulus electrode and the 10 recording sites used in these experiments; in ACC slices, the average distance between recording sites was 440 μm; in RSC slices, the relative position of the recording sites (in both hemispheres) was the same, but the average distance between recording sites was 370 μm. C and D, Recordings obtained at each of the recording sites shown in panel B obtained from an ACC slice (C; 0.98 mm from the bregma) and a RSC slice (D; -1.06 mm from bregma); the numbers next to the recordings correspond to the recording site numbers in B. Recordings shown in panels C and D are from two slices of the same P19 mouse.
Fig 3
Fig 3. Latencies of synchronous discharges propagated along the ACC and RSC.
A, Plot of the average latencies of the discharges recorded at different recording sites in the anterior cingulate cortex (n = 7 slices located between 1.34 and 0.38 mm from the bregma) in the ipsilateral (white symbols) and contralateral (dark red symbols) hemispheres. B, Plot of the average latencies of the discharges recorded at different recording sites in the retrosplenial cortex (n = 5 slices located between -1.06 and -2.06 mm from the bregma) in the ipsilateral and contralateral hemispheres (white and dark red symbols, respectively). The numbers next to each data point are the recording site number as described in Fig 2B). The distance of each recording site was measured with respect to the stimulus electrode in the ipsilateral cortex; in the contralateral cortex, the recording sites were placed symmetrically with respect to the ipsilateral side (see Fig 2B). The dotted lines show the linear fit to the latencies and the propagation velocities were calculated from the slope of these fits; the linear fit was done to the three dorsal values (recording sites #1-#3 as in Fig 2B). The difference of the latencies measured at a similar distance from the stimulus electrode (~1800 μm; recording site #4 in the ACC and #5 in the RSC) in ACC and RSC slices was statistically significant (* p<0.05 Student’s t test). C, Averaged latencies of the discharges recorded at the same position in the contralateral cortex (~400 μm from the most ventral recording site; recording site #7 as in Fig 2B) at different rostro–caudal levels, including the ACC and RSC. The level of the slices respect to the bregma shown in the horizontal axis were (in mm): 1, 1.34/0.86; 2, 0.62/0.14; 3, -0.10/-0.58; 4, -0.82/-1.34; 5, -1.58/-1.82. D, Sagital drawing of the mouse brain (same drawing as Fig 2A) showing the grouping of slices into ACC and RSC levels described in the text. The data points used to calculate the averages in panels A, B and C are available in S1 Table.
Fig 4
Fig 4. Latency variability in the ACC and RSC.
A, Example of latency variability in the recordings from an ACC slice (P19 animal, 0.62 mm from the bregma); black traces: ipsilateral recordings (at recording site #4) and dark red traces: contralateral recordings (at recording site #7). B, Example of latency variability from a RSC slice (P16 animal, -1.06 mm from the bregma); black trace: ipsilateral recordings (at recording site #4) and dark red traces: contralateral recordings (at recording site #7). Five consecutive responses superimposed in panels A and B. C, Average values of the standard deviations of the latencies obtained from series of 10 consecutive responses** p< 0.01 Mann-Whitney Rank Sum test. ACC ipsilateral (recording site #4) n = 55; ACC contralateral (recording site #7) n = 27; RSC ipsilateral (recording site #4) n = 7; RSC contralateral (recording site #7) n = 5. The data points used to calculate the averages in panel C are available in S2 Table.
Fig 5
Fig 5. Effect of 5-HT on the propagation of synchronous discharges.
A, Effect of the application of 5 μM 5-HT on the latency of the synchronous discharges recorded from an ipsilateral recording site (black traces, recording site #4; approximately at 1760 μm from the stimulus electrode) and from a contralateral recording site (dark red traces, recording site #7) in an ACC slice (P17 animal, -0.34 mm from the bregma); four consecutive responses superimposed in each trace. B, Time course of the effect of 5-HT on the latency of the synchronous discharges in ACC slices. 5-HT (5 μM) was applied during the time marked by shadow area. The plot shows the average of the values of the latency of the responses obtained from ipsilateral (white symbols, n = 32) and contralateral (dark red symbols, n = 22) recording sites; the latencies were normalized with respect to the average value of the control period. C, Absolute values of the latency of synchronous discharges obtained from ACC slices (upper histograms; n = 8 ipsilateral, 5 contralateral) and RSC slices (lower histograms; n = 3 ipsilateral, 4 contralateral) at recording sites #4 (ipsilateral, white columns) and #7 (contralateral, dark red columns). *p<0.05, **p<0.01, Student’s t test for paired samples. D, Variability of the latency of the evoked synchronous discharges measured as the standard deviation of the latencies of a series of 10 consecutive responses in ACC slices. White bars, values from recordings at recording site #4 (n = 6); dark red bars, values from recordings at recording site #7 (n = 5). * p<0.05, Student’s t test for paired samples. The data points used to calculate the averages in panels C and D are available in S3 Table.
Fig 6
Fig 6. Effect of 5-HT on the propagation velocity of evoked discharges.
A, Drawing of a coronal slice of the ACC showing the stimulus electrode and the three recording positions used to calculate the propagation velocity along layer 2/3. The recording sites were separated by 0.45 mm. CC: corpus callosum. B, Two simultaneous recordings obtained from the two more ventral recording sites shown in A. Three consecutive responses from the control period (black traces) and in the presence of 5 μM 5-HT (green traces). C, Change in the propagation velocity induced by 5 μM 5-HT in the ipsilateral cortex; the conduction velocity was calculated as the slope of the linear fit (dotted lines) to the latencies measured at the three recording sites shown in panel A. Control: 33.92 mm/s, 5-HT: 27.43 mm/s (n = 2–8). The vertical axis shows the distance measured from the stimulus electrode. The data points used to calculate the averages in panel C are available in S5 Table.
Fig 7
Fig 7. Effect of 5-HT on the interhemispheric propagation delay in the ACC.
A, Time course of the interhemispheric delay and effect of 5 μM 5-HT (n = 3). B, Absolute values of the interhemispheric delay measured during the last 3 minutes of control, the last 3 minutes of application of 5-HT, and the last 3 minutes of the washout of 5-HT (n = 3); the interhemispheric delay was calculated as the difference in latency between the recordings obtained at recording sites #4 (ipsilateral) and #7 (contralateral; see Fig 5B). * p<0.05, Student’s t test for paired samples. The data points used to calculate the averages in panel B are available in S6 Table.
Fig 8
Fig 8. Effect of agonists of 5-HT receptors on the latency of synchronous discharges.
A, Time course of the latency of synchronous discharges evoked by stimulation of layer 1 during the application of 10 μM 8-OH-DPAT (5-HT1A agonist, upper panel; ipsilateral and contralateral n = 4), 10 μM DOI (5-HT2A agonist, middle panel; ipsilateral n = 22, contralateral n = 10), and 10 μM CP93129 (5-HT1B agonist, bottom panel; ipsilateral n = 12, contralateral n = 6). The agonists were applied during the time marked by the gray area; latencies are given as percentage of the control value (white symbols are ipsilateral latencies and dark red symbols are contralateral latencies). B, Effect of the application of 10 μM 8-OH-DPAT (upper histograms; ipsi- and contralateral n = 4), 10 μM DOI (middle histograms; ipsilateral n = 22, contralateral n = 10) and 10 μM CP93129 (lower histograms; ipsilateral n = 12, contralateral n = 6) on the latencies of synchronous discharges evoked by stimulation of layer 1 and recorded at ipsilateral recording sites (white columns) and at contralateral recording sites (dark red columns). In each plot, there are pooled values from several recording sites. Latencies were measured and averaged during the last 5 minutes of control, the last 5 minutes of drug application, and the last 5 minutes of the washout. * p<0.05; **p<0.01 with respect to the control (Student's t test for paired samples). The data points used to calculate the averages in panel B are available in S7 Table.

Similar articles

Cited by

References

    1. Vogt BA, Peters A. Form and distribution of neurons in rat cingulate cortex: areas 32, 24 and 29. J Comp Neurol 1981; 195:603–625. - PubMed
    1. Vogt BA, Paxinos G. Cytoarchitecture of mouse and rat cingulate cortex with human homologies. Brain Struct Funct 2014; 219:185–92. 10.1007/s00429-012-0493-3 - DOI - PubMed
    1. Van der Werd HJJM, Rajkowska G, Evers P, Uylings HBM. Cytoarchitectonic and chemoarchitectonic characterization of the prefrontal cortical areas in the mouse. Brain Struct Funct 2010; 214: 339–353. 10.1007/s00429-010-0247-z - DOI - PMC - PubMed
    1. Van Groen T, Wyss JM. Connections of the retrosplenial dysgranular cortex in the rat. J Comp Neurol 1992; 315:200–216. - PubMed
    1. Wyss JM, Van Groen T, Sripanidkulchai K. Dendritic bundling on layer I of granular retrosplenial cortex: intracellular labeling and selectivity of innervation. J Comp Neurol 1990; 295:33–42. - PubMed

Publication types

MeSH terms

LinkOut - more resources