Comparative Study
. 2016 Mar 1;11(3):e0149988.
doi: 10.1371/journal.pone.0149988. eCollection 2016.

Comparative Epidemiology of Human Infections with Middle East Respiratory Syndrome and Severe Acute Respiratory Syndrome Coronaviruses among Healthcare Personnel

Affiliations
Comparative Study

Comparative Epidemiology of Human Infections with Middle East Respiratory Syndrome and Severe Acute Respiratory Syndrome Coronaviruses among Healthcare Personnel

Shelan Liu et al. PLoS One. .

Abstract

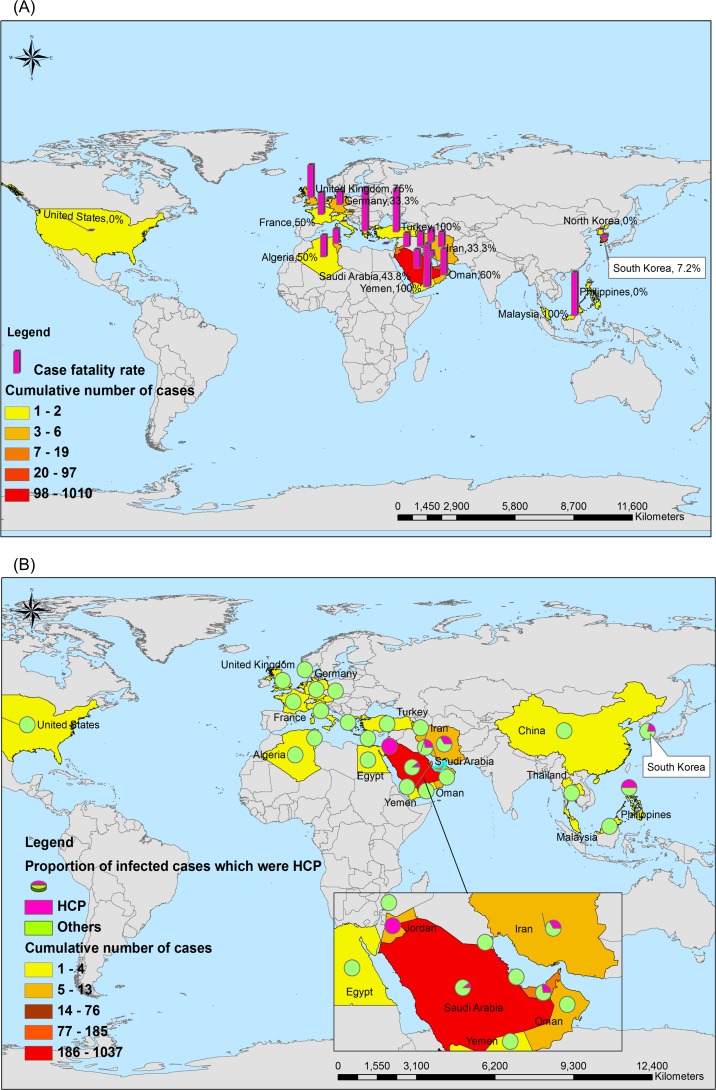
The largest nosocomial outbreak of Middle East respiratory syndrome (MERS) occurred in South Korea in 2015. Health Care Personnel (HCP) are at high risk of acquiring MERS-Coronavirus (MERS-CoV) infections, similar to the severe acute respiratory syndrome (SARS)-Coronavirus (SARS-CoV) infections first identified in 2003. This study described the similarities and differences in epidemiological and clinical characteristics of 183 confirmed global MERS cases and 98 SARS cases in Taiwan associated with HCP. The epidemiological findings showed that the mean age of MERS-HCP and total MERS cases were 40 (24~74) and 49 (2~90) years, respectively, much older than those in SARS [SARS-HCP: 35 (21~68) years, p = 0.006; total SARS: 42 (0~94) years, p = 0.0002]. The case fatality rates (CFR) was much lower in MERS-HCP [7.03% (9/128)] or SARS-HCP [12.24% (12/98)] than the MERS-non-HCP [36.96% (34/92), p<0.001] or SARS-non-HCP [24.50% (61/249), p<0.001], however, no difference was found between MERS-HCP and SARS-HCP [p = 0.181]. In terms of clinical period, the days from onset to death [13 (4~17) vs 14.5 (0~52), p = 0.045] and to discharge [11 (5~24) vs 24 (0~74), p = 0.010] and be hospitalized days [9.5 (3~22) vs 22 (0~69), p = 0.040] were much shorter in MERS-HCP than SARS-HCP. Similarly, days from onset to confirmation were shorter in MERS-HCP than MERS-non-HCP [6 (1~14) vs 10 (1~21), p = 0.044]. In conclusion, the severity of MERS-HCP and SARS-HCP was lower than that of MERS-non-HCP and SARS-non-HCP due to younger age and early confirmation in HCP groups. However, no statistical difference was found in MERS-HCP and SARS-HCP. Thus, prevention of nosocomial infections involving both novel Coronavirus is crucially important to protect HCP.


Conflict of interest statement

Competing Interests: The authors have declared that no competing interests exist.

Figures

Fig 1
Fig 1. Geographical distribution of 1368 laboratory-confirmed cases, 487 deaths and 183 healthcare personnel (HCP) infected with MERS-CoV from April 1 of 2012 to July 7 of 2015.
Notes: 1a: Overall MERS cases and the case fatality rate. The denominator is the cumulative number of total cases with MERS-CoV; Numerator is the case fatality rate in total cases. 1b: Overall MERS cases and percent of HCP with MERS infections. The denominator is the cumulative number of total cases with MERS-CoV; Pie represents the percentage of HCP and non HCP among the total cases.
Fig 2
Fig 2. Geographical distribution of 8096 laboratory-confirmed cases, 774 deaths and 1706 HCP infected with SARS-CoV from November 1 of 2002 to December 31, 2003.
Notes: 1a: Overall SARS cases and the case fatality rate. The denominator is the cumulative number of total cases with SARS-CoV; Numerator is the case fatality rate in total cases. 1b: Overall SARS cases and percent of HCP with SARS infections. The denominator is the cumulative number of total cases with SARS-CoV; Pie represents the percentage of HCP and non HCP among the total cases.
Fig 3
Fig 3. The age distribution in the laboratory-confirmed cases with MERS and SARS from Taiwan in overall population and HCP.
Note: 3a: MERS (N = 174) and SARS (N = 347) infections in overall cases. 3b: MERS-HCP (N = 143) and SARS-HCP (N = 98) cases.
Fig 4
Fig 4. The occupational categories of hospital-associated MERS infections (n = 169) in Korea, 2015 and SARS infections (n = 227) in Taiwan, 2003.
Notes: 4a: Occupational distribution in MERS-HCP. 4b: Occupational distribution in SARS-HCP.

References

    1. Zumla A, Perlman S, McNabb SJ, Shaikh A, Heymann DL, McCloskey B, et al. Middle East respiratory syndrome in the shadow of Ebola. The Lancet Respiratory medicine. 2015;3(2):100–2. 10.1016/S2213-2600(14)70316-9 . - DOI - PMC - PubMed
    1. de Groot RJ, Baker SC, Baric RS, Brown CS, Drosten C, Enjuanes L, et al. Middle East respiratory syndrome coronavirus (MERS-CoV): announcement of the Coronavirus Study Group. J Virol. 2013;87(14):7790–2. 10.1128/JVI.01244-13 - DOI - PMC - PubMed
    1. Raj VS, Farag EA, Reusken CB, Lamers MM, Pas SD, Voermans J, et al. Isolation of MERS coronavirus from a dromedary camel, Qatar, 2014. Emerging infectious diseases. 2014;20(8):1339–42. 10.3201/eid2008.140663 - DOI - PMC - PubMed
    1. Drosten C, Kellam P, Memish ZA. Evidence for camel-to-human transmission of MERS coronavirus. The New England journal of medicine. 2014;371(14):1359–60. 10.1056/NEJMc1409847#SA1 . - DOI - PubMed
    1. Memish ZA, Mishra N, Olival KJ, Fagbo SF, Kapoor V, Epstein JH, et al. Middle East respiratory syndrome coronavirus in bats, Saudi Arabia. Emerging infectious diseases. 2013;19(11):1819–23. 10.3201/eid1911.131172 - DOI - PMC - PubMed

Publication types

MeSH terms

LinkOut - more resources