. 2016 Apr;30(4):402-16.
doi: 10.1210/me.2015-1275. Epub 2016 Mar 1.

Nitric Oxide Exerts Basal and Insulin-Dependent Anorexigenic Actions in POMC Hypothalamic Neurons

Affiliations

Nitric Oxide Exerts Basal and Insulin-Dependent Anorexigenic Actions in POMC Hypothalamic Neurons

Leigh Wellhauser et al. Mol Endocrinol. 2016 Apr.

Abstract

The arcuate nucleus of the hypothalamus represents a key center for the control of appetite and feeding through the regulation of 2 key neuronal populations, notably agouti-related peptide/neuropeptide Y and proopimelanocortin (POMC)/cocaine- and amphetamine-regulated transcript neurons. Altered regulation of these neuronal networks, in particular the dysfunction of POMC neurons upon high-fat consumption, is a major pathogenic mechanism involved in the development of obesity and type 2 diabetes mellitus. Efforts are underway to preserve the integrity or enhance the functionality of POMC neurons in order to prevent or treat these metabolic diseases. Here, we report for the first time that the nitric oxide (NO(-)) donor, sodium nitroprusside (SNP) mediates anorexigenic actions in both hypothalamic tissue and hypothalamic-derived cell models by mediating the up-regulation of POMC levels. SNP increased POMC mRNA in a dose-dependent manner and enhanced α-melanocortin-secreting hormone production and secretion in mHypoA-POMC/GFP-2 cells. SNP also enhanced insulin-driven POMC expression likely by inhibiting the deacetylase activity of sirtuin 1. Furthermore, SNP enhanced insulin-dependent POMC expression, likely by reducing the transcriptional repression of Foxo1 on the POMC gene. Prolonged SNP exposure prevented the development of insulin resistance. Taken together, the NO(-) donor SNP enhances the anorexigenic potential of POMC neurons by promoting its transcriptional expression independent and in cooperation with insulin. Thus, increasing cellular NO(-) levels represents a hormone-independent method of promoting anorexigenic output from the existing POMC neuronal populations and may be advantageous in the fight against these prevalent disorders.


Figures

Figure 1.
Figure 1.. The NO donor, SNP up-regulates the anorexigenic POMC to AgRP ratio in hypothalamic tissues and cell models isolated and derived from mice.
The mRNA expression of hypothalamic neuropeptides upon SNP treatment of intact hypothalami ex vivo or cell lines in vitro was determined by qRT-PCR. Specifically, SNP up-regulated the anorexigenic ratio in mice hypothalamic tissue (H2O; 0.54 ± 0.04; SNP: 0.74 ± 0.06 POMC/AgRP + NPY, n = 4–5; P = .018) (A) or mouse cell models in vitro, including the mHypoA-NPY/GFP (H2O: 0.42 ± 0.04; SNP: 0.61 ± 0.03 POMC/AgRP, n = 8; P = .001) (B), GT1–7 (H2O: 0.69 ± 0.08; SNP: 1.09 ± 0.08 POMC/AgRP + NPY, n = 5–7; P = .007) (C), and mHypoA-POMC/GFP-2 (H2O: 0.65 ± 0.06; SNP: 1.64 ± 0.10 POMC/AgRP + NPY, n = 4; P = .0001) (D) lines.
Figure 2.
Figure 2.. The NO donor, SNP up-regulates POMC mRNA, αMSH production, and peptide secretion in the mHypoA-POMC/GFP-2 cell model.
Maximal up-regulation of POMC mRNA was observed upon exposure of mHypoA-POMC/GFP-2 cells with 100μM SNP for 4 hours relative to H2O (n = 3–8; P = .001) (A and B). C, The mRNA levels of POMC upon pretreatment with DRB (60μM, 1 h) followed by SNP (100μM, 4 h) were significantly greater than treatment with DRB and vehicle alone (H2O) (DRB/SNP: 0.99 ± 0.06, DRB/H2O: 0.66 ± 0.02 POMC/histone; n = 3–4; P = .03). D, Prolonged treatment of mHypoA-POMC/GFP-2 cells with SNP (100μM, 16 h) led to a significant up-regulation of the αMSH processing enzymes PC1/3 (H2O: 0.06 ± 0.02, SNP: 1.24 ± 0.44 PC1/3/histone; n = 4; P = .0002) and CPE (H2O: 0.99 ± 0.03, SNP: 1.16 ± 0.06 CPE/histone; n = 10–14; P = .018). E, Confocal images of mHypoA-POMC/GFP-2 cells with and without treatment with SNP (100μM, 16 h) and stained for αMSH (red) and nuclear DNA (blue) are shown. F, The level of αMSH protein was significantly enhanced upon SNP treatment relative to H2O alone (H2O: 5.0 ± 0.32 αMSH signal intensity; SNP: 10.8 ± 0.9; n = 20–26; P < .0001). G, SNP also induced αMSH secretion relative to H2O (1.02 ± 0.04 and 1.43 ± 0.1 and αMSH/total protein, respectively; n = 8–19; P = .004) and to comparable levels observed with insulin (10nM; 1.39 ± 0.06 αMSH/total protein; n = 16; P = .001) and KCl (60mM; 1.33 ± 0.07 αMSH/total protein; n = 18; P = .004).
Figure 3.
Figure 3.. SNP up-regulates POMC expression independent of GC/cGMP and dependent upon NO radical generation in the mHypoA-POMC/GFP-2 cell line.
A, The mHypoA-POMC/GFP-2 cell model was pretreated with the GC inhibitor ODQ (1μM or 10μM, 1 h) before SNP exposure (100μM, 4 h). The presence of ODQ at either concentration did not inhibit the SNP-dependent increase in POMC mRNA (n = 5–8). B, Treatment with increasing concentrations of 8-bromo-cGMP (75μM–300μM, 4 h) did not modulate POMC mRNA levels relative to H2O treatment alone (n = 6–11). C, Cotreatment of cells with SNP (100μM) and CPTIO (200μM) significantly enhanced the SNP-mediated effect on POMC mRNA relative to SNP or CPTIO alone (SNP/CPTIO: 1.39 ± 0.09 POMC/histone mRNA; SNP/H2O: 1.02 ± 0.04; CPTIO/H2O: 0.84 ± 0.08; n = 4–10). D, Cotreatment of cells with SNP and DTT (100μM) also enhanced the SNP-mediated effect on POMC mRNA relative to SNP or DTT (SNP/DTT: 1.21 ± 0.08 POMC/histone mRNA; SNP/H2O: 0.95 ± 0.03; DTT/H2O: 0.75 ± 0.07; n = 4–10).
Figure 4.
Figure 4.. SNP reduces SIRT1 mRNA expression and deacetylase activity in mHypoA-POMC/GFP-2 cells.
A, Treatment of mHypoA-POMC/GFP-2 cells with SNP (100μM, 4 h) led to a significant reduction in SIRT1 mRNA as shown by qRT-PCR (H2O: 1.38 ± 0.06 SIRT1/histone mRNA; 100μM: 0.75 ± 0.04; n = 4–8; P = .0001). B, No changes were detected in SIRT1 protein levels as shown by Western blotting (H2O: 0.78 ± 0.12 SIRT1/β-actin; SNP: 0.76 ± 0.10; n = 4). C, The deacetylase activity of SIRT1 was significantly reduced upon exposure to SNP (100μM, 4 h) (H2O: 22.4 ± 2.1; SNP: 8.7 ± 2.9 SIRT1 activity/expression; n = 4; P = .0087).
Figure 5.
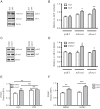
Figure 5.. SIRT1 inhibition enhances Foxo1 posttranslational modifications and POMC mRNA expression independent of PI3K phosphoinositide-3-kinase in mHypoA-POMC/GFP-2 cells.
Western blotting expression (A) and quantification (B) of AKT phosphorylation (pAKT), Foxo1 acetylation (AcFoxo1), and Foxo1 phosphorylation (pFoxo1) upon SNP treatment (100μM, 15 min). SNP enhances AcFoxo1 (H2O: 0.85 ± 0.04 AcFoxo1/β-actin; SNP: 1.04 ± 0.05; n = 5; P = .018) and pFoxo1 (H2O: 0.87 ± 0.03 pFoxo1/β-actin; SNP: 1.14 ± 0.06; n = 5; P = .004) relative to vehicle control. C and D, Pharmacological inhibition of SIRT1 using EX572 (20μM, 1 h) significantly up-regulated AcFoxo1 levels (H2O: 0.58 ± 0.06 AcFoxo1/β-actin; SNP: 0.84 ± 0.05; n = 3; P = .03) and pFoxo1 levels (H2O: 0.57 ± 0.02 pFoxo1/β-actin; SNP: 0.66 ± 0.01; n = 3; P = .01) relative to DMSO treatment alone. E, Cotreatment of SNP with EX527 failed to further enhance POMC mRNA expression relative to either treatment alone as shown by RT-PCR. F and G, Although Wortmannin pretreatment (1μM, 1 h) reduced pAKT, it did not impair the SNP-dependent increase in POMC mRNA.
Figure 6.
Figure 6.. SIRT1 inhibition by SNP enhances insulin-induced Foxo1 phosphorylation (pFoxo1) and POMC expression.
A and B, Pretreatment of mHypoA-POMC/GFP-2 cells with SNP (100μM, 1 h) before the addition of insulin (10nM, 15 min) significantly enhanced AKT phosphorylation (pAKT) and pFoxo1 as shown by Western blotting. C, Cotreatment of mHypoA-POMC/GFP-2 cells with insulin (10nM) and SNP (100μM) for 4 hours significantly up-regulated POMC mRNA relative to either treatment alone. D and E, Enhanced insulin-dependent changes in POMC mRNA in the presence of SNP were not due to changes in expression of the insulin receptor (Ins Rec) as shown by Western blotting (H2O: 1.79 ± 0.10 Ins Rec/β-actin; SNP: 1.88 ± 0.16; n = 3; P = .66). F, ChIP analysis of Foxo1 occupation of the POMC promoter indicating reduced and enhanced Foxo1 binding at 1 and 4 hours of SNP exposure, respectively (H2O: 0.009 ± 0.001; SNP 1 h: 0.003 ± 0.0006; SNP 4 h: 0.022 ± 0.008 signal relative to input; n = 3–11). H3+, histone 3a positive control.
Figure 7.
Figure 7.. Prolonged treatment with SNP prevented the onset of insulin (Ins) resistance in the mHypoA-POMC/GFP-2 cell model.
A and B, Western blottings and analysis of mHypoA-POMC/GFP-2 cells pretreated for 16 hours with H2O, Ins (100nM), SNP (100 μM), or Ins + SNP (100nM and 100μM, respectively) before an Ins challenge (10nM, 15 min). Pretreatment with H2O alone allowed for Ins to significantly increase AKT phosphorylation (pAKT) (H2O: 0.15 ± 0.03 pAKT/Total AKT; +Ins: 0.42 ± 0.03; n = 3; P = .004). Ins pretreatment abolished pAKT (Ins: 0.18 ± 0.02 pAKT/Total AKT; +Ins: 0.19 ± 0.07; n = 3; P = .890). SNP cotreatment with Ins (Ins + SNP) enabled the Ins-dependent increase in pAKT (SNP + Ins: 0.53 ± 0.07 pAKT/Total AKT; +Ins: 0.84 ± 0.02; n = 3; P = .014). C, Unlike in the Ins resistant state wherein a rechallenge with Ins failed to further increase POMC mRNA, cotreatment with SNP enabled the Ins-dependent enhancement in POMC mRNA (SNP + Ins: 1.16 ± 0.11 POMC/histone mRNA; + Ins: 1.68 ± 0.20; n = 4–6; P = .02). D–G, Prolonged treatment with SNP (100μM, 16 h) significantly enhanced SIRT1 mRNA and reduced SIRT1 protein expression but did not affect SIRT1 deactylase activity. H and I, SNP cotreatment failed to prevent the loss of Ins receptor (Ins Rec) expression upon chronic Ins treatment as shown by Western blotting (Ins + H2O: 0.22 ± 0.02 Ins Rec/β-actin; Ins + SNP: 0.16 ± 0.02; n = 3; P = .07).
Figure 8.
Figure 8.. Model of the multiple mechanisms NO donors may mediate satiety in hypothalamic POMC neurons.
Reduction of SIRT1 activity either through inhibitory modifications such as S-nitrosylation or a decrease in protein expression promotes Foxo1 acetylation and phosphorylation. These posttranslational modifications in Foxo1 promote its nuclear export and alleviation of the brake on POMC transcription enhancing basal expression of this neuropeptide, which is further encouraged by enhanced mRNA stability of its transcript. The presence of insulin further stimulates Foxo1 phosphorylation, amplifying the NO-dependent POMC effects. In addition, NO promotes the processing of POMC to αMSH by up-regulating the expression of PC1, PC3, and CPE and directly leads to its secretion and inhibition of feeding.

Similar articles

Cited by

References

    1. Belgardt BF, Brüning JC. CNS leptin and insulin action in the control of energy homeostasis. Ann NY Acad Sci. 2010;1212:97–113. - PubMed
    1. Thaler JP, Yi CX, Schur EA, et al. Obesity is associated with hypothalamic injury in rodents and humans. J Clin Invest. 2012;122:153–162. - PMC - PubMed
    1. Kaushik S, Arias E, Kwon H, et al. Loss of autophagy in hypothalamic POMC neurons impairs lipolysis. EMBO Rep. 2012;13:258–265. - PMC - PubMed
    1. Moraes JC, Coope A, Morari J, et al. High-fat diet induces apoptosis of hypothalamic neurons. PLoS One. 2009;4:e5045. - PMC - PubMed
    1. Brüning JC, Winnay J, Bonner-Weir S, Taylor SI, Accili D, Kahn CR. Development of a novel polygenic model of NIDDM in mice heterozygous for IR and IRS-1 null alleles. Cell. 1997;88:561–572. - PubMed

Publication types