

Absolute Quantification of the Host-To-Parasite DNA Ratio in Theileria parva-Infected Lymphocyte Cell Lines
- PMID: 26930209
- PMCID: PMC4773007
- DOI: 10.1371/journal.pone.0150401
Absolute Quantification of the Host-To-Parasite DNA Ratio in Theileria parva-Infected Lymphocyte Cell Lines
Abstract
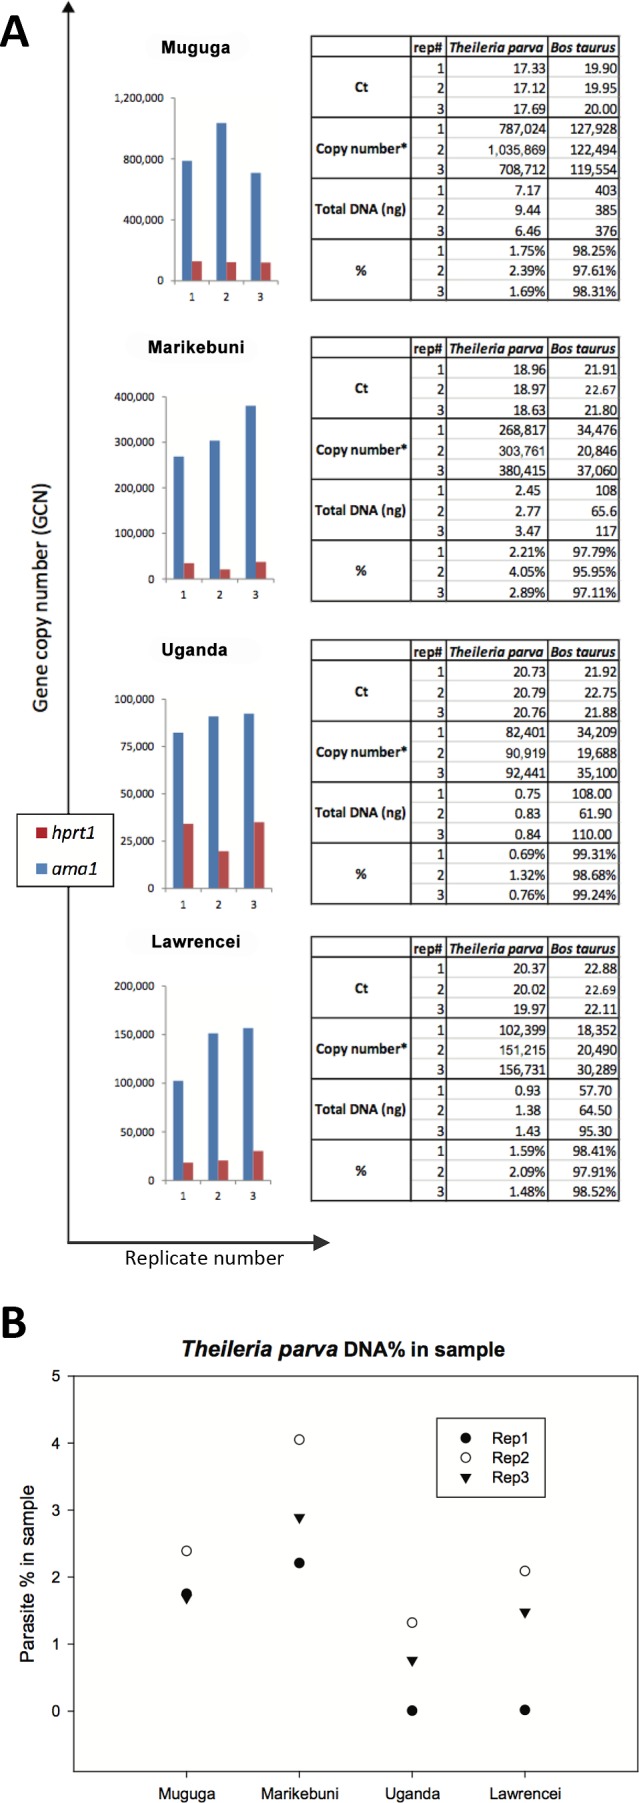
Theileria parva is a tick-transmitted intracellular apicomplexan pathogen of cattle in sub-Saharan Africa that causes East Coast fever (ECF). ECF is an acute fatal disease that kills over one million cattle annually, imposing a tremendous burden on African small-holder cattle farmers. The pathology and level of T. parva infections in its wildlife host, African buffalo (Syncerus caffer), and in cattle are distinct. We have developed an absolute quantification method based on quantitative PCR (qPCR) in which recombinant plasmids containing single copy genes specific to the parasite (apical membrane antigen 1 gene, ama1) or the host (hypoxanthine phosphoribosyltransferase 1, hprt1) are used as the quantification reference standards. Our study shows that T. parva and bovine cells are present in similar numbers in T. parva-infected lymphocyte cell lines and that consequently, due to its much smaller genome size, T. parva DNA comprises between 0.9% and 3% of the total DNA samples extracted from these lines. This absolute quantification assay of parasite and host genome copy number in a sample provides a simple and reliable method of assessing T. parva load in infected bovine lymphocytes, and is accurate over a wide range of host-to-parasite DNA ratios. Knowledge of the proportion of target DNA in a sample, as enabled by this method, is essential for efficient high-throughput genome sequencing applications for a variety of intracellular pathogens. This assay will also be very useful in future studies of interactions of distinct host-T. parva stocks and to fully characterize the dynamics of ECF infection in the field.
Conflict of interest statement
Figures


References
-
- Norval RAI, Perry BD, Young AS. The Epidemiology of Theileriosis in Africa. London, UK: Academic Press; 1992.
-
- Odongo DO, Ueti MW, Mwaura SN, Knowles DP, Bishop RP, Scoles GA. Quantification of Theileria parva in Rhipicephalus appendiculatus (Acari: Ixodidae) confirms differences in infection between selected tick strains. Journal of medical entomology. 2009;46(4):888–94. . - PubMed
-
- Medley GF, Perry BD, Young AS. Preliminary analysis of the transmission dynamics of Theileria parva in eastern Africa. Parasitology. 1993;106 (Pt 3):251–64. . - PubMed
-
- Leang R, Barrette A, Bouth DM, Menard D, Abdur R, Duong S, et al. Efficacy of Dihydroartemisinin-Piperaquine for Treatment of Uncomplicated Plasmodium falciparum and Plasmodium vivax in Cambodia, 2008 to 2010. Antimicrobial Agents and Chemotherapy. 2013;57(2):818–26. 10.1128/AAC.00686-12 - DOI - PMC - PubMed
Publication types
MeSH terms
Substances
LinkOut - more resources
Full Text Sources
Other Literature Sources
Miscellaneous
