. 2016 Mar 1;11(3):e0150268.
doi: 10.1371/journal.pone.0150268. eCollection 2016.

Seeing through Musculoskeletal Tissues: Improving In Situ Imaging of Bone and the Lacunar Canalicular System through Optical Clearing

Affiliations

Seeing through Musculoskeletal Tissues: Improving In Situ Imaging of Bone and the Lacunar Canalicular System through Optical Clearing

Ian M Berke et al. PLoS One. .

Abstract

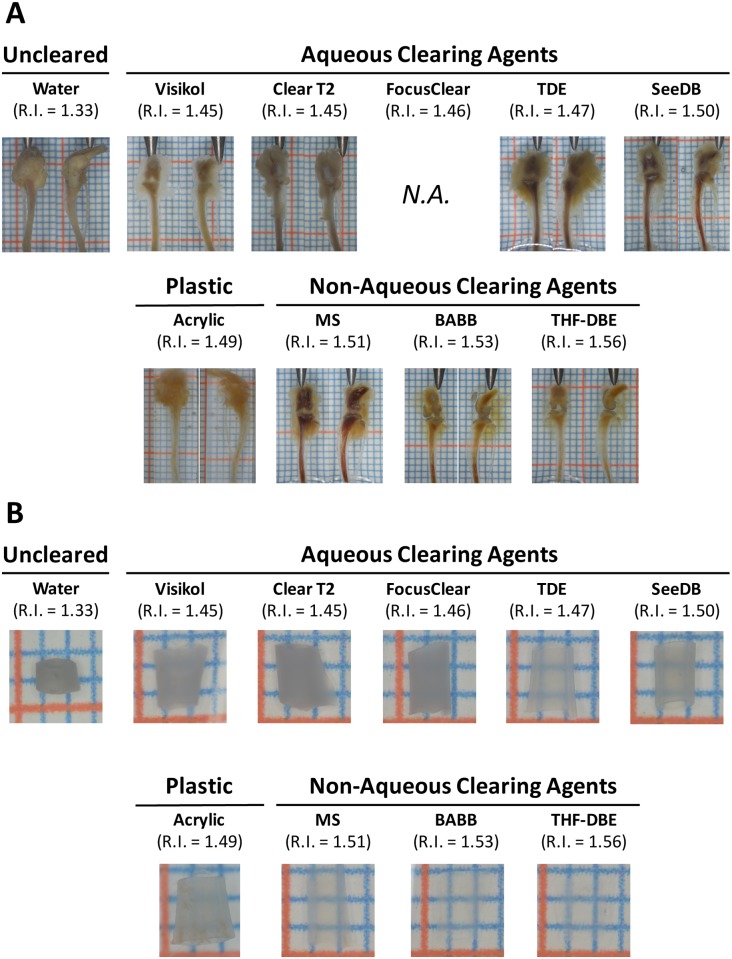
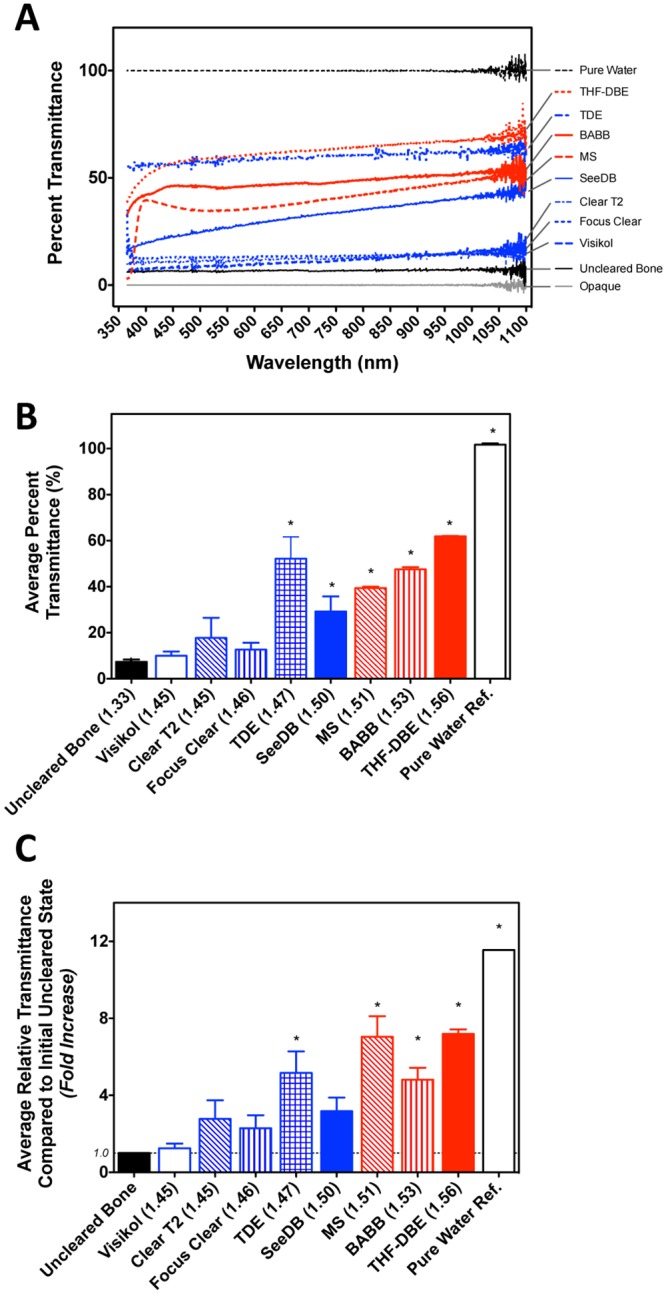
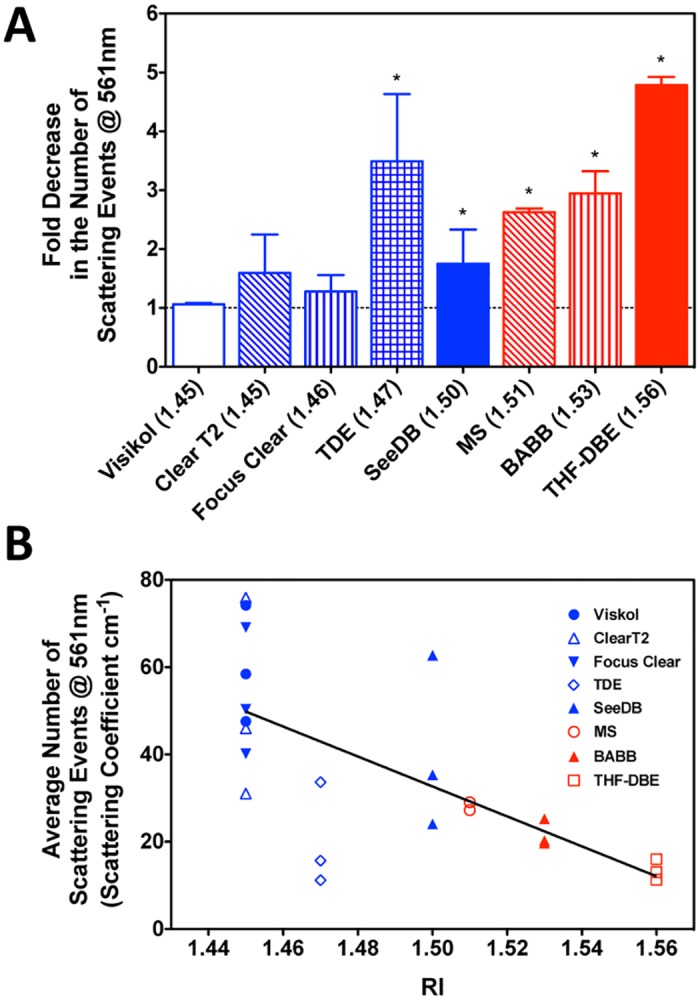
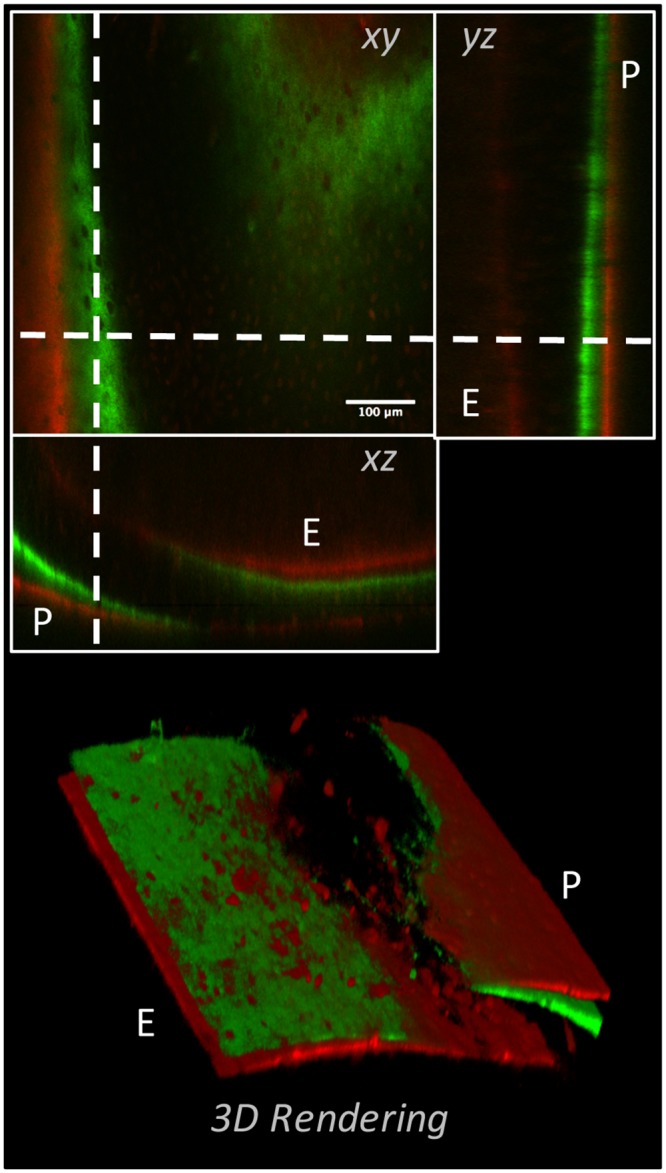
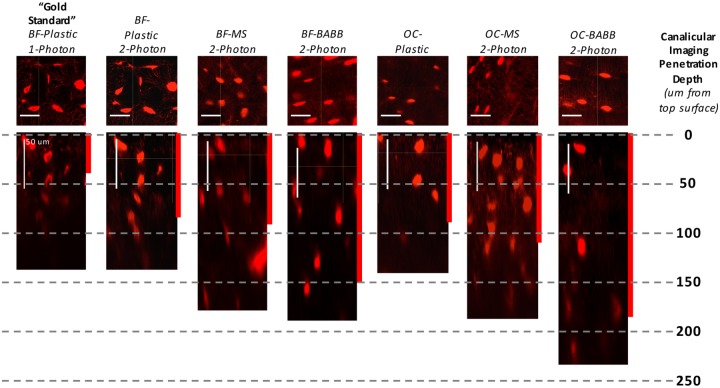
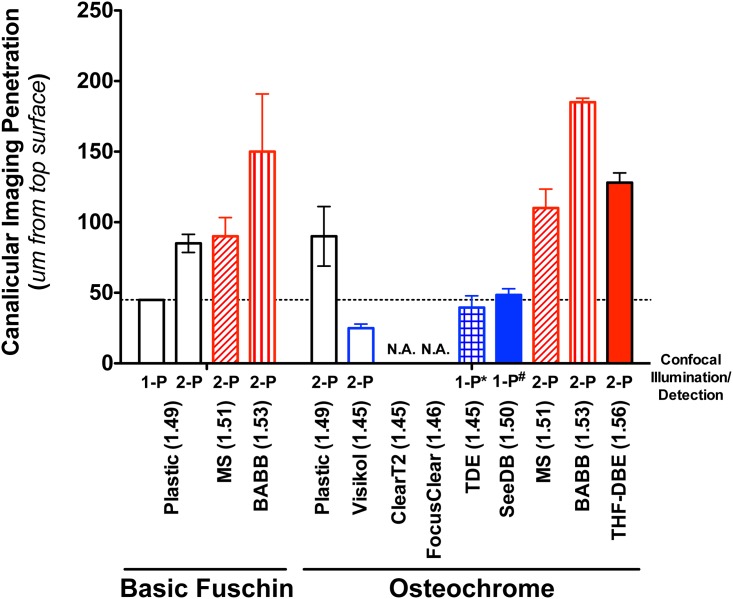
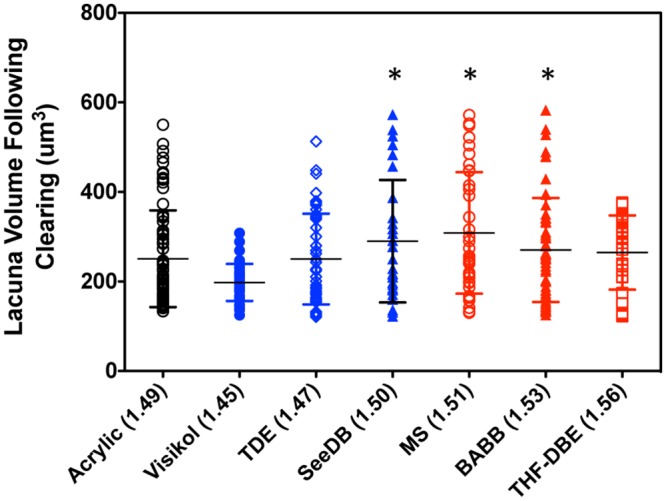
In situ, cells of the musculoskeletal system reside within complex and often interconnected 3-D environments. Key to better understanding how 3-D tissue and cellular environments regulate musculoskeletal physiology, homeostasis, and health is the use of robust methodologies for directly visualizing cell-cell and cell-matrix architecture in situ. However, the use of standard optical imaging techniques is often of limited utility in deep imaging of intact musculoskeletal tissues due to the highly scattering nature of biological tissues. Drawing inspiration from recent developments in the deep-tissue imaging field, we describe the application of immersion based optical clearing techniques, which utilize the principle of refractive index (RI) matching between the clearing/mounting media and tissue under observation, to improve the deep, in situ imaging of musculoskeletal tissues. To date, few optical clearing techniques have been applied specifically to musculoskeletal tissues, and a systematic comparison of the clearing ability of optical clearing agents in musculoskeletal tissues has yet to be fully demonstrated. In this study we tested the ability of eight different aqueous and non-aqueous clearing agents, with RIs ranging from 1.45 to 1.56, to optically clear murine knee joints and cortical bone. We demonstrated and quantified the ability of these optical clearing agents to clear musculoskeletal tissues and improve both macro- and micro-scale imaging of musculoskeletal tissue across several imaging modalities (stereomicroscopy, spectroscopy, and one-, and two-photon confocal microscopy) and investigational techniques (dynamic bone labeling and en bloc tissue staining). Based upon these findings we believe that optical clearing, in combination with advanced imaging techniques, has the potential to complement classical musculoskeletal analysis techniques; opening the door for improved in situ investigation and quantification of musculoskeletal tissues.


Conflict of interest statement

Competing Interests: The authors have declared that no competing interests exist.

Figures

Fig 1
Fig 1. Stereomicroscopic appearance of musculoskeletal tissues following optical clearing in either aqueous or non-aqueous clearing agents, or embedding in plastic.
A) Visual appearance of intact tibiofemoral joints following optical clearing. Non-aqueous clearing agents (MS, BABB, THF-DBE; RI > 1.51) resulted in the most appreciable clearing of musculoskeletal tissues, including muscle, connective tissue, cartilage, and bone. Scale bar indicates 2-mm; joints are shown in the anterior (left images) and lateral (right images) views. Focus Clear was not tested in intact knee joints. B) Visual inspection of cleansed, marrow flushed, and optically cleared mid-diaphyseal femoral bone segments. Clearing agents with RI > 1.47 demonstrated an appreciable ability to clear bone segments. Those agents with RI > 1.51 effectively rendered bone segments transparent. Scale bar indicates 1-mm.
Fig 2
Fig 2. Changes in the visible light transmittance properties of intact, cleansed bone segments following optical clearing.
A) Optical clearing agents increased the percentage of light (360–1090nm) that passed through cleansed mid-diaphyseal femoral bone segments compared to uncleared bone. For each clearing agent a representative individual transmittance spectral curve is shown. All data was normalized to that of the clearing agent relative to pure water. B.) Quantification of mean (broadband) light transmittance through bone segments following optical clearing. These data are derived from readings on three samples within each clearing agent group. Asterisks (*) indicate a significant difference from that of uncleared bone (one-way ANOVA, Tukey’s post hoc test, p<0.05; GraphPad Prism). C) Relative increase in light transmittance through murine bone segments following optical clearing. Asterisks (*) indicate a significant difference from no change in relative light transmittance (one sample t-test against a theoretical value of 1.0, p<0.05; GraphPad Prism). In each panel data are shown in order of increasing RI values, red denotes non-aqueous clearing procedures and blue indicates aqueous procedures.
Fig 3
Fig 3. Characterization of light scattering within intact, cleansed bone segments following optical clearing.
A) Fold decrease in the number of scattering events (at 561-nm) within murine bone segments following optical clearing. Asterisks (*) indicate a significant difference from no change in number of scattering events (one sample t-test against a theoretical value of 1.0, p<0.05; GraphPad Prism). Data are shown in order of increasing RI values, red denotes non-aqueous clearing procedures and blue indicates aqueous procedures. B) Relationship between the average number of scattering events predicted within cleared bone and the refractive index (RI) of the clearing/mounting agent. Linear regression y = -343.2*RI + 1.595, r2 = 0.457; GraphPad Prism).
Fig 4
Fig 4. 3-D representation of dynamically labeled cortical bone from an adolescent (8weeks of age) murine femur.
The left panel shows three orthogonal views of a modeling/growing region of cortex in the femoral diaphysis of an adolescent mouse that was administered calcein green (green) and alizarin red complexone (red) 13- and 3-days prior to sacrifice, respectively. Both double and single labeled surfaces could be observed on the periosteal (P) and endosteal (E) surfaces. The right panel shows a volume rendered representation of the same data, illustrating the ability to visualize both double and single labeled appositional fronts, as well as discrete regions of bone formation “nodules” throughout the cortex.
Fig 5
Fig 5. Visualization of bone’s 3-D lacunar canalicular system following non-aqueous optical clearing and mounting.
Results from the historical “gold-standard” technique of basic fuschin (BF) stained plastic embedded one-photon confocal microscopy are shown in the leftmost panel. Approximately 45-um of imaging penetration was achieved before canalicular detail was qualitatively lost in plastic embedded BF samples (shown by the red bar indicating “canalicular imaging penetration depth”). Results obtained following subsequent refinements in the en bloc imaging techniques that included optical clearing using MS or BABB, incorporation of two-photon microscopy, and the use of Villaneuva’s Osteochrome Bone Stain instead of BF, are shown in the panels to the right. The greatest improvements were achieved though the use of Osteochrome, BABB, and 2-P imaging. Similarly, with the “gold-standard” technique, visualization of lacunar details was restricted to ~50-um in depth due to optical “shadowing” within lacuna (compare the two leftmost panels). Optical clearing and 2-photon imaging also drastically improved the imaging of lacunar detail at depth.
Fig 6
Fig 6. Quantification of bone’s canalicular confocal imaging penetration following en bloc staining and optical clearing.
Non-aqueous clearing agents (MS, BABB, and THF-DBE) showed an appreciable ability to improve the visualization of fine canalicular detail (features on the order of 500 to 1000-nm in diameter) at depths 2 to 4-times that of the traditional “gold-standard” technique (plastic embedded 1-photon). Data represent the mean ± SD depth at which imaging of discrete canalicular structure is lost in stained, cleared, and imaged samples (n = 3–4 samples per clearing agent). 1-P indicates 1-photon imaging. 2-P indicates 2-photon imaging. ClearT2 and FocusClear were incompatible with Osteochrome staining, while TDE and SeeDB were incompatible with 2-photon imaging (*). Statistical analyses were not performed given the subjective nature of defining canalicular imaging penetration depth.
Fig 7
Fig 7. Quantification of effect of optical clearing on the volume of lacuna in Osteochrome stained bone segments.
Following Osteochrome staining and optical clearing the volume of bone lacuna, imaged via 1-photon microscopy, was quantified and compared to that of stained and acrylic (plastic) embedded samples (“gold-standard”). No of the lacunar volumes measured for the tested clearing agents differed significantly from the acrylic embedded samples. Data are shown via a dot plot, horizontal bars indicate mean ± S.D. Astericks (*) indicates the specified clearing agent groups are significantly different from the Visikol group.

References

    1. Buenzli PR, Sims NA. Quantifying the osteocyte network in the human skeleton. Bone. 2015;75: 144–150. 10.1016/j.bone.2015.02.016 - DOI - PubMed
    1. Gerstenfeld LC, McLean J, Healey DS, Stapleton SN, Silkman LJ, Price C, et al. Genetic variation in the structural pattern of osteoclast activity during post-natal growth of mouse femora. Bone. 2010;46: 1546–1554. 10.1016/j.bone.2010.02.016 - DOI - PubMed
    1. Sasazaki Y, Seedhom BB, Shore R. Morphology of the bovine chondrocyte and of its cytoskeleton in isolation and in situ: are chondrocytes ubiquitously paired through the entire layer of articular cartilage? Rheumatology. 2008;47: 1641–1646. 10.1093/rheumatology/ken341 - DOI - PubMed
    1. Mansour A, Abou-Ezzi G, Sitnicka E, Jacobsen SEW, Wakkach A, Blin-Wakkach C. Osteoclasts promote the formation of hematopoietic stem cell niches in the bone marrow. J Exp Med. 2012;209: 537–549. 10.1084/jem.20110994 - DOI - PMC - PubMed
    1. Amini S, Veilleux D, Villemure I. Three-dimensional in situ zonal morphology of viable growth plate chondrocytes: a confocal microscopy study. J Orthop Res. 2011;29: 710–717. 10.1002/jor.21294 - DOI - PubMed

Publication types

Substances