

Impaired Autophagy in Adult Bone Marrow CD34+ Cells of Patients with Aplastic Anemia: Possible Pathogenic Significance
- PMID: 26930650
- PMCID: PMC4773166
- DOI: 10.1371/journal.pone.0149586
Impaired Autophagy in Adult Bone Marrow CD34+ Cells of Patients with Aplastic Anemia: Possible Pathogenic Significance
Abstract
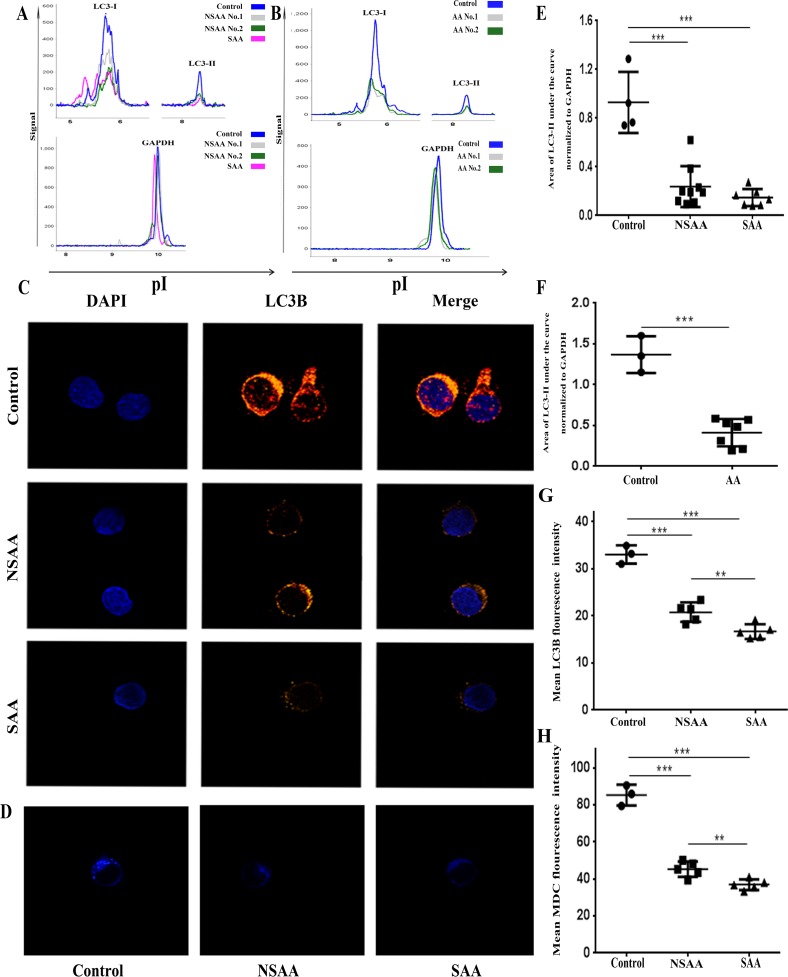
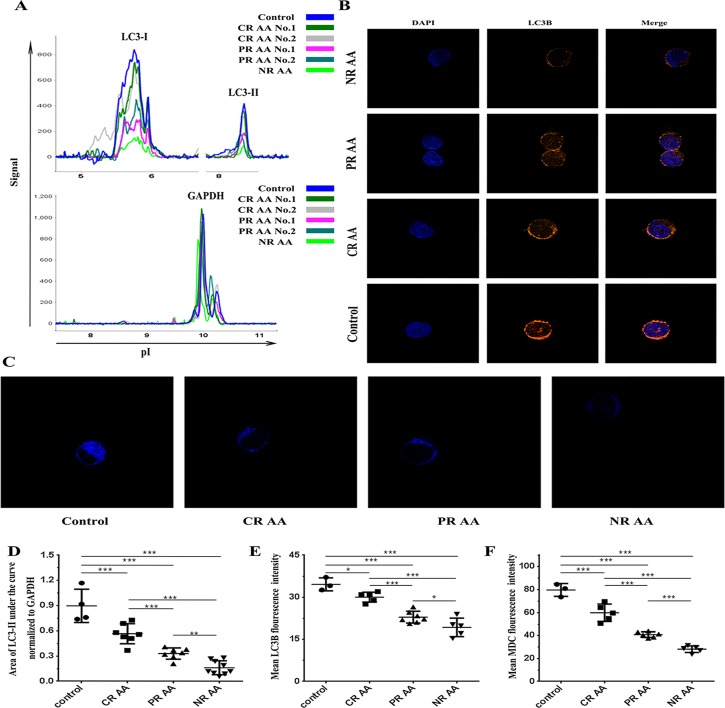
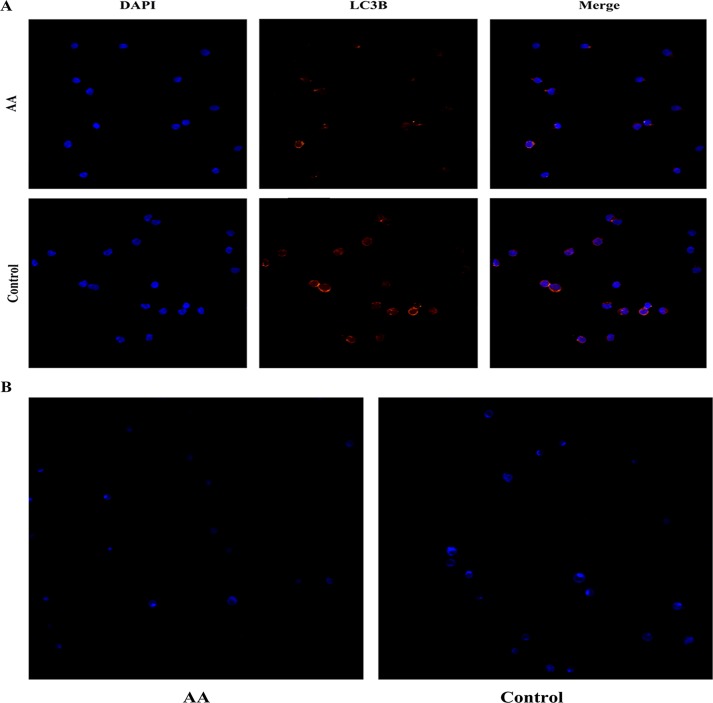
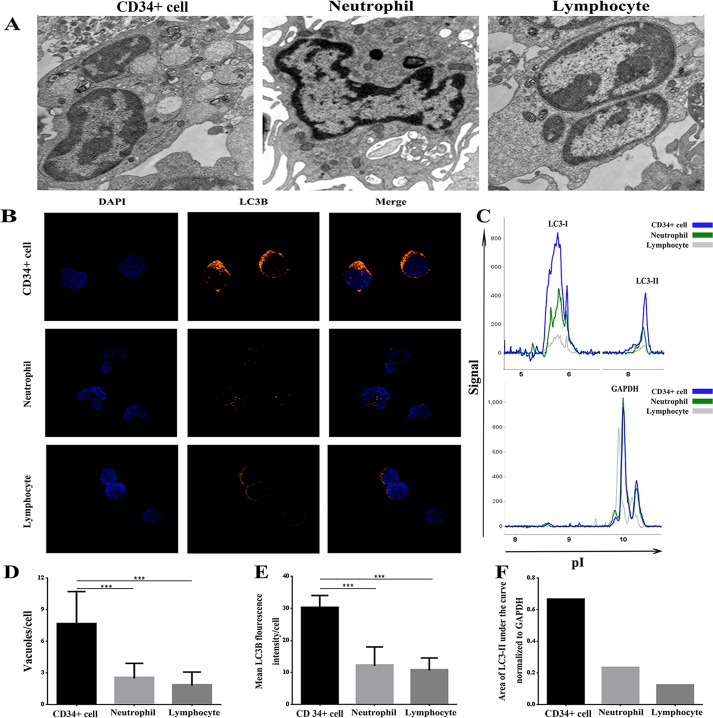
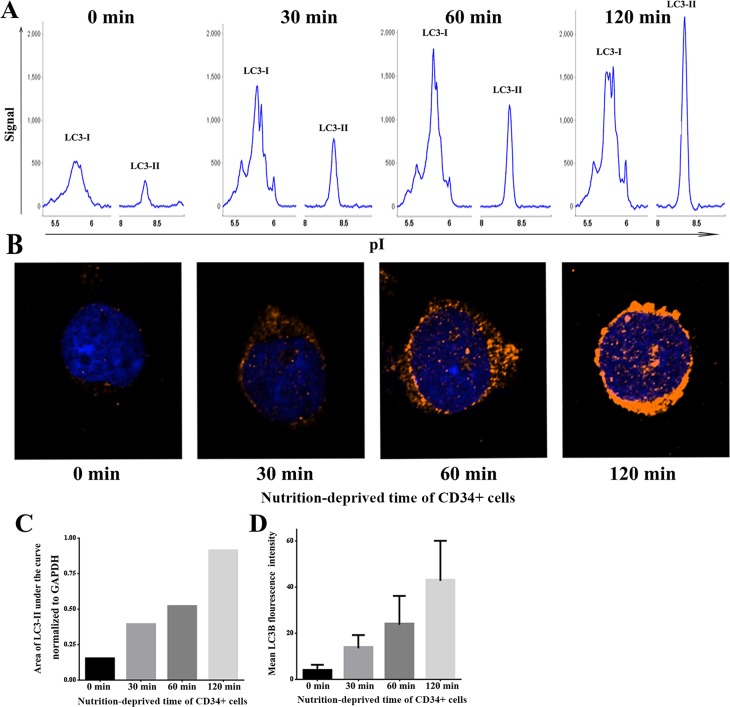
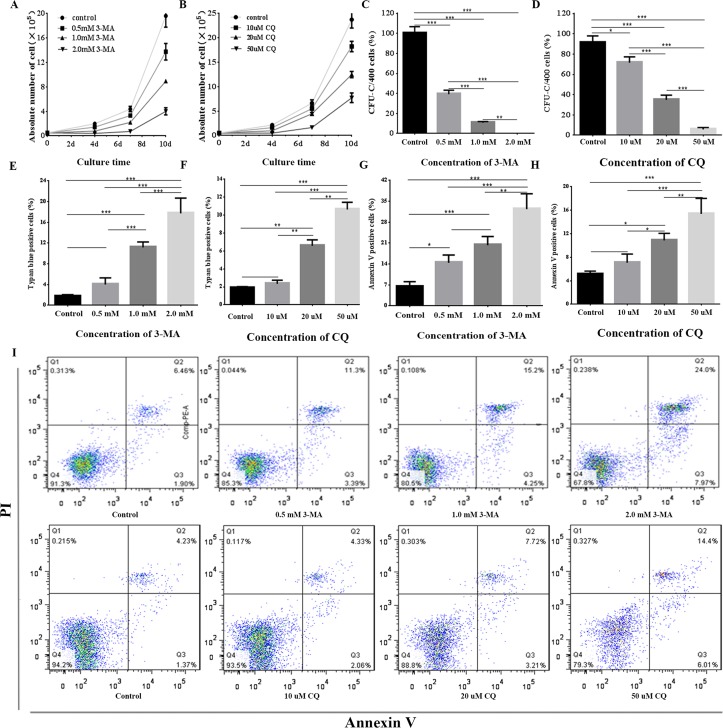
Aplastic anemia (AA) is a bone marrow failure syndrome that is caused largely by profound quantitative and qualitative defects of hematopoietic stem and progenitor cells. However, the mechanisms underlying these defects remain unclear. Under conditions of stress, autophagy acts as a protective mechanism for cells. We therefore postulated that autophagy in CD34+ hematopoietic progenitor cells (HPCs) from AA patients might be impaired and play a role in the pathogenesis of AA. To test this hypothesis, we tested autophagy in CD34+ cells from AA samples and healthy controls and investigated the effect of autophagy on the survival of adult human bone marrow CD34+ cells. We found that the level of autophagy in CD34+ cells from AA patients was significantly lower than in age/sex-matched healthy controls, and lower in cases of severe AA than in those with non-severe AA. Autophagy in CD34+ cells improved upon amelioration of AA but, compared to healthy controls, was still significantly reduced even in AA patients who had achieved a complete, long-term response. We also showed that although the basal autophagy in CD34+ cells was low, the autophagic response of CD34+ cells to "adversity" was rapid. Finally, impaired autophagy resulted in reduced differentiation and proliferation of CD34+ cells and sensitized them to death and apoptosis. Thus, our results confirm that autophagy in CD34+ cells from AA patients is impaired, that autophagy is required for the survival of CD34+ cells, and that impaired autophagy in CD34+ HPCs may play an important role in the pathogenesis of AA.
Conflict of interest statement
Figures
Similar articles
-
Deficiency of CD34+ c-kit+ and CD34+38- hematopoietic precursors in aplastic anemia after immunosuppressive treatment.Am J Hematol. 1996 Aug;52(4):264-74. doi: 10.1002/(SICI)1096-8652(199608)52:4<264::AID-AJH5>3.0.CO;2-Q. Am J Hematol. 1996. PMID: 8701944
-
[In vitro proliferation and differentiation of bone marrow stem cells of aplastic anemia patients].Zhonghua Xue Ye Xue Za Zhi. 1999 Oct;20(10):529-31. Zhonghua Xue Ye Xue Za Zhi. 1999. PMID: 11721400 Chinese.
-
Increased apoptosis in aplastic anemia bone marrow progenitor cells: possible pathophysiologic significance.Exp Hematol. 1995 Dec;23(14):1642-8. Exp Hematol. 1995. PMID: 8542959
-
Hematopoietic stem cells in aplastic anemia.Arch Med Res. 2003 Nov-Dec;34(6):520-7. doi: 10.1016/j.arcmed.2003.09.009. Arch Med Res. 2003. PMID: 14734092 Review.
-
Abnormal immunity and stem/progenitor cells in acquired aplastic anemia.Crit Rev Oncol Hematol. 2010 Aug;75(2):79-93. doi: 10.1016/j.critrevonc.2009.12.001. Epub 2009 Dec 31. Crit Rev Oncol Hematol. 2010. PMID: 20045349 Review.
Cited by
-
Autophagy in Disease Onset and Progression.Aging Dis. 2024 Aug 1;15(4):1646-1671. doi: 10.14336/AD.2023.0815. Aging Dis. 2024. PMID: 37962467 Free PMC article. Review.
-
Single-cell RNA Sequencing Reveals Novel Cellular Factors for Response to Immunosuppressive Therapy in Aplastic Anemia.Hemasphere. 2023 Oct 27;7(11):e977. doi: 10.1097/HS9.0000000000000977. eCollection 2023 Nov. Hemasphere. 2023. PMID: 37908861 Free PMC article.
-
Hematopoietic Stem Cell Regulation by Type I and II Interferons in the Pathogenesis of Acquired Aplastic Anemia.Front Immunol. 2016 Aug 29;7:330. doi: 10.3389/fimmu.2016.00330. eCollection 2016. Front Immunol. 2016. PMID: 27621733 Free PMC article. Review.
-
Acquired Aplastic Anemia as a Clonal Disorder of Hematopoietic Stem Cells.Stem Cell Rev Rep. 2020 Jun;16(3):472-481. doi: 10.1007/s12015-020-09971-y. Stem Cell Rev Rep. 2020. PMID: 32270433 Free PMC article. Review.
-
Megakaryocytic dysfunction in immune thrombocytopenia is linked to autophagy.Cancer Cell Int. 2019 Mar 15;19:59. doi: 10.1186/s12935-019-0779-0. eCollection 2019. Cancer Cell Int. 2019. PMID: 30923461 Free PMC article. Review.
References
-
- Scopes J, Bagnara M, Gordon-Smith EC, Ball SE, Gibson FM. Haemopoietic progenitor cells are reduced in aplastic anaemia. Br J Haematol.1994; 86:427–430. - PubMed
-
- Marsh CJW, Chang J, Testa NG, Hows JM, Dexter TM. The hematopoietic defects in aplastic anemia assessed by long-term marrow culture. Blood.1990; 76:1748–1757. - PubMed
-
- Maciejewski JP, Selleri C, Sato T, Anderson S, Young NS. A severe and consistent deficit in marrow and circulating primitive hematopoietic cells (long-term culture-initiating cells) in acquired aplastic anemia. Blood.1996; 88:1983–1991. - PubMed
-
- Manz CY, Nissen C, Wodnar-Filipowicz A. Deficiency of CD34+c-kit+ and CD34+38- hematopoietic precursors in aplastic anemia after immunosuppressive treatment. Am J Hematol.1996; 52:264–274. - PubMed
-
- Maciejewski JP, Kim S, Sloand E, Selleri C, Young NS. Sustained long-term hematologic recovery despite a marked quantitative defect in the stem cell compartment of patients with aplastic anemia after immunosuppressive therapy. Am J Hematol. 2000; 65:123–131. - PubMed
MeSH terms
Substances
LinkOut - more resources
Full Text Sources
Other Literature Sources
Medical
