Characterization of an extensive rainbow trout miRNA transcriptome by next generation sequencing
- PMID: 26931235
- PMCID: PMC4774146
- DOI: 10.1186/s12864-016-2505-9
Characterization of an extensive rainbow trout miRNA transcriptome by next generation sequencing
Abstract
Background: MicroRNAs (miRNAs) have emerged as important post-transcriptional regulators of gene expression in a wide variety of physiological processes. They can control both temporal and spatial gene expression and are believed to regulate 30 to 70% of the genes. Data are however limited for fish species, with only 9 out of the 30,000 fish species present in miRBase. The aim of the current study was to discover and characterize rainbow trout (Oncorhynchus mykiss) miRNAs in a large number of tissues using next-generation sequencing in order to provide an extensive repertoire of rainbow trout miRNAs.
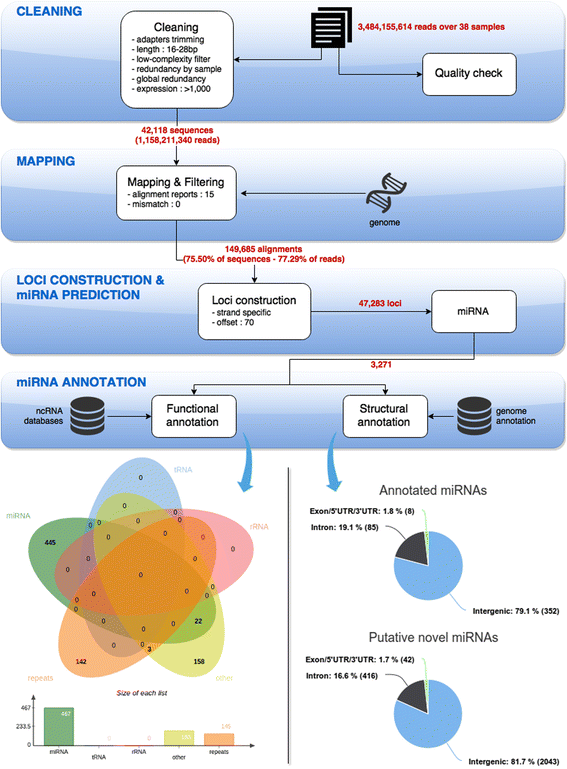
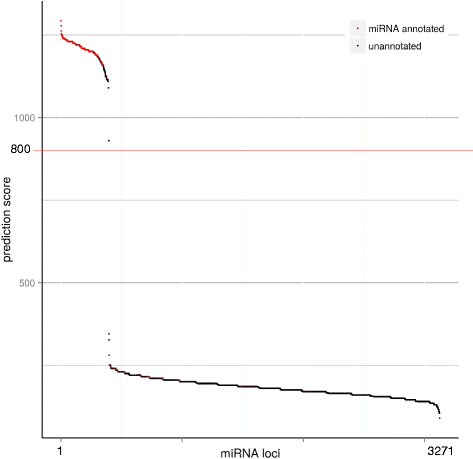
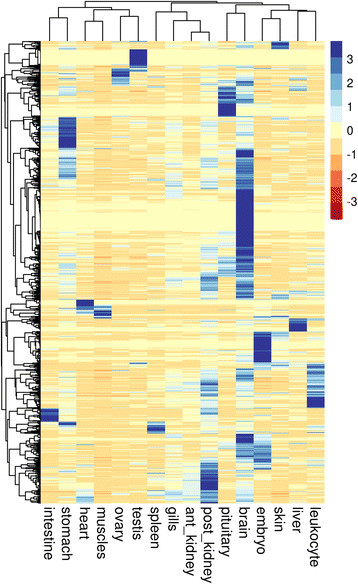
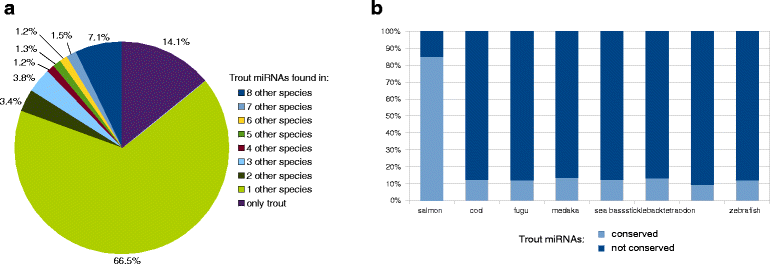
Results: A total of 38 different samples corresponding to 16 different tissues or organs were individually sequenced and analyzed independently in order to identify a large number of miRNAs with high confidence. This led to the identification of 2946 miRNA loci in the rainbow trout genome, including 445 already known miRNAs. Differential expression analysis was performed in order to identify miRNAs exhibiting specific or preferential expression among the 16 analyzed tissues. In most cases, miRNAs exhibit a specific pattern of expression in only a few tissues. The expression data from sRNA sequencing were confirmed by RT-qPCR. In addition, novel miRNAs are described in rainbow trout that had not been previously reported in other species.
Conclusion: This study represents the first characterization of rainbow trout miRNA transcriptome from a wide variety of tissue and sets an extensive repertoire of rainbow trout miRNAs. It provides a starting point for future studies aimed at understanding the roles of miRNAs in major physiological process such as growth, reproduction or adaptation to stress. These rainbow trout miRNAs repertoire provide a novel resource to advance genomic research in salmonid species.
Figures


Similar articles
-
High-throughput sequencing reveals microRNAs in response to heat stress in the head kidney of rainbow trout (Oncorhynchus mykiss).Funct Integr Genomics. 2019 Sep;19(5):775-786. doi: 10.1007/s10142-019-00682-3. Epub 2019 May 10. Funct Integr Genomics. 2019. PMID: 31076931
-
MicroTrout: A comprehensive, genome-wide miRNA target prediction framework for rainbow trout, Oncorhynchus mykiss.Comp Biochem Physiol Part D Genomics Proteomics. 2016 Dec;20:19-26. doi: 10.1016/j.cbd.2016.07.002. Epub 2016 Jul 28. Comp Biochem Physiol Part D Genomics Proteomics. 2016. PMID: 27494513
-
A bioinformatics-based update on microRNAs and their targets in rainbow trout (Oncorhynchus mykiss).Gene. 2014 Jan 1;533(1):261-9. doi: 10.1016/j.gene.2013.09.060. Epub 2013 Sep 21. Gene. 2014. PMID: 24064144
-
Molecular characterization of the prolactin receptor in two fish species, tilapia Oreochromis niloticus and rainbow trout, Oncorhynchus mykiss: a comparative approach.Can J Physiol Pharmacol. 2000 Dec;78(12):1086-96. Can J Physiol Pharmacol. 2000. PMID: 11149385 Review.
-
Characterization of free fatty acid receptor family in rainbow trout (Oncorhynchus mykiss): towards a better understanding of their involvement in fatty acid signalisation.BMC Genomics. 2023 Mar 20;24(1):130. doi: 10.1186/s12864-023-09181-z. BMC Genomics. 2023. PMID: 36941594 Free PMC article. Review.
Cited by
-
Weighted Single-Step GWAS Identifies Genes Influencing Fillet Color in Rainbow Trout.Genes (Basel). 2022 Jul 26;13(8):1331. doi: 10.3390/genes13081331. Genes (Basel). 2022. PMID: 35893068 Free PMC article.
-
High-throughput sequencing reveals microRNAs in response to heat stress in the head kidney of rainbow trout (Oncorhynchus mykiss).Funct Integr Genomics. 2019 Sep;19(5):775-786. doi: 10.1007/s10142-019-00682-3. Epub 2019 May 10. Funct Integr Genomics. 2019. PMID: 31076931
-
Epigenetic considerations in aquaculture.PeerJ. 2017 Dec 7;5:e4147. doi: 10.7717/peerj.4147. eCollection 2017. PeerJ. 2017. PMID: 29230373 Free PMC article.
-
Dietary methionine restriction: Effects on glucose tolerance, lipid content and micro-RNA composition in the muscle of rainbow trout.Comp Biochem Physiol C Toxicol Pharmacol. 2018 Jun;208:47-52. doi: 10.1016/j.cbpc.2017.10.012. Epub 2017 Oct 31. Comp Biochem Physiol C Toxicol Pharmacol. 2018. PMID: 29100953 Free PMC article.
-
Differentially Expressed miRNAs and mRNAs in Regenerated Scales of Rainbow Trout (Oncorhynchus mykiss) under Salinity Acclimation.Animals (Basel). 2022 May 14;12(10):1265. doi: 10.3390/ani12101265. Animals (Basel). 2022. PMID: 35625112 Free PMC article.
References
Publication types
MeSH terms
Substances
LinkOut - more resources
Full Text Sources
Other Literature Sources

