. 2016 May 15;25(10):1946-1964.
doi: 10.1093/hmg/ddw067. Epub 2016 Feb 29.

Drosophila clueless is involved in Parkin-dependent mitophagy by promoting VCP-mediated Marf degradation

Affiliations

Drosophila clueless is involved in Parkin-dependent mitophagy by promoting VCP-mediated Marf degradation

Zong-Heng Wang et al. Hum Mol Genet. .

Erratum in

Abstract

PINK1/Parkin-mediated mitochondrial quality control (MQC) requires valosin-containing protein (VCP)-dependent Mitofusin/Marf degradation to prevent damaged organelles from fusing with the healthy mitochondrial pool, facilitating mitochondrial clearance by autophagy. Drosophila clueless (clu) was found to interact genetically with PINK1 and parkin to regulate mitochondrial clustering in germ cells. However, whether Clu acts in MQC has not been investigated. Here, we show that overexpression of Drosophila Clu complements PINK1, but not parkin, mutant muscles. Loss of clu leads to the recruitment of Parkin, VCP/p97, p62/Ref(2)P and Atg8a to depolarized swollen mitochondria. However, clearance of damaged mitochondria is impeded. This paradox is resolved by the findings that excessive mitochondrial fission or inhibition of fusion alleviates mitochondrial defects and impaired mitophagy caused by clu depletion. Furthermore, Clu is upstream of and binds to VCP in vivo and promotes VCP-dependent Marf degradation in vitro Marf accumulates in whole muscle lysates of clu-deficient flies and is destabilized upon Clu overexpression. Thus, Clu is essential for mitochondrial homeostasis and functions in concert with Parkin and VCP for Marf degradation to promote damaged mitochondrial clearance.


Figures

Figure 1.
Figure 1.
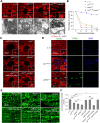
clu genetically interacts with parkin and OE of Clu partially rescues PINK1, but not parkin mutants. (A) Upper panel: ventral-lateral (VL) muscles from L3 larva of the indicated genotypes stained with anti-ATPase 5α. Lower panel: TEM images of mitochondria in L3 larval muscles. Arrows indicate mitochondrial cristae and asterisks show swollen regions of the mitochondrial matrix. (B) Lethality curves of clu mutants, parkin mutants or clu; parkin double mutants throughout development. L1, 1st instar larva; L2, 2nd instar larva; L3, 3rd instar larva; A, adults. n = 100 for each genotype. (C) VL muscles from larva of the indicated genotypes stained with anti-ATPase 5α. Arrows in insets indicate clustered mitochondria. (D) Adult IFMs from control flies, clu mutants or parkin mutants stained with anti-ATPase 5α (red), TUNEL (green) and DAPI (blue). The insets show a magnified area in each image and single mitochondria are highlighted with arrows. (E) Adult IFMs of the indicated genotypes stained with anti-ATPase 5α. Dotted circles outline a single mitochondrion. Single mitochondrion is outlined by a dotted line for (A)–(E). (F) Quantification of larval mobility in clu mutants, parkin mutants clu; parkin double mutants or Clu OE. n = 15–20 larvae for each genotype. Mean ± s.e.m. (n.s., not significant, *P < 0.05, ***P < 0.001). Scale bars are indicated.
Figure 2.
Figure 2.
Overexpression of PINK1 or Parkin rescues defects caused by clu knockdown. (A) LacZ, PINK1, Parkin, Catalase, SOD1 or SOD2 were overexpressed in adult IFMs in either luciferase RNAi (control) or a clu RNAi background. Single mitochondrion is circled (dotted line). (B and C) Quantification and comparison of larval mobility (n = 10–15 larvae for each genotype) and adult eclosion (n = 90–120 total pupae for each genotype) of the indicated genotypes. Asterisks and n.s. (not significant) indicate comparisons between PINK1, Parkin, Catalase, SOD1 or SOD2 OE and the LacZ OE controls from either a luciferase RNAi or a clu RNAi background, whereas diamonds indicate the comparisons between LacZ OE in clu RNAi flies compared with LacZ OE in the luciferase RNAi flies. (D) IFMs from adults of LacZ, PINK1 or Parkin OE in a luciferase RNAi or clu RNAi background stained with JC-1 dye to show the Ψm. Green monomers stain all mitochondria, while red polymers are formed in polarized mitochondria (n = 5 adult thoraces for each genotype). (E) Quantification of normalized red/green fluorescence. Mean ± s.e.m. (n.s., not significant, **P < 0.01, *** or ♦♦♦P < 0.001). Scale bars are indicated.
Figure 3.
Figure 3.
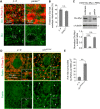
Clu protein localization is altered in parkin mutants and vice versa. (A) Larval muscles from control (y, w) or parkin mutants stained with anti-ATPase 5α (red) or anti-Clu (green). Arrows show that Clu is in close vicinity or overlapping to mitochondria. Single mitochondrion is outlined by a dotted line. (B) Quantification of the percentage of Clu staining overlapping mitochondria (n = 6 larvae for each genotype). (C) Whole larval lysates in the indicated mutants immunoblotted with anti-Myc to detect Clu (n = 3 experiments) protein levels. Protein levels were normalized to the levels of α-tubulin. (D) Confocal sections show muscles from y, w or clu mutant larva stained with anti-Parkin and anti-ATPase 5α. Arrows show mitochondria surrounded by Parkin. (E) Quantification of the number of mitochondria surrounded by Parkin per 6000 μm2 muscles. Mean ± s.e.m. (**P < 0.01, ***P < 0.001). Scale bars are indicated.
Figure 4.
Figure 4.
Depletion of Clu induces mitochondrial translocation of proteins required for mitophagy, but mitochondrial clearance is impeded. (A) S2 cells were treated with the indicated dsRNAs for 48 h before transfection with Parkin-YFP (green) for an additional 16 h. The cells were treated with DMSO or 20 μm CCCP, harvested after 0, 2 or 24 h, and immunostained with anti-ATPase 5α (red). Arrows indicate mitochondrial localized Parkin-YFP after DMSO or 20 μm CCCP treatment for 0 and 2 h, or presence of mitochondria after treatment for 24 h. (BD) The extent of mitochondrial clustering (B), mitochondrial translocation of Parkin-YFP (C) and mitophagy (D) were quantified for the experiments described in A (n > 100 cells in each condition). Mean ± s.e.m. (*P < 0.05, **P < 0.01, ***P < 0.001). Scale bars are indicated.
Figure 5.
Figure 5.
Loss of Clu results in autophagosome recruitment to damaged mitochondria, but failure to engulf the whole enlarged mitochondria for clearance in vivo. (A and B) Whole larval lysates of y, w, clu, parkin or clu; parkin mutants were subjected to SDS–PAGE and immunoblotted using anti-p62 (A), anti-Atg8a (B) or anti-α-tubulin. Quantifications of p62 or Atg8 levels were normalized to α-tubulin (n = 3 experiments). (C) Single confocal images show the localization of mCherry-Atg8a (green) and anti-p62 (purple) in relation to mitochondria (mito-GFP, red) upon RNAi knockdown of clu, parkin or both, in larval VL muscles. Mitochondria decorated with or without mCherry-Atg8a or p62 are indicated by arrows or arrowheads, respectively. Note that mCherry-Atg8a in clu RNAi muscles fails to envelop the entire/swollen mitochondria. (DE) Quantifications of mCherry-Atg8a (D) or p62 (E) localized to mitochondria in muscles of the indicated genotypes using the ‘colocalization’ plugin in ImageJ (n = 6 larvae for each genotype). Mean ± s.e.m. (*P < 0.05, **P < 0.01). Scale bars are indicated.
Figure 6.
Figure 6.
clu genetically interacts with mitochondrial fission/fusion genes and promotion of mitochondrial fission rescues defects caused by loss of Clu. (A and B) Adult IFMs of the indicated genotypes were stained with anti-ATPase 5α (green). (C and D) Quantification of larval mobility (n = 15 larvae for each genotype) and adult eclosion (n = 100–120 total pupae for each genotype) upon manipulating Marf or Drp1 levels in luciferase or clu RNAi backgrounds. (E) The localization of mCherry-Atg8a (green) and anti-p62 (purple) were examined in relation to mitochondria (mito-GFP, red) in cluRNAi, cluRNAi; Drp1OE or cluRNAi; marfRNAi larval VL muscles. Arrows show mitochondria decorated with or without mCherry-Atg8a or p62. Note that mCherry-Atg8a in clu RNAi muscles fails to en­­velop the swollen mitochondria, while it surrounds a portion of fragmented mitochondria in cluRNAi; Drp1OE or cluRNAi; marf RNAi muscles. (FG) Quantifications of mitochondrial-localized mCherry-Atg8a or p62 in muscles of the indicated genotypes (n = 6 larvae for each genotype). Single mitochondrion is outlined with a dotted line in A, B and E. Mean ± s.e.m. (n.s., not significant, *P < 0.05, **P < 0.01, ***P < 0.001). Scale bars are indicated.
Figure 7.
Figure 7.
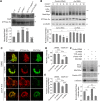
Loss of Clu impairs Marf degradation. (A) Whole larval lysates of the indicated mutants immunoblotted with anti-Marf. Protein levels were normalized to the levels of ATPase 5α. (n = 4 experiments). (B) S2 cells were treated with either control or clu dsRNA for 2 h and again at 48 h before transfection with Marf-Myc. After expression for 36 h, cells were incubated with DMSO or 20 μm CCCP for the indicated time. Whole cell lysates were collected and subjected to SDS–PAGE, followed by immunoblotting using anti-Myc, anti-ATPase 5α and anti-α-tubulin. The levels of Marf-Myc were quantified by normalizing to ATPase 5α protein levels. Statistics show comparison between 0 h CCCP treatment and other time points in the same dsRNA treated cells (n = 3 experiments). (C) S2 cells treated with indicated dsRNAs were incubated with DMSO or 20 μm CCCP for 10 h, then immunostained with anti-Myc (green) and anti-ATPase 5α (red). (D and E) The intensity of Marf-Myc (D) or the overlap between Marf-Myc and mitochondria (E) are shown (n = 20 cells for each condition). (F) S2 cells treated with either control or clu dsRNA were transfected with Parkin-YFP or the YFP vector alone. After 36 h, the cells were harvested. Whole cell lysates were subjected to SDS–PAGE, followed by immunoblotting using anti-YFP, anti-Myc or anti-α-tubulin. The levels of Marf-Myc were normalized to α-tubulin and are presented in the graph below (n = 5 experiments). Mean ± s.e.m. (n.s., not significant, *P < 0.05, **P < 0.01, ***P < 0.001). Scale bars are indicated.
Figure 8.
Figure 8.
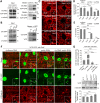
Clu binds to and is upstream of VCP and knockdown of Clu leads to accumulation of VCP on mitochondria. (A) Lysates were collected from whole larva with GFP-tagged endogenous VCP also expressing Myc-tagged Clu under control of the muscle driver, mef2-Gal4. Either Myc or GFP antisera was added to IP protein complexes, while control IPs contained no antibody. The resulting protein complexes were subjected to SDS–PAGE and immunoblotted using anti-Myc or anti-GFP. (B) Lysates were collected from y, w or Clu GFP larvae. Anti-GFP beads were added to both lysates for IPs. The resulting protein complexes were subjected to SDS–PAGE and immunoblotted using anti-VCP or anti-GFP. (C) Larval VL muscles of the indicated genotypes were stained with anti-ATPase 5α (red). Arrows point out a single mitochondrion (inset). (D and E) Quantification and comparison of larval mobility (n = 15 larvae for each genotype) and adult eclosion (n = 100–110 total pupae for each genotype) upon VCP OE in control (luciferase RNAi) or clu knockdown (clu RNAi) and Clu OE in a vcp RNAi background. (F) Larval VL muscles of indicated RNAi stained with anti-ATPase 5α (red). Arrows illustrate mitochondria decorated with VCP-GFP (green). (G) Quantifications of VCP-GFP surrounded mitochondria (n = 6 larvae for each genotype). (H) Whole larval lysates in the indicated mutants were immunoblotted with anti-VCP and anti-α-tubulin to detect VCP protein levels (n= 3 experiments). Mean ± s.e.m. (n.s., not significant, *P < 0.05, ***P < 0.001). Scale bars are indicated.
Figure 9.
Figure 9.
Clu is involved in VCP-mediated ubiquitinated-Marf degradation. (A) Larval muscles with GFP-tagged endogenous VCP expression and indicated genotypes were immunostained with anti-Ubiquitin and anti-ATPase 5α. (B and C) Single confocal images in (A) were used to draw a line on mitochondria to calculate fluorescence intensity of mitochondria, ubiquitin and VCP-GFP by the ‘linear profile’ macro in ImageJ. (D) S2 cells treated with either control or clu dsRNA were transfected with VCP-FLAG or the FLAG vector alone. After 36 h, the cells were harvested. Whole cell lysates were subjected to SDS–PAGE, followed by immunoblotting using anti-FLAG, anti-Myc or anti-α-tubulin. The levels of Marf-Myc normalized to α-tubulin are presented in the graph below (n = 5 experiments). (E) S2 cells treated with indicated dsRNA were transfected with Marf-Myc, followed by 20 μm CCCP treatment for 0, 4 or 10 h. Whole cell lysates were incubated with anti-Myc beads. IP complexes were detected using antibodies against Marf, Ubiquitin or VCP. (F) The levels of ubiquitinated-Marf to α-tubulin were quantified. Asterisks indicate non-specific bands (n = 4 experiments). Mean ± s.e.m. (n.s., not significant, *P < 0.05, **P < 0.01, ***P < 0.001). Scale bars are indicated.
Figure 10.
Figure 10.
A model for Clu-mediated mitochondrial morphology and Marf degradation through VCP. (A) In WT cells, healthy mitochondria undergo membrane remodeling through repeated rounds of fission and fusion events. The normal targeting of PINK1 (green) to mitochondria is cleaved to prevent protein accumulation. Upon membrane depolarization, the cleavage of PINK1 is inhibited, accumulates on the mitochondrial outer membrane and recruits cytosolic Parkin (blue) to mitochondria. Marf (yellow) is ubiquitinated by Parkin and is extracted from the membrane by VCP/ p97 (light green) for subsequent proteasomal degradation. Our data show that Clu (pink) physically interacts with VCP and promotes efficient Marf turnover. Damaged mitochondria that lack Marf are fusion defective and cannot enter the healthy mitochondrial pool. Parkin-dependent polyubiquitation of outer mitochondrial membrane recruits p62, which links defective mitochondria to the autophagosome for mitophagy. (B) Clu deficiency results in mitochondrial depolarization. As in WT cells, these damaged mitochondria accumulate high levels of Ub-Marf. VCP is recruited to mitochondria, but VCP-mediated Marf degradation by the proteasome is reduced in the absence of Clu. The accumulation of Marf protein impairs fission and leads to enlarged mitochondria that cannot be engulfed by the autophagosome for mitophagy, even though p62 and Atg8a are present. The promotion of mitochondrial fragmentation restores the clearance of damaged organelles.

Similar articles

Cited by

References

    1. Dodson M.W., Guo M. (2007) Pink1, Parkin, DJ-1 and mitochondrial dysfunction in Parkinson's disease. Curr. Opin. Neurobiol., 17, 331–337. - PubMed
    1. Burke W.J. (2002) Recent advances in the genetics and pathogenesis of Parkinson's disease. Neurology, 59, 179–185. - PubMed
    1. Narendra D., Walker J.E., Youle R. (2012) Mitochondrial quality control mediated by PINK1 and Parkin: links to parkinsonism. Cold Spring Harb. Perspect. Biol., 4, a011338. - PMC - PubMed
    1. Valente E.M., Abou-Sleiman P.M., Caputo V., Muqit M.M., Harvey K., Gispert S., Ali Z., Del Turco D., Bentivoglio A.R., Healy D.G. et al. (2004) Hereditary early-onset Parkinson's disease caused by mutations in PINK1. Science, 304, 1158–1160. - PubMed
    1. Kitada T., Asakawa S., Hattori N., Matsumine H., Yamamura Y., Minoshima S., Yokochi M., Mizuno Y., Shimizu N. (1998) Mutations in the parkin gene cause autosomal recessive juvenile parkinsonism. Nature, 392, 605–608. - PubMed