. 2016 May;37(5):1661-83.
doi: 10.1002/hbm.23127. Epub 2016 Mar 2.

Intracranial EEG potentials estimated from MEG sources: A new approach to correlate MEG and iEEG data in epilepsy

Affiliations

Intracranial EEG potentials estimated from MEG sources: A new approach to correlate MEG and iEEG data in epilepsy

Christophe Grova et al. Hum Brain Mapp. 2016 May.

Abstract

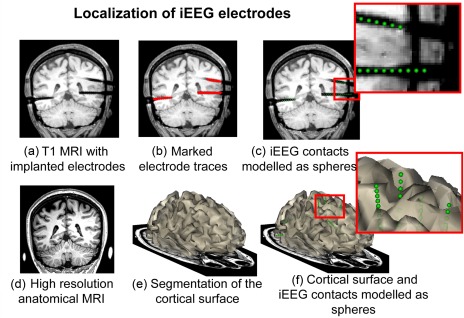
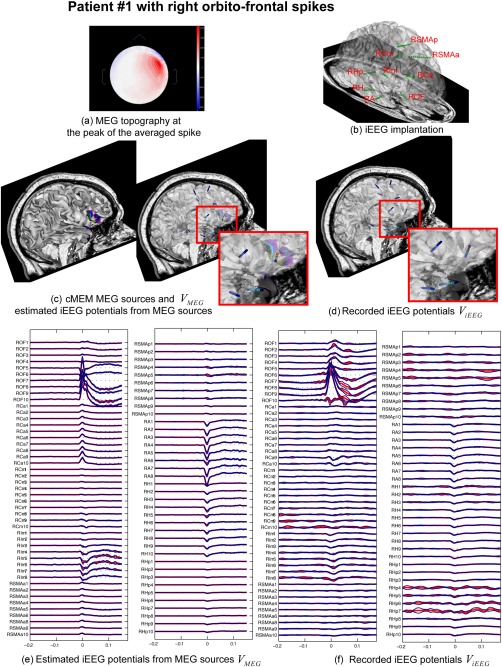
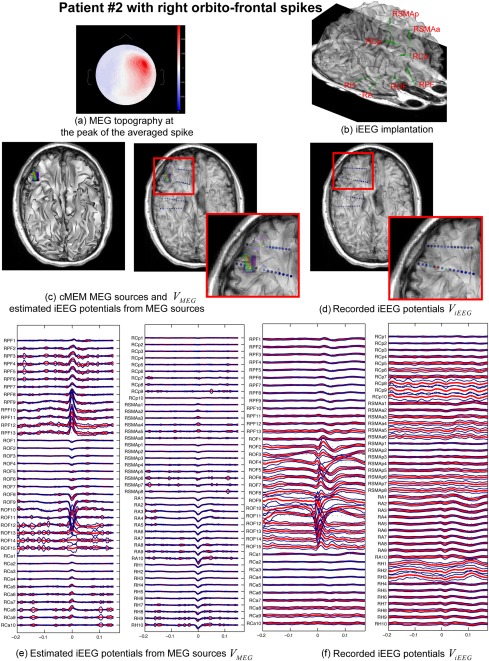
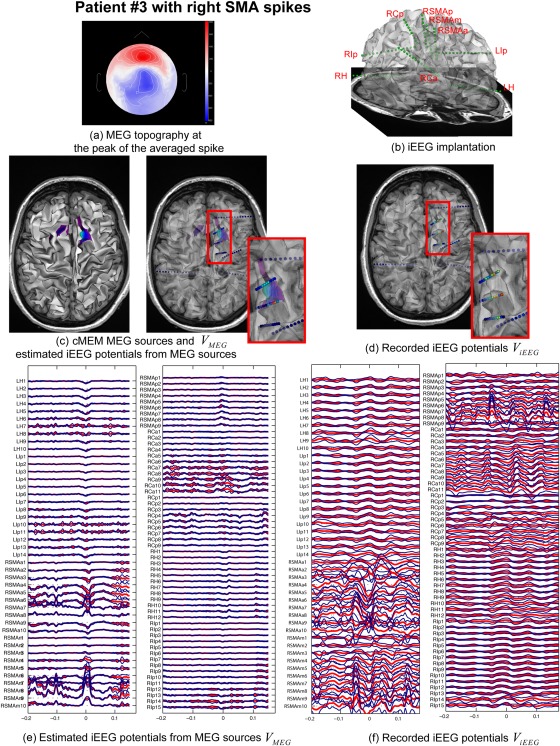
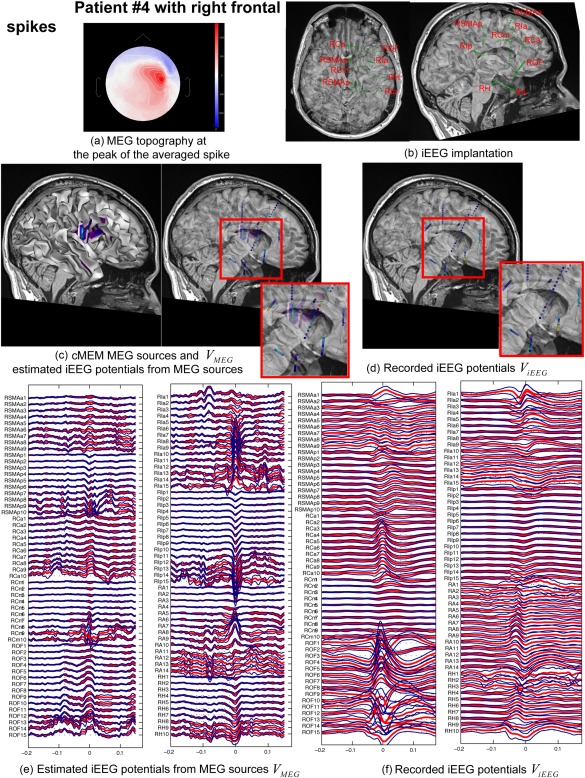
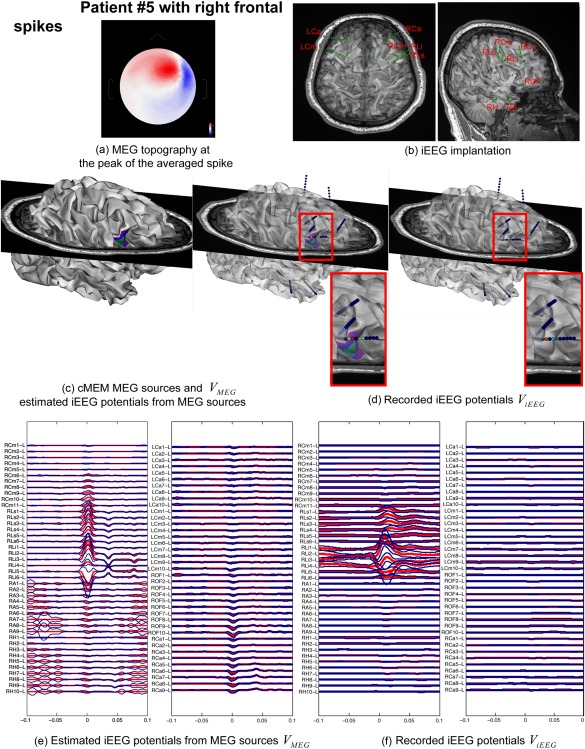
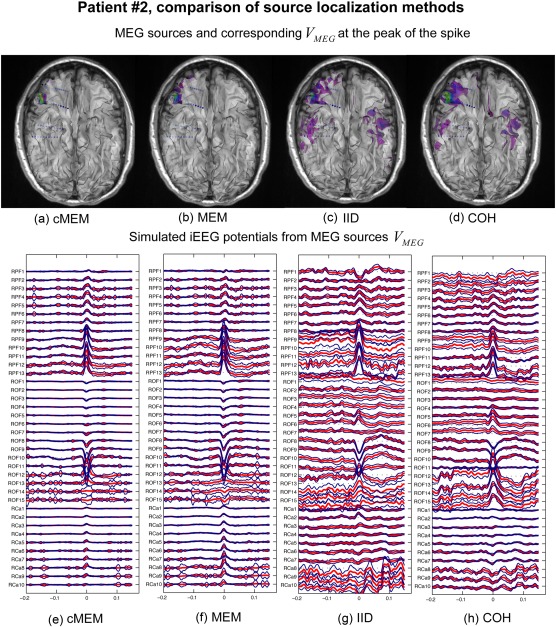
Detection of epileptic spikes in MagnetoEncephaloGraphy (MEG) requires synchronized neuronal activity over a minimum of 4cm2. We previously validated the Maximum Entropy on the Mean (MEM) as a source localization able to recover the spatial extent of the epileptic spike generators. The purpose of this study was to evaluate quantitatively, using intracranial EEG (iEEG), the spatial extent recovered from MEG sources by estimating iEEG potentials generated by these MEG sources. We evaluated five patients with focal epilepsy who had a pre-operative MEG acquisition and iEEG with MRI-compatible electrodes. Individual MEG epileptic spikes were localized along the cortical surface segmented from a pre-operative MRI, which was co-registered with the MRI obtained with iEEG electrodes in place for identification of iEEG contacts. An iEEG forward model estimated the influence of every dipolar source of the cortical surface on each iEEG contact. This iEEG forward model was applied to MEG sources to estimate iEEG potentials that would have been generated by these sources. MEG-estimated iEEG potentials were compared with measured iEEG potentials using four source localization methods: two variants of MEM and two standard methods equivalent to minimum norm and LORETA estimates. Our results demonstrated an excellent MEG/iEEG correspondence in the presumed focus for four out of five patients. In one patient, the deep generator identified in iEEG could not be localized in MEG. MEG-estimated iEEG potentials is a promising method to evaluate which MEG sources could be retrieved and validated with iEEG data, providing accurate results especially when applied to MEM localizations. Hum Brain Mapp 37:1661-1683, 2016. © 2016 Wiley Periodicals, Inc.

Keywords: epilepsy; epilepsy surgery; epileptic spikes; intracranial EEG; magnetic resonance imaging; magnetic source imaging; neurophysiology; presurgical investigation; source localization.


Figures

Figure 1
Figure 1
Localization of iEEG electrodes contacts on the high‐resolution MRI used for MEG source localization. The preimplantation 3 T MRI (d) and the postimplantation 1.5 T MRI obtained with MR‐compatible iEEG electrodes (a) were used for accurate location of iEEG recording contacts. First, void artefacts from electrodes tracks were marked over the 3D volume of the postimplantation MRI (b). Second, the entry point and the target point for each electrode were determined to provide a nondistorted connecting line, along which the recording contacts were placed, based on the manufacturer's specifications of intercontacts distance and contacts dimensions. Every iEEG electrode contact was modeled as a sphere (c). Finally, the two MRI volumes were coregistered and iEEG electrodes contacts were represented over cortical surface segmented from the high‐resolution preimplantation volume (f). [Color figure can be viewed in the online issue, which is available at http://wileyonlinelibrary.com.]
Figure 2
Figure 2
MEG/iEEG correlation for Patient #1 with right orbitofrontal epileptic spikes. (a) MEG topography at the peak of the averaged epileptic spike. (b) iEEG implantation overview where each iEEG contact is represented in 3D as a green sphere (the cortical surface used for MEG source localization is shown with transparency). The label of each iEEG electrode is indicated: R: right, OF: orbito‐frontal, A: amygdala, H: hippocampus, Hp: hippocampus posterior, Ca: anterior cingulate, Cm: mid cingulate, Im: mid insula, SMAa: anterior supplementary motor area, SMAp: posterior supplementary motor area. Electrodes contacts are labeled from 1 to 15, with 1 as the deepest contact in each electrode. Source localization were performed for every single epileptic spike and subsequently averaged. (c) cMEM source localization results and corresponding V MEG potentials are presenting at the peak of the averaged epileptic spike. The absolute value of current density estimated using cMEM is shown as a colour texture over the cortical surface, thresholded above the level of background activity [Otsu, 1979], while the absolute value of V MEG potentials is shown as a color texture over each electrode contact. (d) The absolute value of recorded iEEG potentials V iEEG at the peak of the average epileptic spike is presented as a colour texture over each electrode contact. (e) Time courses of V MEG potentials estimated over all iEEG contacts obtained for all epileptic spikes (average time course in red, ± standard deviation in blue). (f) Time courses of V iEEG potentials recorded over all iEEG contacts for all epileptic spikes (average time course in red, ± standard deviation in blue). Here we observe an excellent spatial concordance between cMEM sources, estimated V MEG potentials and recorded V iEEG involving mainly a lateral right orbitofrontal generator. A secondary right temporal source involving the deepest contacts of RA electrodes was also found with V MEG and confirmed with V iEEG. [Color figure can be viewed in the online issue, which is available at http://wileyonlinelibrary.com.]
Figure 3
Figure 3
MEG/iEEG correlation for Patient #2 with right orbitofrontal epileptic spikes. Overall organization as in Figure 2. Additional iEEG labels: PF: frontal pole, Cp: posterior cingulate. Here we observe an excellent spatial concordance between cMEM sources, estimated V MEG potentials and recorded V iEEG involving mainly a lateral right orbitofrontal generator (contacts ROF8‐ROF12), while cMEM identified a secondary frontal source that projected on RPF superficial contacts. This secondary source was not seen in V iEEG and could thus be considered as spurious. V iEEG showed a propagation of the activity to the deepest ROF contacts. The involvement of these deepest contacts was barely seen in V MEG, with very low amplitude. [Color figure can be viewed in the online issue, which is available at http://wileyonlinelibrary.com.]
Figure 4
Figure 4
MEG/iEEG correlation for Patient #3 with right supplementary motor area epileptic spikes. Overall organization as in Figure 2. Additional iEEG labels: L: left, SMAm: mid supplementary motor area, Ip: posterior insula. Here we observe a good spatial concordance between cMEM sources, estimated V MEG potentials and recorded V iEEG involving mainly a right SMA generator. Good concordance between V MEG and V iEEG was observed in RSMAa and RSMAm electrodes, whereas the secondary involvement of RSMAp on V iEEG could not be retrieved from cMEM sources and estimated V MEG potentials. [Color figure can be viewed in the online issue, which is available at http://wileyonlinelibrary.com.]
Figure 5
Figure 5
MEG/iEEG correlation for Patient #4 with right frontal epileptic spikes. Overall organization as in Figure 2. Additional iEEG labels: Ia: anterior Insula. There was no clear spatial concordance between cMEM sources involving a right perisylvian source that projected mainly on RIa and RIp electrodes for V MEG, as the main generator recorded using V iEEG was obtained on the deepest contacts of ROF electrode (contacts ROF1–ROF7). Note that the time courses of recorded V iEEG showed initial involvement of the most superficial contacts of ROF electrode (ROF12–ROF14), rapidly propagating to the deepest contacts. It could be considered that there is a slight MEG/iEEG concordance since estimated V MEG potentials also showed a slight initial involvement of some mid and superficial ROF electrode contacts (ROF4–ROF15). No electrodes were implanted, where cMEM localized a right perisylvian source. [Color figure can be viewed in the online issue, which is available at http://wileyonlinelibrary.com.]
Figure 6
Figure 6
MEG/iEEG correlation for Patient #5 with right frontal epileptic spikes. Overall organization as in Figure 2. Additional iEEG labels: Li and Ls, inferior and superior aspects of the lesion. Here, we observe an excellent spatial concordance between cMEM sources, estimated V MEG potentials and recorded V iEEG, within the suspected FCD lesion. The main reconstructed activity involved similar contacts on estimated V MEG potentials (RLi2–6) and recorded V iEEG potentials (RLi2–4). This is indeed a very focal generator that was propagating to the deepest contact of RLs electrodes (RLs1–3) few milliseconds after the main peak in iEEG. MEG reconstructed potentials V MEG were spreading more than V iEEG over RLi5–6 and RLs contacts, mainly because no other activity that the main generator was reconstructed using cMEM. This is an interesting example of a very focal generator localized accurately with MEG, whereas such a focal source was not able to generate visible epileptic spikes on scalp EEG. [Color figure can be viewed in the online issue, which is available at http://wileyonlinelibrary.com.]
Figure 7
Figure 7
Comparison between MEG source localization methods, illustrated in Patient #2 with right orbitofrontal epileptic spikes. For each source localization method, MEG source localization results and corresponding V MEG potentials are presented at the peak of the averaged epileptic spike. The absolute value of current density estimated is shown as a color texture over the cortical surface, thresholded above the level of background activity [Otsu, 1979]. The absolute value of V MEG potentials is shown as a color texture over each electrode contact: (a) cMEM sources, (b) MEM sources, (c) IID sources, and (d) COH sources. For each source localization method, time courses of V MEG potentials estimated over iEEG contacts obtained for all epileptic spikes (average time course in red, ±standard deviation in blue): (e) cMEM sources, (f) MEM sources, (g) IID sources, and (h) COH sources. V MEG time courses are presented only on iEEG electrodes exhibiting most of the estimated activity (i.e., RPF, ROF, and RCa). These figures should be compared with iEEG recordings in Figure 3 (d) and (f). All four source localization methods found the main source located on the most superficial ROF electrode contacts. They also showed the same secondary spurious source that projected over RPF electrode. Overall source localizations obtained using IID and COH were noisier than MEM and cMEM, showing more extended spurious sources located far from the main generator. Fewer spurious sources were identified using both MEM and cMEM. [Color figure can be viewed in the online issue, which is available at http://wileyonlinelibrary.com.]

Similar articles

Cited by

References

    1. Agirre‐Arrizubieta Z, Huiskamp GJ, Ferrier CH, van Huffelen AC, Leijten FS (2009): Interictal magnetoencephalography and the irritative zone in the electrocorticogram. Brain 132:3060–3071. - PubMed
    1. Amblard C, Lapalme E, Lina JM (2004): Biomagnetic source detection by maximum entropy and graphical models. IEEE Trans Biomed Eng 51:427–442. - PubMed
    1. An D, Fahoum F, Hall J, Olivier A, Gotman J, Dubeau F (2013): Electroencephalography/functional magnetic resonance imaging responses help predict surgical outcome in focal epilepsy. Epilepsia 54:2184–2194. - PMC - PubMed
    1. Badier JM, Bartolomei F, Chauvel P, Bénar CG, Gavaret M (2015): Magnetic source imaging in posterior cortex epilepsies. Brain Topogr 28:162–171. - PubMed
    1. Bénar CG, Grova C, Kobayashi E, Bagshaw AP, Aghakhani Y, Dubeau F, Gotman J (2006): EEG‐fMRI of epileptic spikes: Concordance with EEG source localization and intracranial EEG. Neuroimage 30:1161–1170. - PubMed

Publication types

LinkOut - more resources