. 2016 Mar 2:6:22509.
doi: 10.1038/srep22509.

Intralymphatic mRNA vaccine induces CD8 T-cell responses that inhibit the growth of mucosally located tumours

Affiliations

Intralymphatic mRNA vaccine induces CD8 T-cell responses that inhibit the growth of mucosally located tumours

Lukasz Bialkowski et al. Sci Rep. .

Abstract

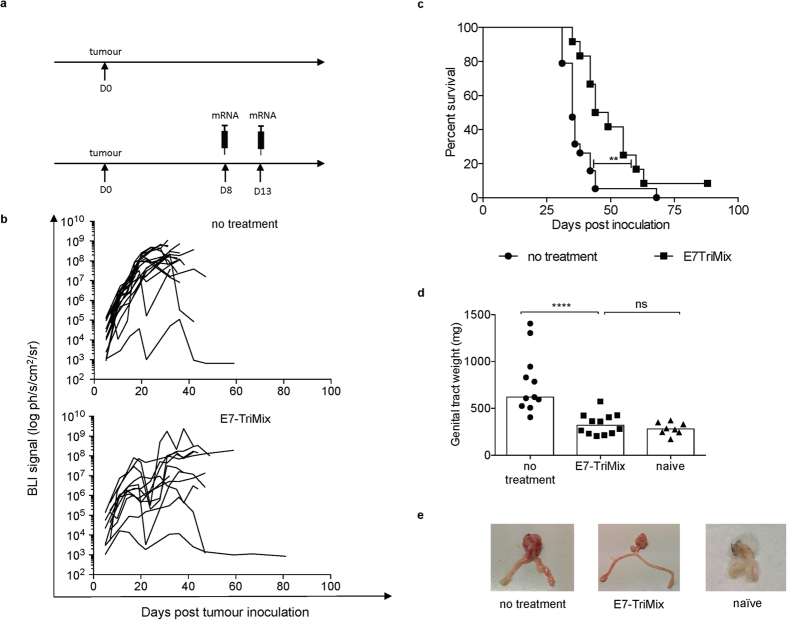
The lack of appropriate mouse models is likely one of the reasons of a limited translational success rate of therapeutic vaccines against cervical cancer, as rapidly growing ectopic tumours are commonly used for preclinical studies. In this work, we demonstrate that the tumour microenvironment of TC-1 tumours differs significantly depending on the anatomical location of tumour lesions (i.e. subcutaneously, in the lungs and in the genital tract). Our data demonstrate that E7-TriMix mRNA vaccine-induced CD8(+) T lymphocytes migrate into the tumour nest and control tumour growth, although they do not express mucosa-associated markers such as CD103 or CD49a. We additionally show that despite the presence of the antigen-specific T cells in the tumour lesions, the therapeutic outcomes in the genital tract model remain limited. Here, we report that such a hostile tumour microenvironment can be reversed by cisplatin treatment, leading to a complete regression of clinically relevant tumours when combined with mRNA immunization. We thereby demonstrate the necessity of utilizing clinically relevant models for preclinical evaluation of anticancer therapies and the importance of a simultaneous combination of anticancer immune response induction with targeting of tumour environment.


Conflict of interest statement

No patent was filed based on current study. The TriMix vaccine is however protected by patent on which K.T. is a co-inventor. The patent has been licensed to a biotech company. This company is not involved in current work or funding of this study. Other authors declare no conflict of interests.

Figures

Figure 1
Figure 1. E7-TriMix mRNA immunization induces high numbers of E7-specific T cells that differentially migrate into the tumour tissue depending on its location.
Mice bearing differently located fluc+ TC-1 tumours were immunized by intranodal injection with E7-TriMix and tumour tissue and spleens were isolated for immune response monitoring as described in Materials and Methods. Flow cytometric analysis was performed to evaluate the numbers of E7-specific CD8+ T cells, represented as a percentage of CD8+ T cells (a) or percentage of CD45+ cells (b). Each dot represents an individual mouse; the bars correspond to the median values. Immunofluorescence analysis was performed on frozen tumour sections to detect Ki67+ cells (green) and CD8+ T cells (red) in lung tissue, genital tract and subcutaneous tumours (c). Nuclei were stained with DAPI (blue). The scale bars correspond to 200 μm. Abbreviations: N: naïve, NT: no treatment, E7: E7-TriMix-treated mice, L: lungs, GT: genital tract, SC: subcutaneous tumours. (a,b) data shown from 2–4 independent experiments, 4–28 individuals per group. (c) representative photos from 2 experiments, 2 mice per group. Statistical analysis: Mann-Whitney test; * significant at p < 0.05, **** significant at p < 0.0001, ns: non significant.
Figure 2
Figure 2. Tumour-infiltrating E7-specific T cells express PD-1 and secrete INF-γ in response to antigen stimulation.
Fluc+ TC-1 tumour-bearing mice were immunized with E7-TriMix mRNA and tumour/spleen tissue was excised as described in Materials and Methods. Freshly isolated splenocytes or tumour-infiltrating immune cells were checked for the expression of PD-1 (a). An ex vivo IFN-γ ELISPOT assay was performed on tumour-infiltrating immune cells and sorted CD8+ spleen cells (b). The values shown for (b) were normalized based on the numbers of CD8+ T cells determined by flow cytometry. The background obtained for cells not stimulated with E7 peptides was subtracted. Each dot represents an individual mouse; the bars correspond to the median values. Abbreviations: N: naïve, NT: no treatment, E7: E7-TriMix-treated mice. (a) 2 independent experiments, 9–14 individuals per group; (b) 2–3 independent experiments, 4–20 individuals per group. Statistical analysis: Mann-Whitney test; * significant at p < 0.05, ** significant at p < 0.01, *** significant at p < 0.001, **** significant at p < 0.0001.
Figure 3
Figure 3. Tumour-infiltrating E7-specific T cells do not express mucosa-associated markers and their splenic counterparts display the phenotype of central memory cells.
Mice bearing differently located fluc+ TC-1 tumours were immunized with E7-TriMix and tumour tissue and spleens were isolated 10 days after the last immunization as described in Materials and Methods. Flow cytometric analysis was performed to assess the expression level of mucosa-associated markers: CD103, CD49a and CD69. Survivors that had rejected genital tract tumours were killed 90 days after the last immunization and memory phenotype was evaluated based on the expression pattern of CD62L, CD127 and KLRG1 on E7-DEX+ cells. Dot plots representative for 6 individuals per group are shown for mucosal markers (a) and memory profile (b).
Figure 4
Figure 4. Tumour size determines the efficacy of the therapy in the subcutaneous model.
Mice bearing subcutaneous TC-1 tumours were split into three groups as shown in the experimental setting (a) and treated as described in Materials and Methods. The tumour growth was monitored 2–3 times a week with a digital calliper. Each line represents an individual mouse (b). Survival curves with median survival times: no treatment 32 days, early regimen 73 days, late regimen 61 days (c). Data shown are from 2 independent experiments, 11–12 individuals per group. Statistical analysis for (c) log-rank test; *** significant at p < 0.001, ns: non significant.
Figure 5
Figure 5. E7-TriMix vaccination controls progression of TC-1 lung tumours.
Fluc+ TC-1 lung tumour-bearing mice were treated as shown in the experimental setting (a). The kinetics of tumour growth were monitored by means of in vivo BLI; each line corresponds to an individual mouse (b). Survival curves with median survival times: no treatment 18.5 day, E7-TriMix 35 days (c). For a randomized group of mice, the lung weight was checked 10 days after the last immunization; each dot represents an individual mouse; the bars represent the median values (d). Representative photos of organs from (d) are shown (e). (b,c) 2 independent experiments, 22–26 individuals per group; (d) 2 independent experiments, 6–14 individuals per group. Statistical analysis for (c) log-rank test; *** significant at p < 0.001; for (d) Mann-Whitney test; ** significant at p < 0.01, *** significant at p < 0.001.
Figure 6
Figure 6. TC-1 tumour lesions located in genital tract are resistant to E7-TriMix treatment.
Fluc+ TC-1 genital tract tumour-bearing mice were treated as represented in the experimental setting (a). The kinetics of tumour growth were monitored by means of in vivo BLI; each line corresponds to an individual mouse (b). Survival curves with median survival times: no treatment 35 days, E7-TriMix 46.5 day (c). The genital tract weight was checked 10 days post the last immunization in a randomized group of mice; each dot represents an individual mouse; the bars represent median values (d). Representative pictures of organs from (d) are shown in (e). (b,c) 2 independent experiments, 12–19 individuals per group; (d) 2 independent experiments, 8–12 individuals per group. Statistical analysis for (c) log-rank test; ** significant at p < 0.01; for (d) Mann-Whitney test; **** significant at p < 0.0001, ns: non significant.
Figure 7
Figure 7. The immunosuppressive tumour microenvironment differs depending on the tumour location.
Mice bearing differently located TC-1 tumours were immunized with E7-TriMix as described in Materials and Methods. Ten days post the last immunization (for orthotopic lung and genital tract model) or when tumours reached 1000 mm3 (for subcutaneous model), tumour tissue and spleens were isolated and flow cytometric analysis was performed to analyse the numbers of Tregs (a), grMDSCs (b), moMDSCs (c), CD80+ grMDSCs (d) and CD80+ moMDSCs (e). (f) shows the ratio Teff/Tregs in the different tumour models. Each dot represents an individual mouse; the bars correspond to the median values. Abbreviations: NT: no treatment, E7: E7-TriMix-treated mice, L: lungs, GT: genital tract, SC: subcutaneous tumours. (a,e,f) 2 independent experiments, 7–13 individuals per group; (bd) 2 independent experiments, 7–17 individuals per group. Statistical analysis: Mann-Whitney test; * significant at p < 0.05, ** significant at p < 0.01, *** significant at p < 0.001, **** significant at p < 0.0001, ns: non significant.
Figure 8
Figure 8. Combination of E7-TriMix mRNA and cisplatin leads to a complete and durable rejection of genital tract tumours.
Mice were intravaginally inoculated with fluc+ TC-1 tumour cells and treated as represented in the experimental setting (a). Survival curves with median survival times: no treatment 35 days, cisplatin 47 days and E7-TriMix 73 days; 88% of mice treated with cisplatin + E7-TriMix survived (b). For a randomized group of mice, the tumour microenvironment was checked 10 days after the last immunization: E7-specific T-cell infiltration (c), moMDSCs (d), grMDSCs (e) and ratio Teff/Treg (f). Each dot represents an individual mouse, bars correspond to median values. Abbreviations: NT: no treatment, CIS: cisplatin-treated mice, E7: E7-TriMix-treated mice, E7 + CIS: cisplatin and E7-TriMix-treated mice; (b) one experiment with 17 individuals per group; (cf) 2 independent experiments, 5–11 individuals per group. Statistical analysis for (b) log-rank test; * significant at p < 0.05, ** significant at p < 0.01, *** significant at p < 0.001; for (cf) Mann-Whitney test; * significant at p < 0.05, ** significant at p < 0.01, *** significant at p < 0.001, ns: non significant.

Similar articles

Cited by

References

    1. Ferlay J. et al.. Cancer Incidence and Mortality Worldwide: IARC CancerBase No. 11. Globocan 2012 v1.0 (2013). at < http://globocan.iarc.fr > .
    1. Bosetti C., Turati F. & La Vecchia C. Hepatocellular carcinoma epidemiology. Best Pract. Res. Clin. Gastroenterol. 28, 753–70 (2014). - PubMed
    1. Parkin D. M., Boyd L. & Walker L. C. 16. The fraction of cancer attributable to lifestyle and environmental factors in the UK in 2010. Br. J. Cancer 105 Suppl, S77–81 (2011). - PMC - PubMed
    1. Hopkins T. G. & Wood N. Female human papillomavirus (HPV) vaccination: global uptake and the impact of attitudes. Vaccine 31, 1673–9 (2013). - PubMed
    1. Tabrizi S. N. et al.. Assessment of herd immunity and cross-protection after a human papillomavirus vaccination programme in Australia: a repeat cross-sectional study. Lancet. Infect. Dis. 14, 958–66 (2014). - PubMed

Publication types