

Tousled-like kinase 2 regulates recovery from a DNA damage-induced G2 arrest
- PMID: 26931568
- PMCID: PMC5341517
- DOI: 10.15252/embr.201540767
Tousled-like kinase 2 regulates recovery from a DNA damage-induced G2 arrest
Abstract
In order to maintain a stable genome, cells need to detect and repair DNA damage before they complete the division cycle. To this end, cell cycle checkpoints prevent entry into the next cell cycle phase until the damage is fully repaired. Proper reentry into the cell cycle, known as checkpoint recovery, requires that a cell retains its original cell cycle state during the arrest. Here, we have identified Tousled-like kinase 2 (Tlk2) as an important regulator of recovery after DNA damage in G2. We show that Tlk2 regulates the Asf1A histone chaperone in response to DNA damage and that depletion of Asf1A also produces a recovery defect. Both Tlk2 and Asf1A are required to restore histone H3 incorporation into damaged chromatin. Failure to do so affects expression of pro-mitotic genes and compromises the cellular competence to recover from damage-induced cell cycle arrests. Our results demonstrate that Tlk2 promotes Asf1A function during the DNA damage response in G2 to allow for proper restoration of chromatin structure at the break site and subsequent recovery from the arrest.
Keywords: Asf1A; DNA damage; Tlk2; cell cycle; checkpoint recovery.
© 2016 The Authors.
Figures
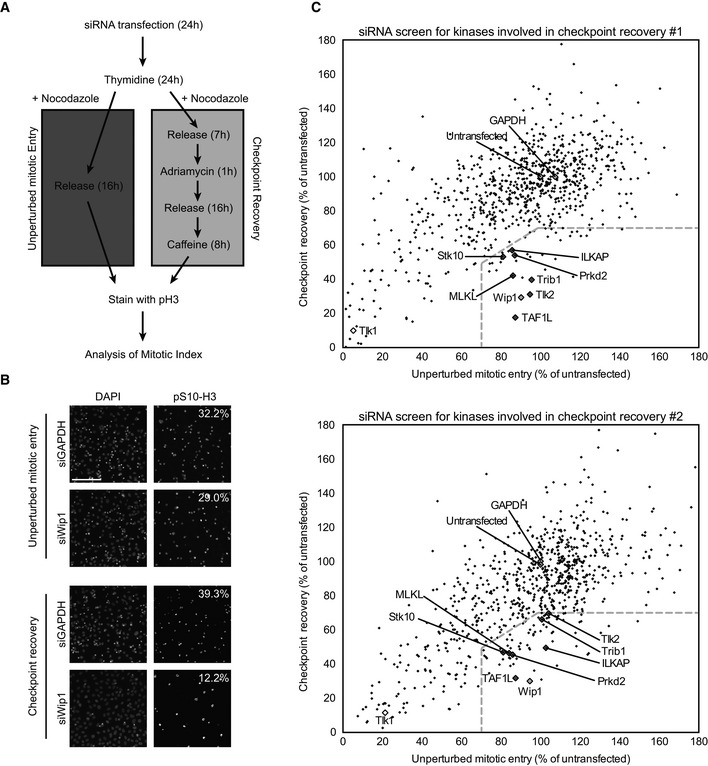
Protocol used for the si
RNA ‐based kinome screen. U2OS cells were transfected for 24 h, synchronized at the G1/S border by thymidine for 24 h, and then either released into nocodazole for 16 h (unperturbed mitotic entry) or released for 7 h, treated with 0.5 μM adriamycin for 1 h, and after 16 h, cells were induced to recover by addition of caffeine for 8 h (checkpoint recovery). Cells were fixed and stained withDAPI and antibodies directed at histone H3‐pS 10. Finally, automated analysis of the percentage of histone H3‐pS 10‐positiveDAPI ‐stained nuclei was carried out.Representative images of positive control (siWip1)‐ and negative control (si
GAPDH )‐transfected cells treated as in (A). Calculated percentages are indicated. Scale bar indicates 100 μm.Plots of duplicate screens. U2
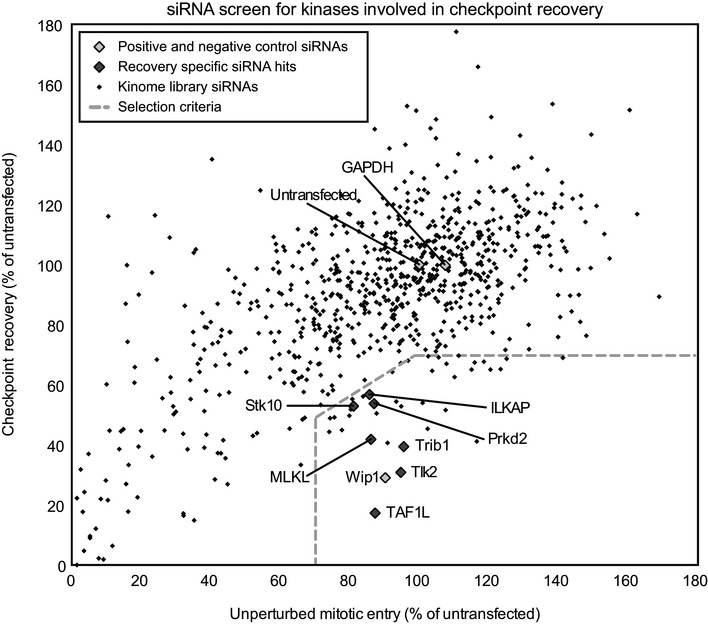
OS cells were treated as in (A). Black diamonds indicate individual siRNA ‐targeted genes from the library, light gray diamonds indicate positive (Wip1‐depleted) and negative (untransfected andGAPDH ‐depleted) controls, dark gray diamond indicates the genes that met the criteria in both screens, and white diamonds indicate Tlk1‐depleted conditions. Dotted lines indicate selection criteria for recovery‐specific genes.
U2
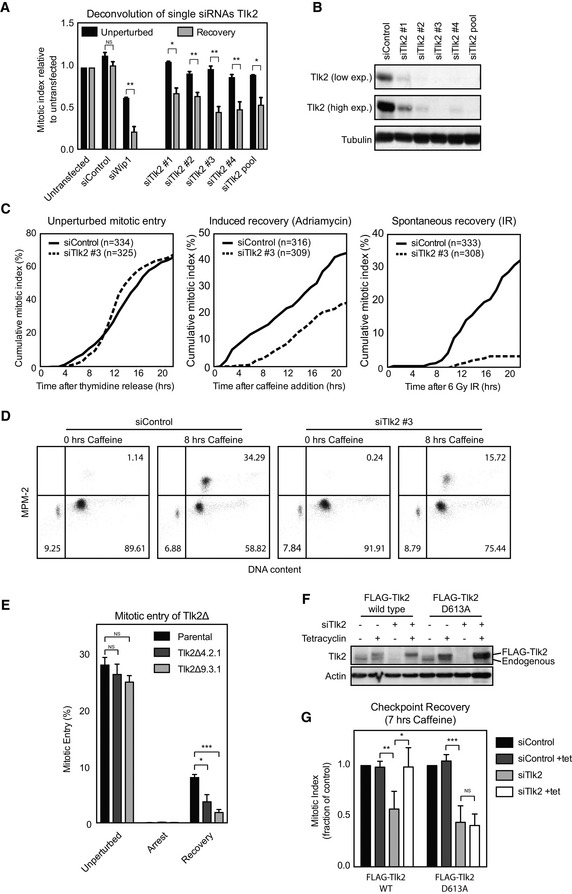
OS cells were transfected with four independent siRNA s from the pools used in the screen, treated as in Fig 1, and analyzed for mitotic index. Error bars representSD , n = 3. Statistical significance was tested using a paired two‐tailed t‐test (NS P > 0.05, *P ≤ 0.05, **P ≤ 0.01).U2
OS cells were synchronized with a single thymidine block, released into G2, and damaged with 0.5 μM adriamycin for 1 h. After a 16‐h G2 arrest, cells were harvested for Western blot analysis and analyzed for Tlk2 protein levels.Live cell imaging of thymidine‐synchronized unperturbed or damaged G2 cells. Cumulative percentage of cells entering mitosis were scored and plotted.
U2
OS cells were transfected with either a control siRNA or Tlk2 siRNA #3, synchronized, and damaged in G2. Cells were either harvested or treated with caffeine for 8 h before harvest, and cell cycle distribution was analyzed byFACS . Percentages of cells in each quadrant are indicated.Tlk2Δ cells were generated using
CRISPR /Cas9 genome editing. Cells were synchronized in G2 by thymidine release and damaged with 0.5 μM adriamycin for 1 h. After a 16‐h G2 arrest, cells were induced to recover by addition of caffeine for 8 h and analyzed byFACS . Error bars representSD , n = 4. Statistical significance was tested using a paired two‐tailed t‐test (NS P > 0.05, *P ≤ 0.05, ***P ≤ 0.001).U2
TR cells stably expressing Tlk2 siRNA #3‐insensitive tetracycline‐inducibleFLAG ‐Tlk2‐wt orFLAG ‐Tlk2‐D613A were thymidine‐synchronized and damaged in G2. Tetracycline was present form the start of the experiment where indicated.Caffeine‐induced recovery assay of cell lines shown in (F). Error bars represent
SD , n = 3. Statistical significance was tested using a paired two‐tailed t‐test (NS P > 0.05, *P ≤ 0.05, **P ≤ 0.01, ***P ≤ 0.001).
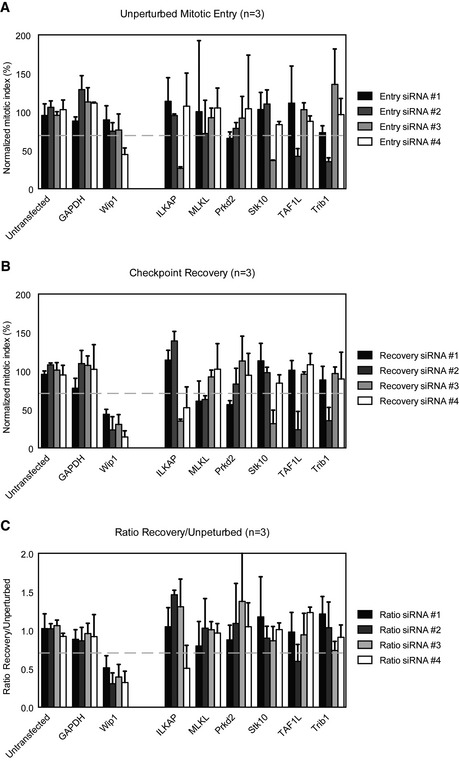
- A–C
Single si
RNA s which were pooled in the primary screen were deconvolved. U2OS cells were transfected with the siRNA s, and mitotic index is determined as in Fig 1. For each gene identified in the screen, the mitotic index of the single siRNA s is shown in both the unperturbed setup (A), recovery setup (B) and a ratio between the two (C). The gray‐dotted line indicates the cutoff criteria. Error bars representSD , n = 3.
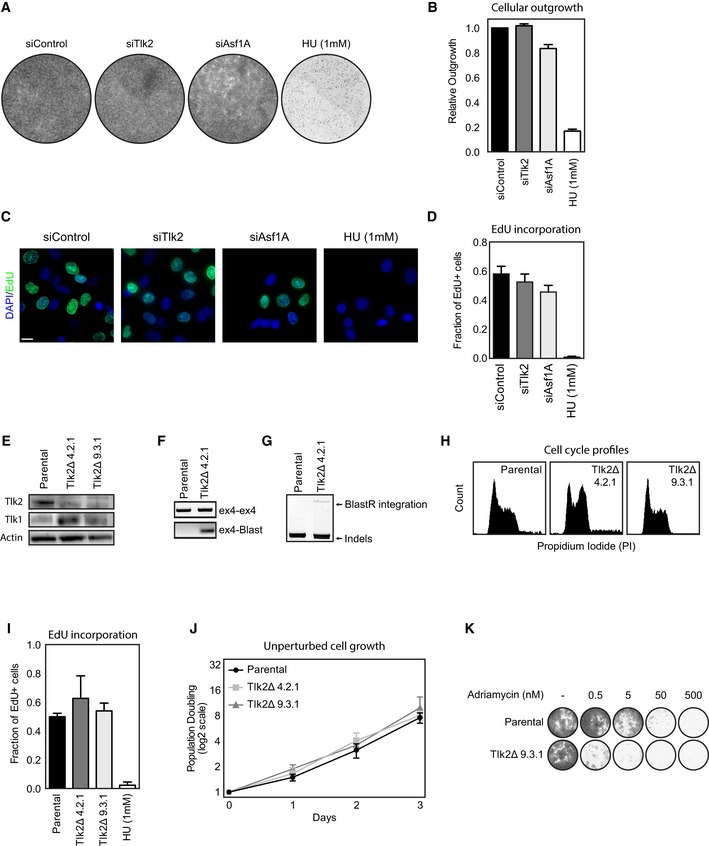
- A
Asynchronously cycling U2
OS cells were transfected with the indicated siRNA s and analyzed for outgrowth after 7 days using crystal violet staining. Hydroxyurea was added where indicated at a concentration of 1 mM. - B
Quantification of the experiment in (A). Error bars represent
SD , n = 3. - C
Asynchronously cycling U2
OS cells were treated as in (A). Cells were treated with EdU for 2 h, fixed, and analyzed for Edu incorporation. Scale bar indicates 10 μm. - D
Quantification of the experiment in (C). Error bars represent
SD , n = 3. - E
Western blot analysis of Tlk2 knockout cells.
- F, G
Incorporation of the BlastR gene as measured by
PCR amplification of genomicDNA . - H
Cell cycle analysis of asynchronous parental and Tlk2Δ cell lines.
- I
Asynchronously cycling parental and Tlk2Δ cell lines were treated with EdU for 4 h and analyzed for EdU incorporation similar to (D). Error bars represent
SD , n = 3. - J
Population doubling during 3 consecutive days of asynchronously cycling parental and Tlk2Δ cell lines. Error bars represent
SD , n = 3. - K
Adriamycin sensitivity in parental and Tlk2Δ cells. Cells were treated with the indicated amounts of adriamycin and analyzed for outgrowth using crystal violet staining after 7 days.
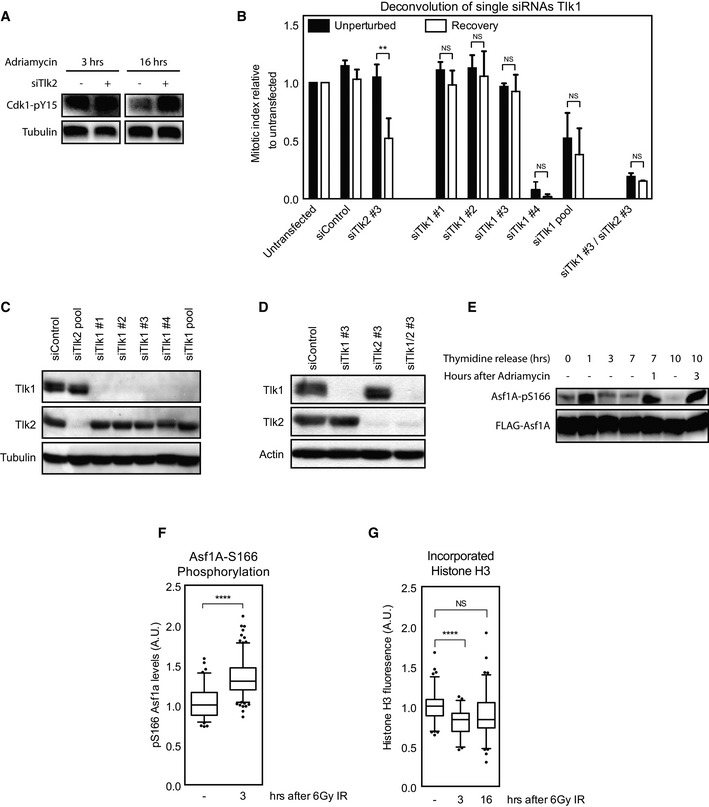
- A
U2
OS cells were transfected with control or Tlk2 siRNA s and synchronized in G2 by a single thymidine block. Cells were subsequently damaged in G2 by 0.5 μM adriamycin for 1 h and harvested at the indicated times after damage. Samples were analyzed by Western blot with the indicated antibodies. - B
Cells were treated as in Fig 2A. Error bars represent
SD , n = 3. Statistical significance was tested using a paired two‐tailed t‐test (NS P > 0.05, **P ≤ 0.01). - C, D
U2
OS cells were synchronized with a single thymidine block, released into G2, and damaged with 0.5 μM adriamycin for 1 h. After a 16‐h G2 arrest, cells were harvested for Western blot analysis and analyzed for Tlk1 and Tlk2 protein levels. - E
Inducible
FLAG ‐Asf1A‐wt cell lines were synchronized by a single thymidine block and released for the hours indicated. Adriamycin was added for 1 h at 0.5 μM and washed out for the indicated time.FLAG ‐Asf1A was immunoprecipitated and blotted with the indicated antibodies. - F
Cells were synchronized in G2 phase by release from a single thymidine block. Cells were left untreated or were irradiated with 6 Gy of
IR . Samples were fixed 3 h afterward and stained for Asf1A‐pS 166. Nuclear fluorescence intensity was measured relative toDAPI . Whiskers represent 5–95% of data points. Statistical significance was tested using an unpaired two‐tailed t‐test (****P ≤ 0.0001). - G
U2
OS cells were synchronized in G2 by a single thymidine block and were left untreated or were irradiated with 6 Gy ofIR . Samples were pre‐extracted at the indicated time points and were fixed for analysis. Cells were stained for total levels of histone H3 and quantified relative toDAPI . Whiskers represent 5–95% of data points. Statistical significance was tested using an unpaired two‐tailed t‐test (NS P > 0.05, ****P ≤ 0.0001).
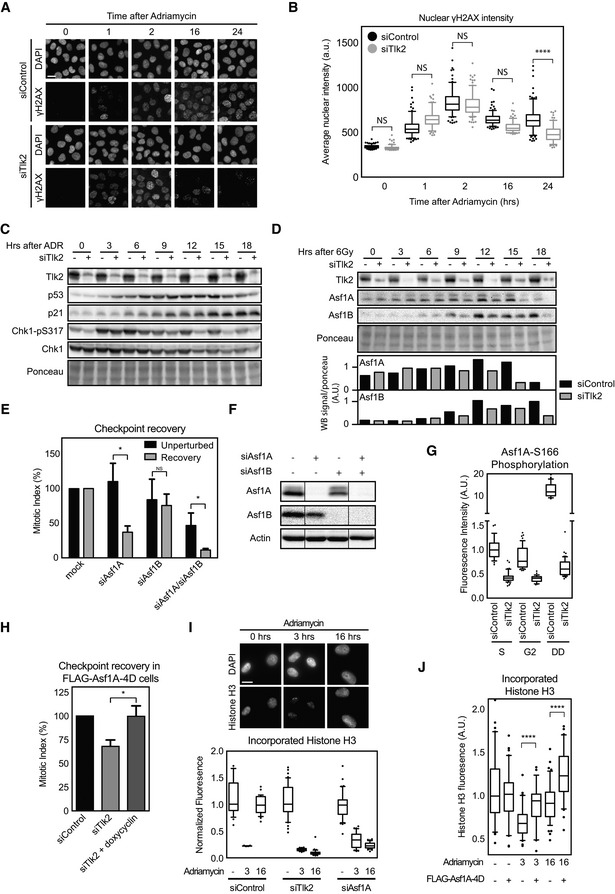
U2
OS cells were grown on glass coverslips and synchronized in G2 after thymidine release. Cells were fixed at the indicated times after adriamycin‐inducedDNA damage and stained forDAPI and γH2AX . Scale bar indicates 10 μm.Quantification of cells in (A). Each dot represents the total signal of γH2
AX in the nucleus of a single cell. Bars indicate the mean and error bars indicate theSD of the data points in each condition. Whiskers represent 5–95% of data points. Statistical significance was tested using an unpaired two‐tailed t‐test (NS P > 0.05, ****P ≤ 0.0001).U2
OS cells were synchronized in G2 and harvested at the indicated times after induction of adriamycin‐inducedDNA damage with or without Tlk2 depletion. Samples were analyzed by Western blotting for the indicated proteins.U2
OS cells were synchronized in G2 and damaged with 6 Gy ofIR . Samples were taken at the indicated times after induction of damage with or without Tlk2 depletion. Samples were analyzed by Western blot for the indicated proteins. Band signal intensity for Asf1A and Asf1B was measured and corrected for Ponceau S staining.U2
OS cells were transfected with the indicated siRNA s and treated as in Fig 2A. Mitotic index was analyzed byFACS . Error bars representSD , n = 3. Statistical significance was tested using a paired two‐tailed t‐test (NS P > 0.05, *P ≤ 0.05).U2
OS cells were synchronized with a single thymidine block, released into G2, and damaged with 0.5 μM adriamycin for 1 h. After a 16‐h G2 arrest, cells were harvested for Western blot analysis and analyzed for the indicated protein levels. Lanes were all present on the same blot but pasted together for comparison as indicated by the lines.Cells were synchronized in S or G2 phase by a single thymidine block. Damage was induced by 0.5 μM adriamycin for 1 h, and cells were allowed to incubate for 16 h afterward. Samples were fixed at the indicated cell cycle stages and stained for Asf1A‐
pS 166. Nuclear fluorescence intensity was measured relative toDAPI . Whiskers represent 5–95% of data points.Cells were treated and analyzed as in Fig 2E. Induction of
FLAG ‐Asf1A‐4D was induced using doxycycline. Error bars representSD , n = 5. Statistical significance was tested using a paired two‐tailed t‐test (*P ≤ 0.05).U2
OS cells were synchronized in G2 by a single thymidine block and where indicated treated with 0.5 μM adriamycin for 1 h and after the indicated time points were pre‐extracted and fixed. Cells were stained for total levels of histone H3 and quantified relative toDAPI . Scale bar indicates 10 μm. Whiskers represent 5–95% of data points.FLAG ‐Asf1A‐4D‐inducible cells were treated as in (I), and expression was induced using doxycycline where indicated. Whiskers represent 5–95% of data points. Statistical significance was tested using an unpaired two‐tailed t‐test (****P ≤ 0.0001).
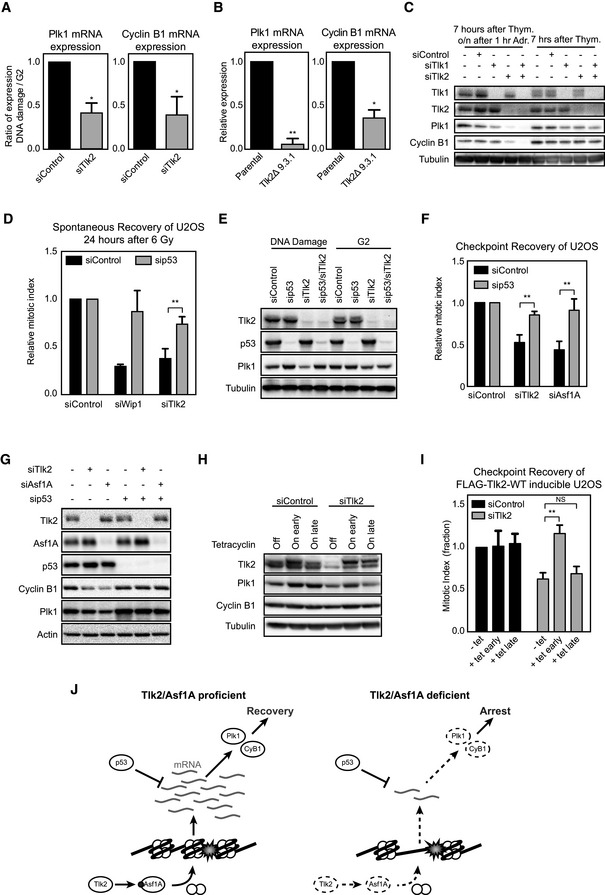
U2
OS cells were treated as in Fig 2B after whichmRNA was isolated and analyzed byqPCR . Error bars representSD , n = 3. Statistical significance was tested using a paired two‐tailed t‐test (*P ≤ 0.05).Tlk2Δ 9.3.1 cells were treated and analyzed as in Fig 3A. Error bars represent
SD , n = 3. Statistical significance was tested using a paired two‐tailed t‐test (*P ≤ 0.05, **P ≤ 0.01).U2
OS cells were synchronized in G2 and harvested or synchronized in G2 and harvested 16 h after adriamycin‐inducedDNA damage. Samples were analyzed by Western blot for the indicated proteins.U2
OS cells were transfected with the indicated siRNA s, synchronized in G2, and damaged with 6 Gy ofIR . Cells were harvested 24 h later, and the mitotic index was analyzed byFACS . Error bars representSD , n = 3. Statistical significance was tested using a paired two‐tailed t‐test (**P ≤ 0.01).Cells transfected with the indicated si
RNA s were treated and analyzed as in (C).U2
OS cells were transfected with the indicated siRNA s, arrested in G2 with adriamycin, and induced to recover by addition of caffeine. Mitotic index was analyzed byFACS . Error bars representSD , n = 3. Statistical significance was tested using a paired two‐tailed t‐test (**P ≤ 0.01).U2
OS cells were synchronized in G2 and harvested 16 h after adriamycin‐inducedDNA damage. Samples were analyzed by Western blot for the indicated proteins.U2
TR cells stably expressing Tlk2 siRNA #3‐insensitive tetracycline‐inducibleFLAG ‐Tlk2‐wt were thymidine‐synchronized, damaged in G2, and harvested 24 h afterward. Tetracycline was either absent (off), added from the start of the experiment (early) or 16 h after induction ofDNA damage (late). Samples were analyzed by Western blot for the indicated proteins.Cells were treated as in (G) and recovery was induced by addition of caffeine for 8 h. Mitotic index was analyzed by
FACS and normalized to the control. Error bars representSD of three independent experiments. Error bars representSD , n = 3. Statistical significance was tested using a paired two‐tailed t‐test (NS P > 0.05, **P ≤ 0.01).Model of Tlk2/Asf1A‐dependent recovery competence. Red circle denotes phosphorylation event at S166, and white circles denote histones. See text for further details.
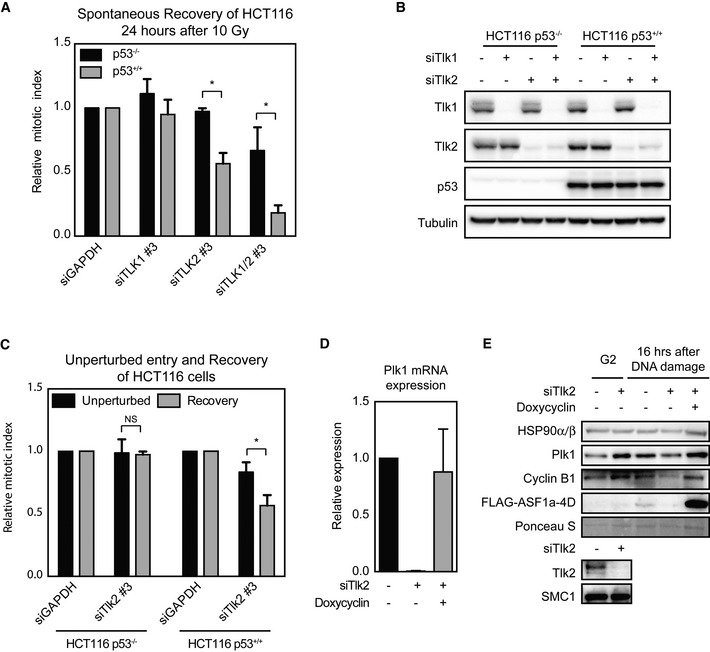
HCT 116‐p53+/+ andHCT 116‐p53−/− cells were transfected with the indicated siRNA s, synchronized in G2, and damaged with 10 Gy ofIR . Cells were harvested 24 h later, and the mitotic index was analyzed byFACS . Error bars representSD , n = 3. Statistical significance was tested using a paired two‐tailed t‐test (*P ≤ 0.05).HCT 116‐p53+/+ andHCT 116‐p53−/− cells were treated as in (A) and analyzed by Western blot to determine the knockdown efficiency of the indicated siRNA s and levels of p53.HCT 116‐p53−/− andHCT 116‐p53+/+ cells were either released for 24 h from a 24‐h thymidine block into medium containing nocodazole or released for 7 h into G2, irradiated with 10 GyIR , and released for 24 h into medium containing nocodazole. Mitotic index was analyzed byFACS and normalized to the control‐treated cells. Error bars representSD , n = 3. Statistical significance was tested using a paired two‐tailed t‐test (NS P > 0.05, *P ≤ 0.05).FLAG ‐Asf1A‐4D‐inducible U2OS cells were treated, synchronized in G2 by a single thymidine block and damaged in G2 by 0.5 μM adriamycin for 1 h, and were released for 16 h. Expression was induced by addition of doxycycline.mRNA was isolated and analyzed byqPCR . Error bars represent theSD of three independent experiments, n = 2.Cells were treated as in (D), and samples were analyzed by Western blot with the indicated antibodies.
Similar articles
-
Amplification of TLK2 Induces Genomic Instability via Impairing the G2-M Checkpoint.Mol Cancer Res. 2016 Oct;14(10):920-927. doi: 10.1158/1541-7786.MCR-16-0161. Epub 2016 Aug 3. Mol Cancer Res. 2016. PMID: 27489360 Free PMC article.
-
Tousled-like kinase 2 targets ASF1 histone chaperones through client mimicry.Nat Commun. 2022 Feb 8;13(1):749. doi: 10.1038/s41467-022-28427-0. Nat Commun. 2022. PMID: 35136069 Free PMC article.
-
Tousled-like kinases phosphorylate Asf1 to promote histone supply during DNA replication.Nat Commun. 2014 Mar 6;5:3394. doi: 10.1038/ncomms4394. Nat Commun. 2014. PMID: 24598821 Free PMC article.
-
Chromatin regulators and their impact on DNA repair and G2 checkpoint recovery.Cell Cycle. 2020 Sep;19(17):2083-2093. doi: 10.1080/15384101.2020.1796037. Epub 2020 Jul 30. Cell Cycle. 2020. PMID: 32730133 Free PMC article. Review.
-
The Tousled-like kinases regulate genome and epigenome stability: implications in development and disease.Cell Mol Life Sci. 2019 Oct;76(19):3827-3841. doi: 10.1007/s00018-019-03208-z. Epub 2019 Jul 13. Cell Mol Life Sci. 2019. PMID: 31302748 Free PMC article. Review.
Cited by
-
EB 2017 Article: Soy protein isolate feeding does not result in reproductive toxicity in the pre-pubertal rat testis.Exp Biol Med (Maywood). 2018 May;243(8):695-707. doi: 10.1177/1535370218771333. Exp Biol Med (Maywood). 2018. PMID: 29763383 Free PMC article.
-
PHF6 promotes non-homologous end joining and G2 checkpoint recovery.EMBO Rep. 2020 Jan 7;21(1):e48460. doi: 10.15252/embr.201948460. Epub 2019 Nov 29. EMBO Rep. 2020. PMID: 31782600 Free PMC article.
-
Targeting TLK2 inhibits the progression of gastric cancer by reprogramming amino acid metabolism through the mTOR/ASNS axis.Cancer Gene Ther. 2023 Nov;30(11):1485-1497. doi: 10.1038/s41417-023-00653-8. Epub 2023 Aug 4. Cancer Gene Ther. 2023. PMID: 37542132
-
Inactive Tlk associating with Tak1 increases p38 MAPK activity to prolong the G2 phase.Sci Rep. 2019 Feb 13;9(1):1885. doi: 10.1038/s41598-018-36137-1. Sci Rep. 2019. PMID: 30760733 Free PMC article.
-
Identification of the proteome complement of humanTLK1 reveals it binds and phosphorylates NEK1 regulating its activity.Cell Cycle. 2017 May 19;16(10):915-926. doi: 10.1080/15384101.2017.1314421. Epub 2017 Apr 20. Cell Cycle. 2017. PMID: 28426283 Free PMC article.
References
-
- Shaltiel IA, Krenning L, Bruinsma W, Medema RH (2015) The same, only different – DNA damage checkpoints and their reversal throughout the cell cycle. J Cell Sci 128: 607–620 - PubMed
-
- Smits VA, Klompmaker R, Arnaud L, Rijksen G, Nigg EA, Medema RH (2000) Polo‐like kinase‐1 is a target of the DNA damage checkpoint. Nat Cell Biol 2: 672–676 - PubMed
-
- Wiebusch L, Hagemeier C (2010) p53‐ and p21‐dependent premature APC/C‐Cdh1 activation in G2 is part of the long‐term response to genotoxic stress. Oncogene 29: 3477–3489 - PubMed
-
- Spurgers KB, Gold DL, Coombes KR, Bohnenstiehl NL, Mullins B, Meyn RE, Logothetis CJ, McDonnell TJ (2006) Identification of cell cycle regulatory genes as principal targets of p53‐mediated transcriptional repression. J Biol Chem 281: 25134–25142 - PubMed
MeSH terms
Substances
LinkOut - more resources
Full Text Sources
Other Literature Sources
