. 2016 Feb 28;144(8):084115.
doi: 10.1063/1.4942499.

Multiscale simulation of ideal mixtures using smoothed dissipative particle dynamics

Affiliations

Multiscale simulation of ideal mixtures using smoothed dissipative particle dynamics

Nikolai D Petsev et al. J Chem Phys. .

Abstract

Smoothed dissipative particle dynamics (SDPD) [P. Español and M. Revenga, Phys. Rev. E 67, 026705 (2003)] is a thermodynamically consistent particle-based continuum hydrodynamics solver that features scale-dependent thermal fluctuations. We obtain a new formulation of this stochastic method for ideal two-component mixtures through a discretization of the advection-diffusion equation with thermal noise in the concentration field. The resulting multicomponent approach is consistent with the interpretation of the SDPD particles as moving volumes of fluid and reproduces the correct fluctuations and diffusion dynamics. Subsequently, we provide a general multiscale multicomponent SDPD framework for simulations of molecularly miscible systems spanning length scales from nanometers to the non-fluctuating continuum limit. This approach reproduces appropriate equilibrium properties and is validated with simulation of simple one-dimensional diffusion across multiple length scales.


Figures

FIG. 1.
FIG. 1.
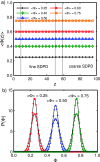
Concentration probability distributions obtained from simulations using multicomponent SDPD (colored markers) as compared to the analytical result (black curves), given by a Gaussian with variance given by Eq. (31). Solutions with three different average concentrations are simulated, Φ=0.25 (circle markers), 0.50 (triangles), and 0.75 (squares). For each concentration, we also consider three different particle masses, m = 25 (red markers), 100 (green), and 200 (blue). The results shown are for the fixed-position tests; simulation results for the case where particle positions evolve in time do not show any appreciable difference and are omitted for clarity.
FIG. 2.
FIG. 2.
Depiction of the multiscale SDPD simulation interface region between fluids with different resolutions. The “fine” SDPD fluid has smoothing length and mass h1 and m1, respectively. The “coarse” fluid in this example has a smoothing length of h2 and mass of m2 = 2m1. The interface is divided into three parts: (1) refining, (2) overlap, and (3) coarsening subdomains. Once a large particle crosses into the refining region, it splits into two small SDPD particles each having half the mass of the parent particle. When a small particle crosses into the coarsening region, it is combined with another nearby particle into a large one. Large and small particles coexist within the overlap domain.
FIG. 3.
FIG. 3.
(a) Visualization of equilibrium multiscale SDPD simulation. The left bulk region (white particles) is the finely resolved SDPD fluid with smoothing length h = 6.0, and the particles on the right (orange) are the coarse ones with h = 7.5. These coarse particles are twice as massive as the fine ones, and their number density is half as much. Periodic boundary conditions are used for the x-, y-, and z-directions. (b) The corresponding smoothing length versus position for an equilibrium multiscale SDPD simulation. The interface regions are located between z = 0.0 and 9.0 and between z = 50.0 and 59.0.
FIG. 4.
FIG. 4.
(a) Concentration profiles for equilibrium multiscale SDPD simulations. We have performed tests at several different average concentrations, Φ=0.25, 0.40, 0.50, 0.60, and 0.75, where the results from each simulation are shown with a different marker/color. (b) Concentration probability distributions from equilibrium multiscale simulations. For clarity, we show results for three of the five cases: Φ=0.25 (red/square markers), 0.50 (blue/triangle markers), and 0.75 (green/circle markers). The solid markers represent the probability distribution in the “coarse” SDPD region, and the hollow markers represent the “fine” SDPD region. The black curves are the exact analytical solution. The distributions for Φ=0.40 and 0.60 are omitted for clarity.
FIG. 5.
FIG. 5.
Concentration profile at different times for the quasi-one-dimensional diffusion problem across multiple length scales. A fluid region is situated between two walls, and the fluid itself is divided into finely resolved and coarse-grained domains, where particles have masses m = 100 and m = 200, respectively. After equilibrating, a concentration gradient is imposed by holding the concentration fixed at 0.4 at the left boundary and 0.6 at the right boundary, and the time-evolution of the concentration profile is computed. The numerical results (blue curve and circle markers) are shown against the exact solution of the non-fluctuating diffusion equation (black curve).

References

    1. Español P. and Revenga M., Phys. Rev. E 67, 026705 (2003).10.1103/physreve.67.026705 - DOI - PubMed
    1. Litvinov S., Hu X. Y., and Adams N. A., J. Phys. Condens. Matter 23, 184118 (2011).10.1088/0953-8984/23/18/184118 - DOI - PubMed
    1. Vázquez-Quesada A., Ellero M., and Español P., J. Chem. Phys. 130, 034901 (2009).10.1063/1.3050100 - DOI - PubMed
    1. Moreno N., Vignal P., Li J., and Calo V. M., Procedia Comput. Sci. 18, 2565 (2013).10.1016/j.procs.2013.05.442 - DOI
    1. Müller K., Fedosov D. A., and Gompper G., Sci. Rep. 4, 4871 (2014).10.1038/srep04871 - DOI - PMC - PubMed

Publication types