

Cells release subpopulations of exosomes with distinct molecular and biological properties
- PMID: 26931825
- PMCID: PMC4773763
- DOI: 10.1038/srep22519
Cells release subpopulations of exosomes with distinct molecular and biological properties
Abstract
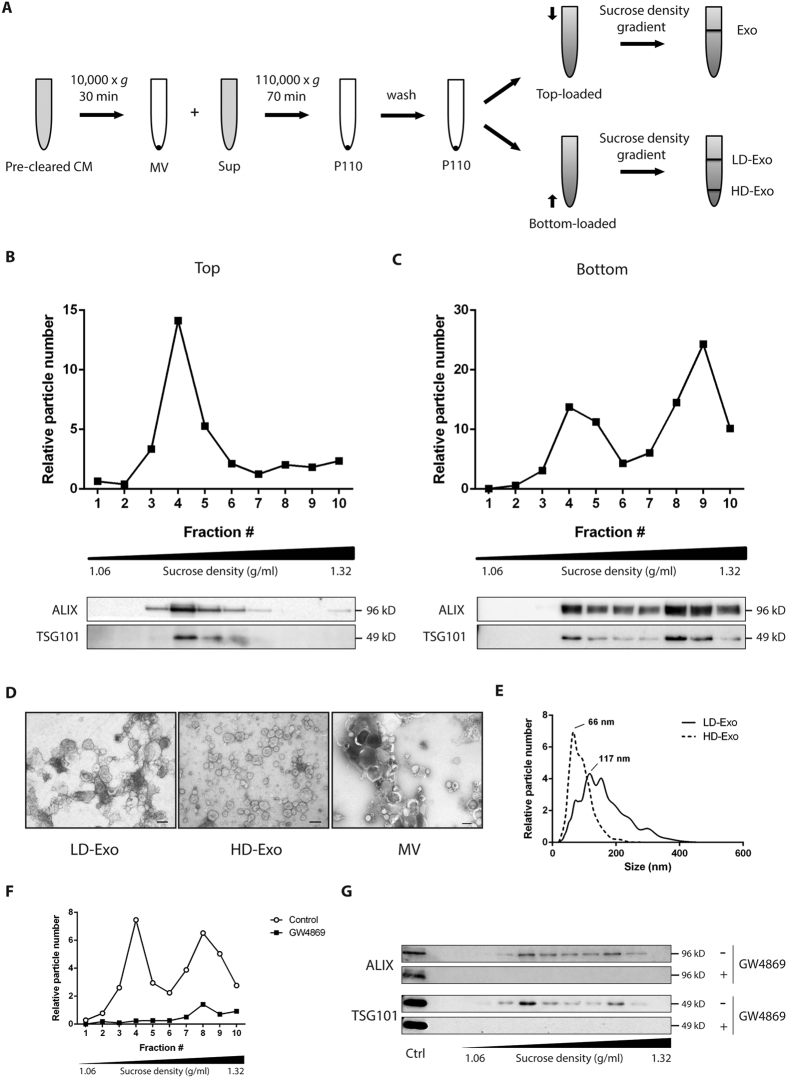
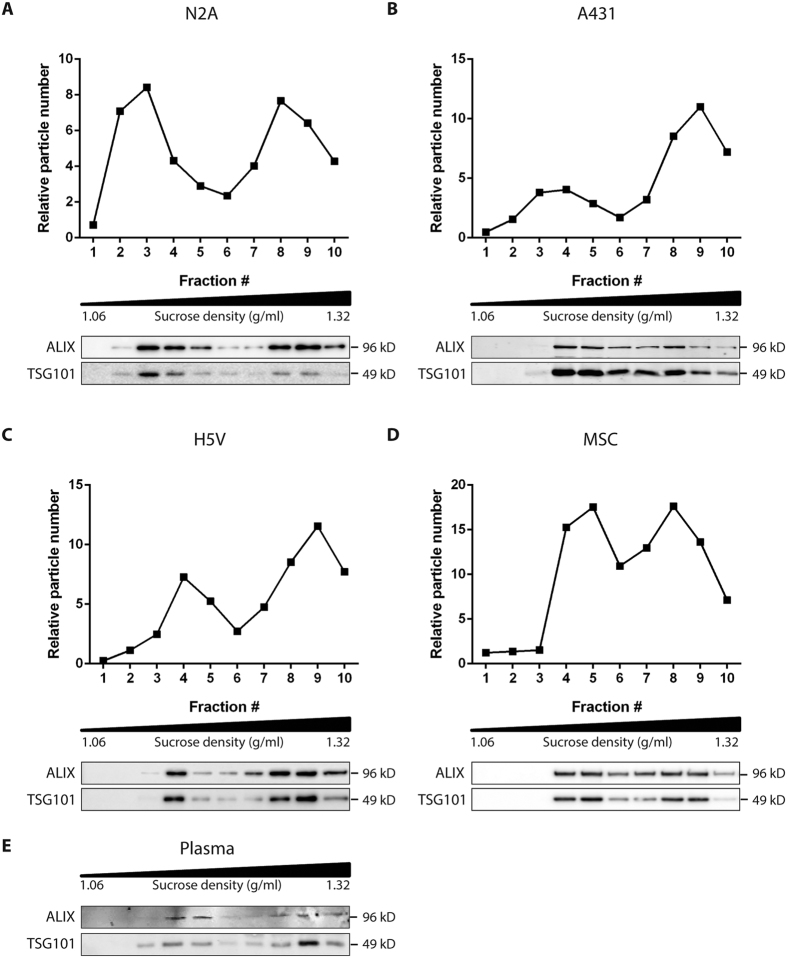
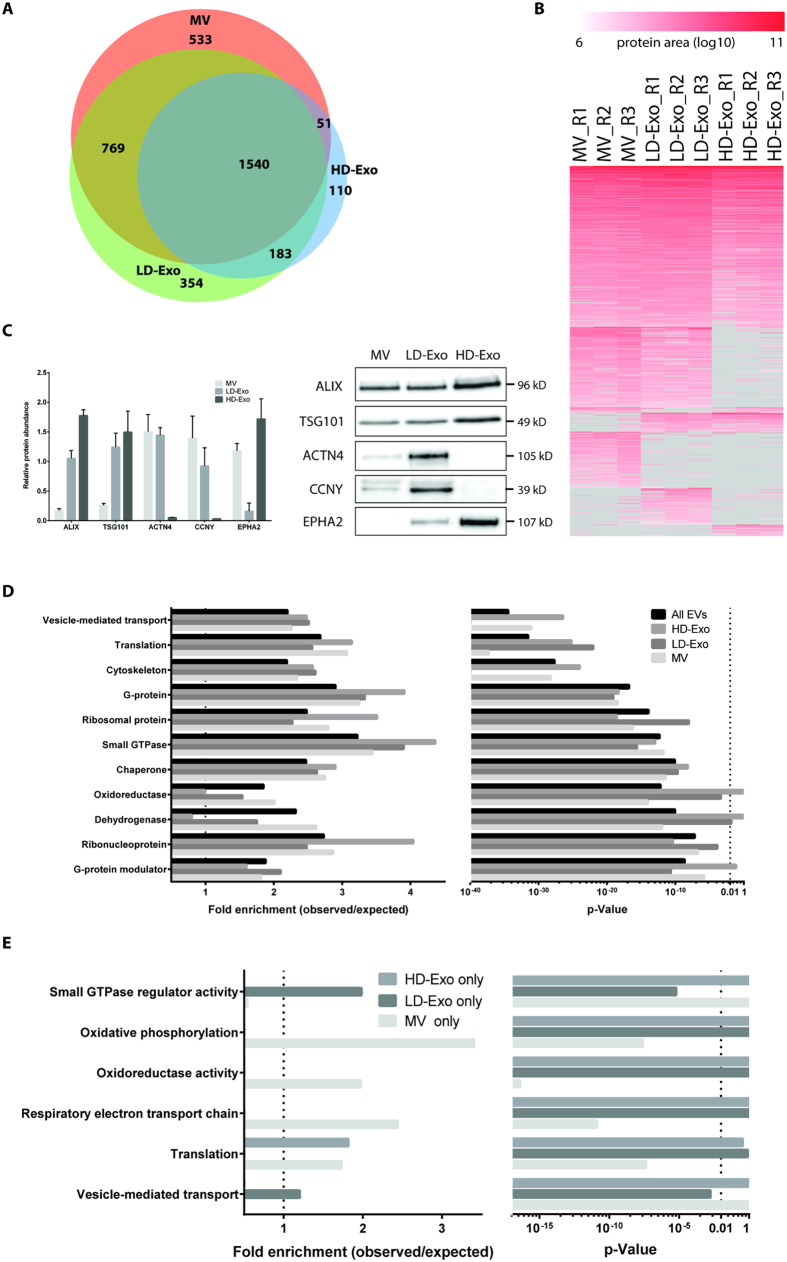
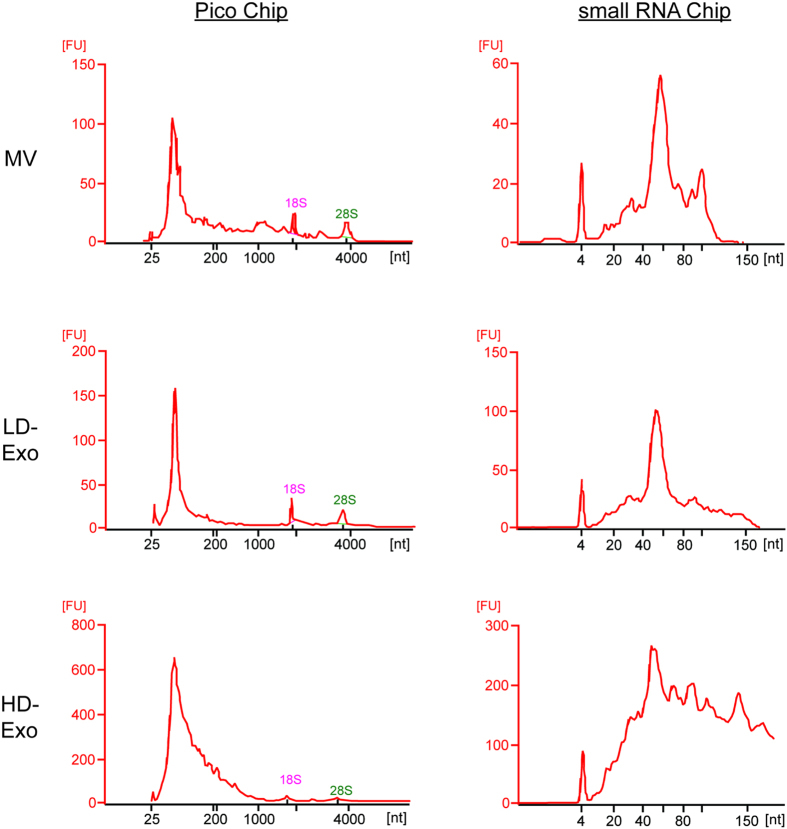
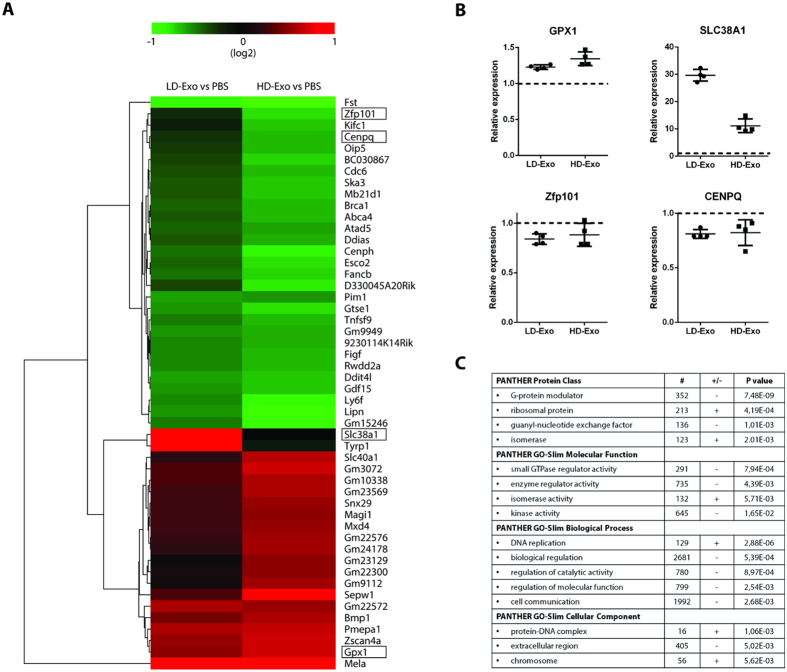
Cells release nano-sized membrane vesicles that are involved in intercellular communication by transferring biological information between cells. It is generally accepted that cells release at least three types of extracellular vesicles (EVs): apoptotic bodies, microvesicles and exosomes. While a wide range of putative biological functions have been attributed to exosomes, they are assumed to represent a homogenous population of EVs. We hypothesized the existence of subpopulations of exosomes with defined molecular compositions and biological properties. Density gradient centrifugation of isolated exosomes revealed the presence of two distinct subpopulations, differing in biophysical properties and their proteomic and RNA repertoires. Interestingly, the subpopulations mediated differential effects on the gene expression programmes in recipient cells. In conclusion, we demonstrate that cells release distinct exosome subpopulations with unique compositions that elicit differential effects on recipient cells. Further dissection of exosome heterogeneity will advance our understanding of exosomal biology in health and disease and accelerate the development of exosome-based diagnostics and therapeutics.
Figures
Similar articles
-
Extracellular Vesicle Heterogeneity: Subpopulations, Isolation Techniques, and Diverse Functions in Cancer Progression.Front Immunol. 2018 Apr 30;9:738. doi: 10.3389/fimmu.2018.00738. eCollection 2018. Front Immunol. 2018. PMID: 29760691 Free PMC article. Review.
-
Distinct RNA profiles in subpopulations of extracellular vesicles: apoptotic bodies, microvesicles and exosomes.J Extracell Vesicles. 2013 Sep 12;2. doi: 10.3402/jev.v2i0.20677. eCollection 2013. J Extracell Vesicles. 2013. PMID: 24223256 Free PMC article.
-
Liposome co-incubation with cancer cells secreted exosomes (extracellular vesicles) with different proteins expressions and different uptake pathways.Sci Rep. 2018 Sep 27;8(1):14493. doi: 10.1038/s41598-018-32861-w. Sci Rep. 2018. PMID: 30262875 Free PMC article.
-
Extracellular vesicles- crucial players in human pregnancy.Placenta. 2023 Sep 7;140:30-38. doi: 10.1016/j.placenta.2023.07.006. Epub 2023 Jul 26. Placenta. 2023. PMID: 37531747 Review.
-
A Protocol for Isolation, Purification, Characterization, and Functional Dissection of Exosomes.Methods Mol Biol. 2021;2261:105-149. doi: 10.1007/978-1-0716-1186-9_9. Methods Mol Biol. 2021. PMID: 33420988
Cited by
-
Exosome: A Review of Its Classification, Isolation Techniques, Storage, Diagnostic and Targeted Therapy Applications.Int J Nanomedicine. 2020 Sep 22;15:6917-6934. doi: 10.2147/IJN.S264498. eCollection 2020. Int J Nanomedicine. 2020. PMID: 33061359 Free PMC article. Review.
-
Understanding extracellular vesicle and nanoparticle heterogeneity: Novel methods and considerations.Proteomics. 2021 Jul;21(13-14):e2000118. doi: 10.1002/pmic.202000118. Epub 2021 May 3. Proteomics. 2021. PMID: 33857352 Free PMC article. Review.
-
Extracellular vesicles biogenesis, isolation, manipulation and genetic engineering for potential in vitro and in vivo therapeutics: An overview.Front Bioeng Biotechnol. 2022 Nov 4;10:1019821. doi: 10.3389/fbioe.2022.1019821. eCollection 2022. Front Bioeng Biotechnol. 2022. PMID: 36406206 Free PMC article. Review.
-
Do extracellular vesicles have specific target cells?; Extracellular vesicle mediated embryo maternal communication.Front Mol Biosci. 2024 Jul 16;11:1415909. doi: 10.3389/fmolb.2024.1415909. eCollection 2024. Front Mol Biosci. 2024. PMID: 39081929 Free PMC article.
-
Extracellular Vesicles from Animal Milk: Great Potentialities and Critical Issues.Animals (Basel). 2022 Nov 22;12(23):3231. doi: 10.3390/ani12233231. Animals (Basel). 2022. PMID: 36496752 Free PMC article. Review.
References
-
- E. L. Andaloussi S., Mager I., Breakefield X. O. & Wood M.J. Extracellular vesicles: biology and emerging therapeutic opportunities. Nat Rev Drug Discov 12, 347–57 (2013). - PubMed
-
- Lee Y., El Andaloussi S. & Wood M. J. Exosomes and microvesicles: extracellular vesicles for genetic information transfer and gene therapy. Hum Mol Genet 21, R125–34 (2012). - PubMed
-
- Al-Nedawi K. et al.. Intercellular transfer of the oncogenic receptor EGFRvIII by microvesicles derived from tumour cells. Nat Cell Biol 10, 619–24 (2008). - PubMed
Publication types
MeSH terms
Grants and funding
LinkOut - more resources
Full Text Sources
Other Literature Sources
Molecular Biology Databases
