. 2016 Mar 2:6:22378.
doi: 10.1038/srep22378.

Cyclophilin A (CypA) Plays Dual Roles in Regulation of Bone Anabolism and Resorption

Affiliations

Cyclophilin A (CypA) Plays Dual Roles in Regulation of Bone Anabolism and Resorption

Mian Guo et al. Sci Rep. .

Abstract

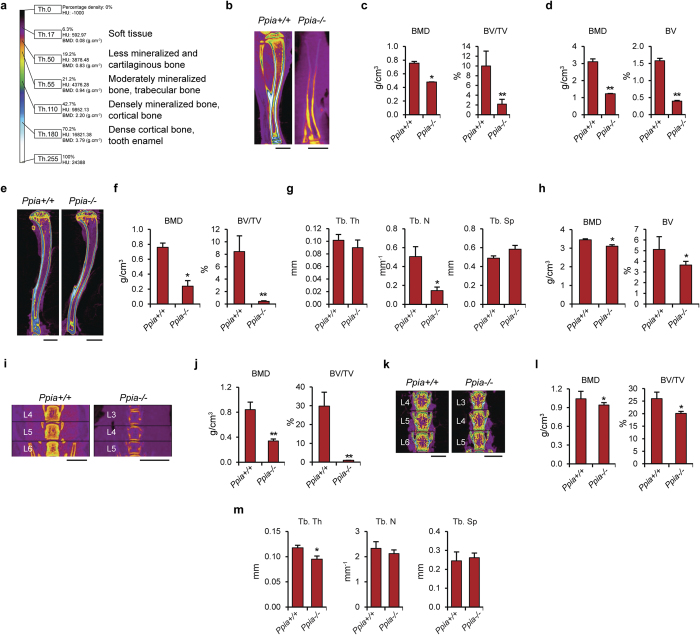
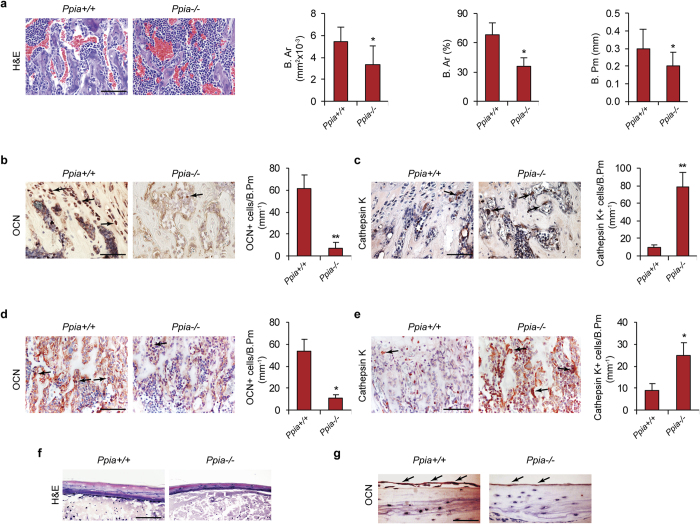
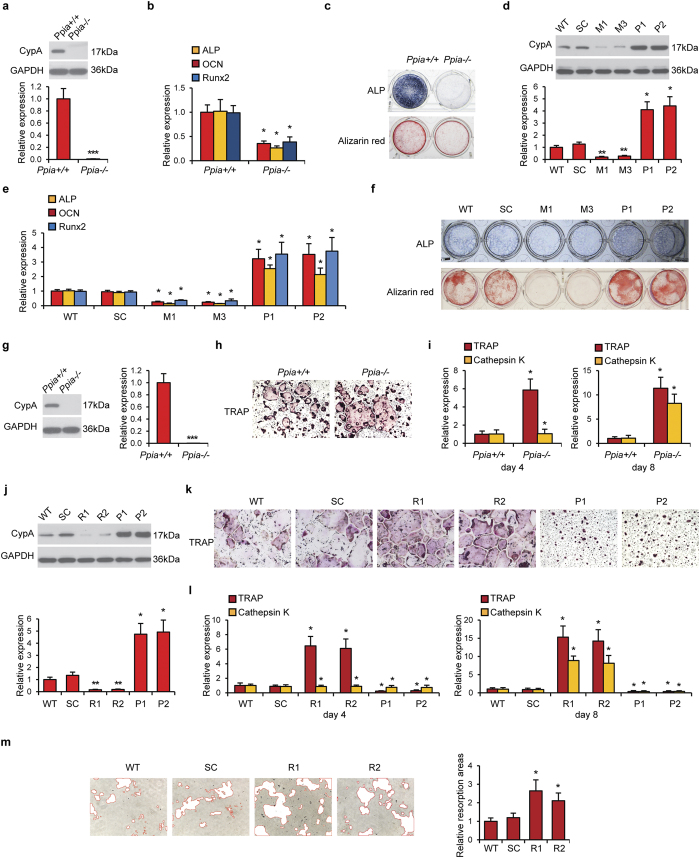
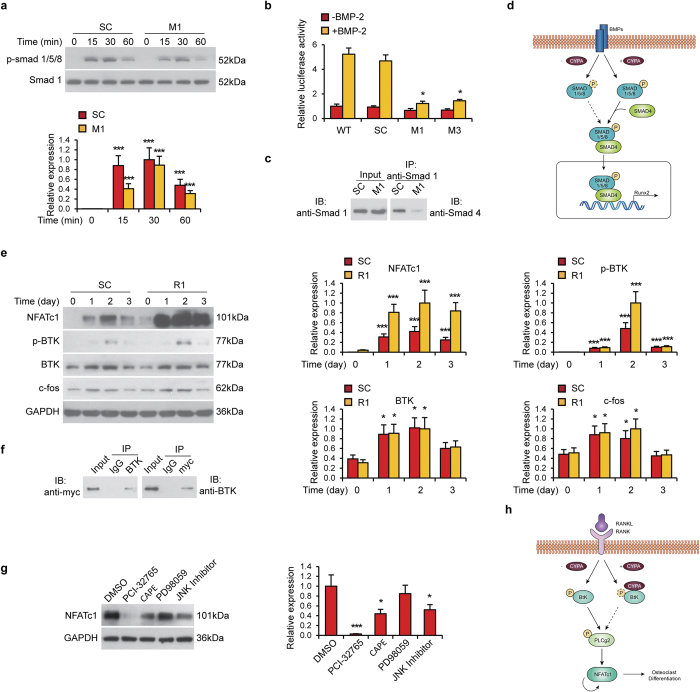
CypA (Cyclophilin A) is a peptidyl-prolyl isomerase previously shown to be required for chondrogenic differentiation and endochondral ossification. However, the effects of CypA on osteoclast activity and bone maintenance are entirely unknown. Here, we show that Ppia(-/-) mice demonstrate low bone mineral density, reduced osteoblast numbers, and increased osteoclast numbers. When isolated from the calvaria, Ppia(-/-) osteoblasts demonstrate decreased osteogenic differentiation, whereas Ppia(-/-) osteoclasts derived from the long bones showed increased osteoclastic activity. Overexpression and gene silencing of CypA verified osteogenic and anti-osteoclastic effects. In osteoblasts, CypA is necessary for BMP-2 (Bone Morphogenetic Protein-2)-induced Smad phosphorylation. In osteoclasts, loss of CypA activates BtK (Bruton's tyrosine kinase) and subsequently integrates with TRAF6 (TNF receptor-associated factor 6) and/or c-fos signaling to induce NFATc1 (nuclear factors of activated T cells, cytoplasmic 1). Collectively, CypA dually exerts pro-osteogenic and anti-osteoclastic effects. Thus, modulation of CypA may be useful in future efforts targeting osteoporosis.


Figures

Figure 1
Figure 1. MicroCT analysis of Ppia+/+ and Ppia−/− mice.
(a) Color scale bar is shown to indicate threshold, HU and BMD values, and tissue types correspondent to select colors. (b) Mid-coronal cross sectional images of the tibia from three-week old Ppia+/+ and Ppia−/− mice. Image is color-coded based on tissue density level. Ppia−/− tibias showed an average of 26% reduction in length. Scale bars: 2 mm. (c) Quantification of trabecular BMD (bone mineral density) and percent bone volume (BV/TV) in the distal tibia. (d) Cortical BMD and BV (bone volume) in the tibial shaft. (e) Overview mid-coronal cross sectional images of the proximal tibia from 13-week old mice. The Ppia−/− tibias showed an average of 11% reduction in length. Scale bars, 2 mm. (f) Quantification of trabecular BMD and BV/TV in the proximal tibia. (g) Quantification of Tb. Th (trabecular bone thickness), Tb. N (trabecular number) and Tb. Sp (trabecular space) in the proximal tibia, 13 weeks. (h) Cortical BMD and BV in the tibial shaft. (i) Mid-coronal cross sectional images of the lumbar vertebrae from three-week old Ppia+/+ and Ppia−/− mice. Ppia−/− vertebral bodies (at the three terminal lumbar vertebrae analyzed) showed an average of 40% reduction in height with visible reduction in bone quality (volume, density, and structure) compared to WT. Scale bars: 1 mm. (j) BMD and BV/TV in the lumbar vertebrae. (k) Mid-coronal cross sectional images of the lumbar vertebrae from 13-week old Ppia+/+ and Ppia−/− mice. Ppia−/− vertebral bodies (at the three terminal lumbar vertebrae analyzed) showed an average of 13% reduction in height with visible reduction in bone quality (volume, density, and structure) compared to WT. Scale bars: 1 mm. (l) BMD and BV/TV in the lumbar vertebrae. (m) Quantification of Tb. Th, Tb. N and Tb. Sp in the lumbar vertebrae. n = 6 for WT group at 3 and 13 weeks old. n = 5 for KO group at 3 weeks old. n = 4 for KO group at 13 weeks old. *P < 0.05, **P < 0.01 compared to Ppia+/+. Data represented as mean and SEM.
Figure 2
Figure 2. Histologic and immunohistochemical analysis in Ppia+/+ and Ppia−/− mice.
(a) Representative images of H&E staining of trabecular bone of the proximal tibia in 3-week old Ppia+/+ and Ppia−/− mice. Quantification of B.Ar (Bone Area), percentage B.Ar, and B.Pm (Bone Perimeter). Scale bar: 100 μm. (b) OCN (Osteocalcin) and (c) Cathepsin K immunohistochemical staining and quantification in 3-week old Ppia+/+ and Ppia−/− mice. Proximal tibia shown. Quantifications expressed as the number of immunoreactive cells per B.Pm. Scale bars: 100 μm. In the case of Cathepsin K staining, only multinucleated bone lining cells were quantified. (d) OCN and (e) Cathepsin K immunohistochemical staining and quantification in newborn Ppia+/+ and Ppia−/− mice. Proximal tibia shown. Quantifications expressed as the number of immunoreactive cells per B.Pm. Scale bars: 100 μm. (f,g) Representative images of the calvaria in 13-week old Ppia+/+ and Ppia−/− mice, including (f) H&E and (g) OCN immunostaining. Black arrows indicate examples of immunoreactivity. N = 4 in each group. Scale bars: 50 μm. *P < 0.05, **P < 0.01 compared to Ppia+/+ mice. Data represented as mean and SEM.
Figure 3
Figure 3. Differentiation of osteoblasts and osteoclasts with CypA dysregulation.
(a) Western blot of CypA in Ppia+/+ and Ppia−/− primary osteoblastic cells. GAPDH was used as a loading control. (b) ALP, OCN and Runx2 expression in Ppia+/+ and Ppia−/− osteoblastic cells after seven days of osteogenic differentiation. (c) ALP and Alizarin red staining in Ppia+/+ and Ppia−/− osteoblastic cells after seven and 21 days of osteogenic differentiation, respectively. (d) CypA levels assayed in MC3T3-E1 osteoblastic cells after silencing or forced overexpression. Two clones for CypA silencing are referred to as M1 and M3, while two clones for overexpression are designated P1 and P2 (comparison include scrambled control, SC, and wildtype parental cells, WT). (e) ALP, OCN and Runx2 expression in WT, SC, M1, M3, P1 and P2 MC3T3-E1 cells after seven days of osteogenic differentiation. (f) ALP and Alizarin red staining in WT, SC, M1, M3, P1 and P2 MC3T3-E1 cells during osteogenic differentiation. (g) Expression of CypA in Ppia+/+ and Ppia−/− mouse primary osteoclastic cells. (h) TRAP staining of Ppia+/+ and Ppia−/− osteoclast cells after seven days of osteoclastic induction. (i) TRAP and Cathepsin K expression in Ppia+/+ and Ppia−/− osteoclastic cells after four and eight days osteoclastic induction. Magnification: 10 ×. (j) CypA levels assayed in RAW264.7 osteoclastic cells after silencing or forced overexpression. Two clones for CypA silencing are referred to as R1 and R2, while two clones for overexpression are designated P1 and P2 (comparison include scrambled control, SC, and wildtype parental cells, WT). (k) TRAP staining in (j). Magnification: 10×. (l) TRAP and Cathepsin K expression in WT, SC, R1, R2, P1 and P2 RAW264.7 osteoclastic cells after four and eight days osteoclastic induction. Data represented as mean and SD of three experiments of each group. (m) Resorptive activity assay in WT, SC, R1 and R2 RAW264.7 cells after seven days of osteoclastic induction. Resorptive areas are highlighted in red at 10× magnification. *P < 0.05 compared to Ppia+/+ or WT cells.
Figure 4
Figure 4. CypA affects mouse osteoblast and osteoclast via different signaling pathways.
(ad) CypA regulation of BMP-2 induced Smad phosphorylation in osteoblastic cells. (a) SC and M1 MC3T3-E1 osteoblastic cells were treated with BMP-2. Cells were harvested for western blot of p-Smad1/5/8 expression at various timepoints. Smad1 was used as a loading control. (b) Id1 Luciferase activity of WT, SC, M1 and M2 cells in the presence of BMP2. Data represented as mean and SEM from three independent experiments. *P < 0.05 by one way ANOVA analysis, compared to WT cells in the same group. (c) Co-immunoprecipitation between Smad1 and Smad4 in SC and M1 MC3T3-E1 osteoblastic cells. (d) Schematic diagram of CypA in osteoblastic differentiation. E-H CypA regulation of downstream signaling in osteoclastic cells. (e) p-BTK, BTK, c-fos and NFATc1 levels in SC and R1 RAW263.7 osteoclastic cells during osteoclastic induction at various timepoints as assessed by western blot. GAPDH was used as a loading control. (f) Myc-tag CypA plasmid was transfected into RAW264.7 cells for two days, follow by co-immunoprecipitation assay between myc-CypA and BTK. (g) NFATc1 levels in differentiated RAW264.7 cells (R1 clone) treated with PCI-32765, CAPE, PD98059 or JNK inhibitor for two days. GAPDH was used as a loading control. (h) Schematic diagram of CypA in osteoclastic differentiation.

References

    1. Becker D. J., Kilgore M. L. & Morrisey M. A. The societal burden of osteoporosis. Curr. Rheumatol. Rep. 12, 186–191 (2010). - PubMed
    1. Rasmussen H. & Bordier P. The cellular basis of metabolic bone disease. N. Engl. J. Med. 289, 25–32 (1973). - PubMed
    1. Mellis D. J., Itzstein C., Helfrich M. H. & Crockett J. C. The skeleton: a multi-functional complex organ: the role of key signalling pathways in osteoclast differentiation and in bone resorption. J. Endocrinol. 211, 131–143 (2011). - PubMed
    1. Canalis E., Giustina A. & Bilezikian J. P. Mechanisms of anabolic therapies for osteoporosis. N. Engl. J. Med. 357, 905–916 (2007). - PubMed
    1. Lu K. P., Finn G., Lee T. H. & Nicholson L. K. Prolyl cis-trans isomerization as a molecular timer. Nat. Chem. Biol. 3, 619–629 (2007). - PubMed

Publication types

MeSH terms

LinkOut - more resources