. 2016 Mar 2:6:22525.
doi: 10.1038/srep22525.

Integrated metabolomics and metagenomics analysis of plasma and urine identified microbial metabolites associated with coronary heart disease

Affiliations

Integrated metabolomics and metagenomics analysis of plasma and urine identified microbial metabolites associated with coronary heart disease

Qiang Feng et al. Sci Rep. .

Abstract

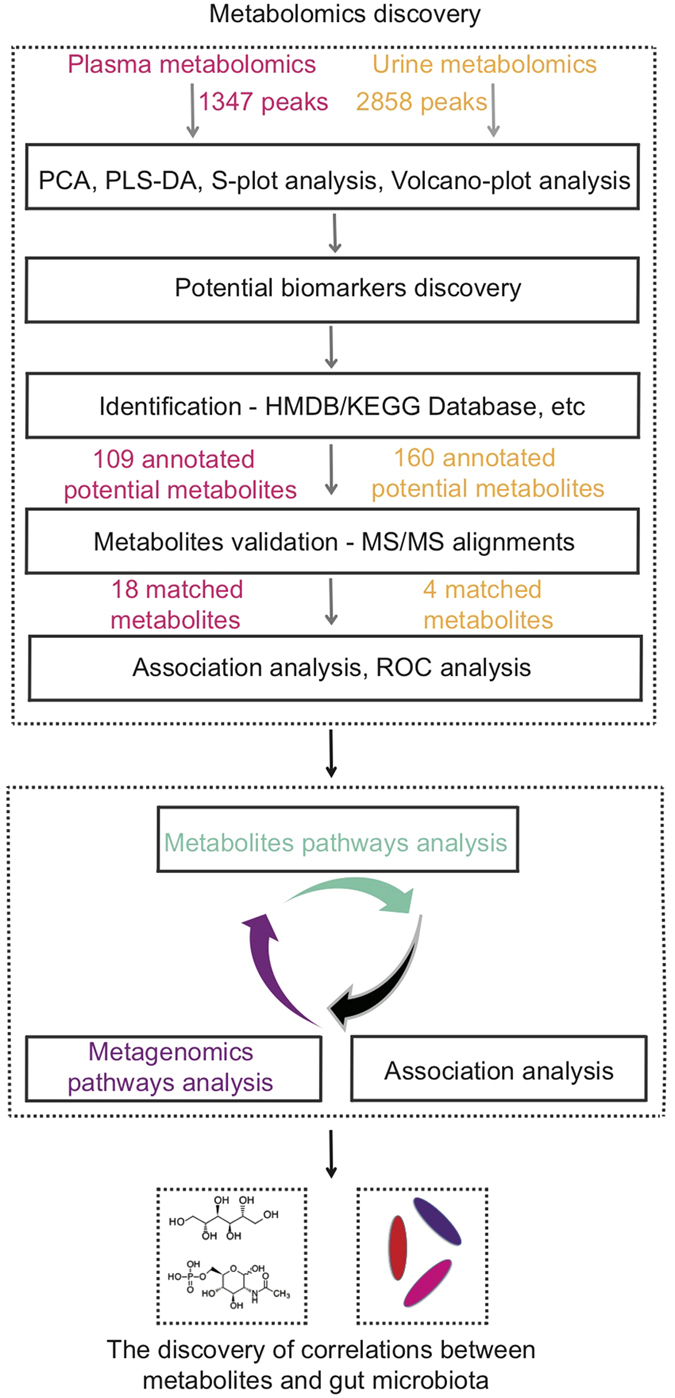
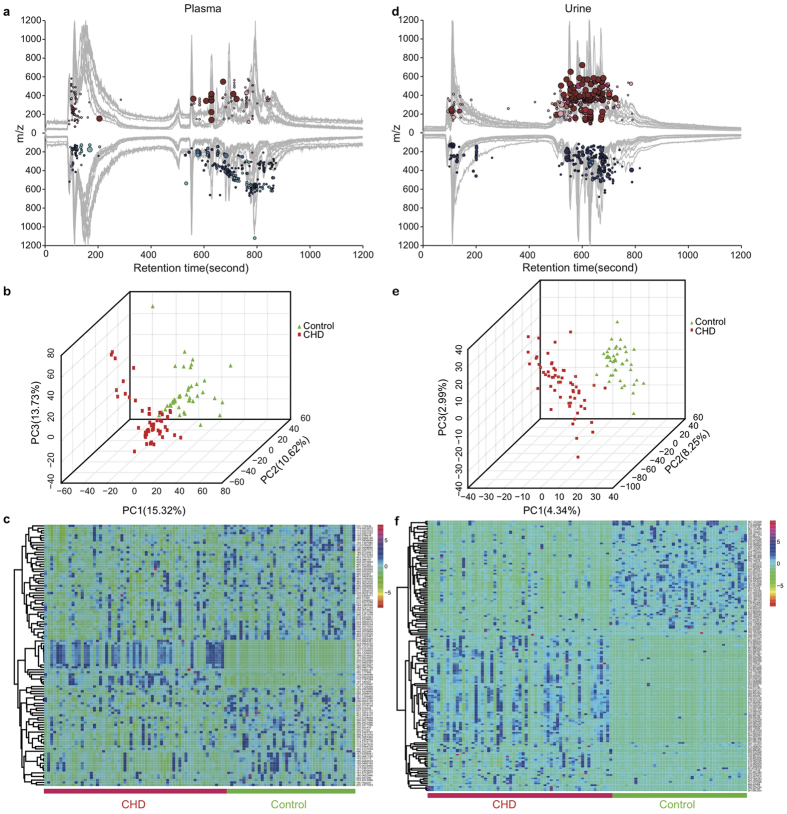
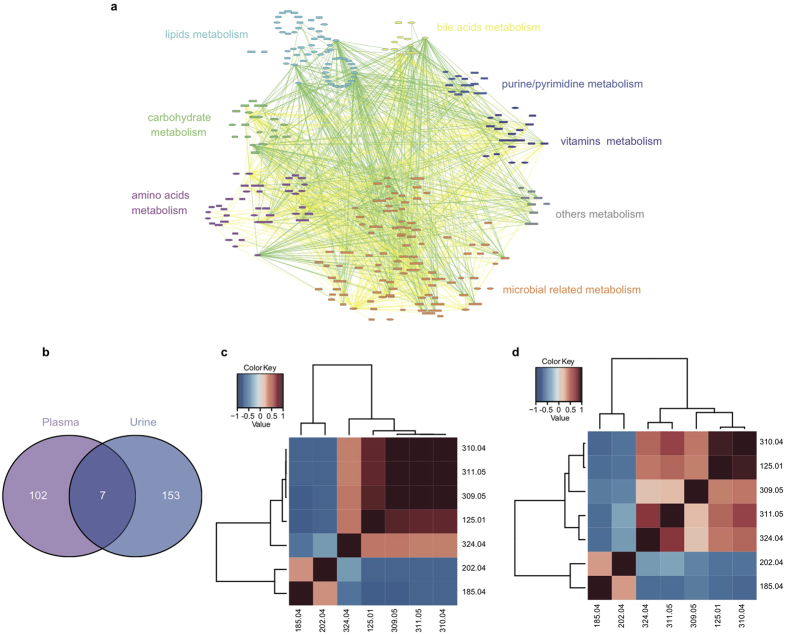
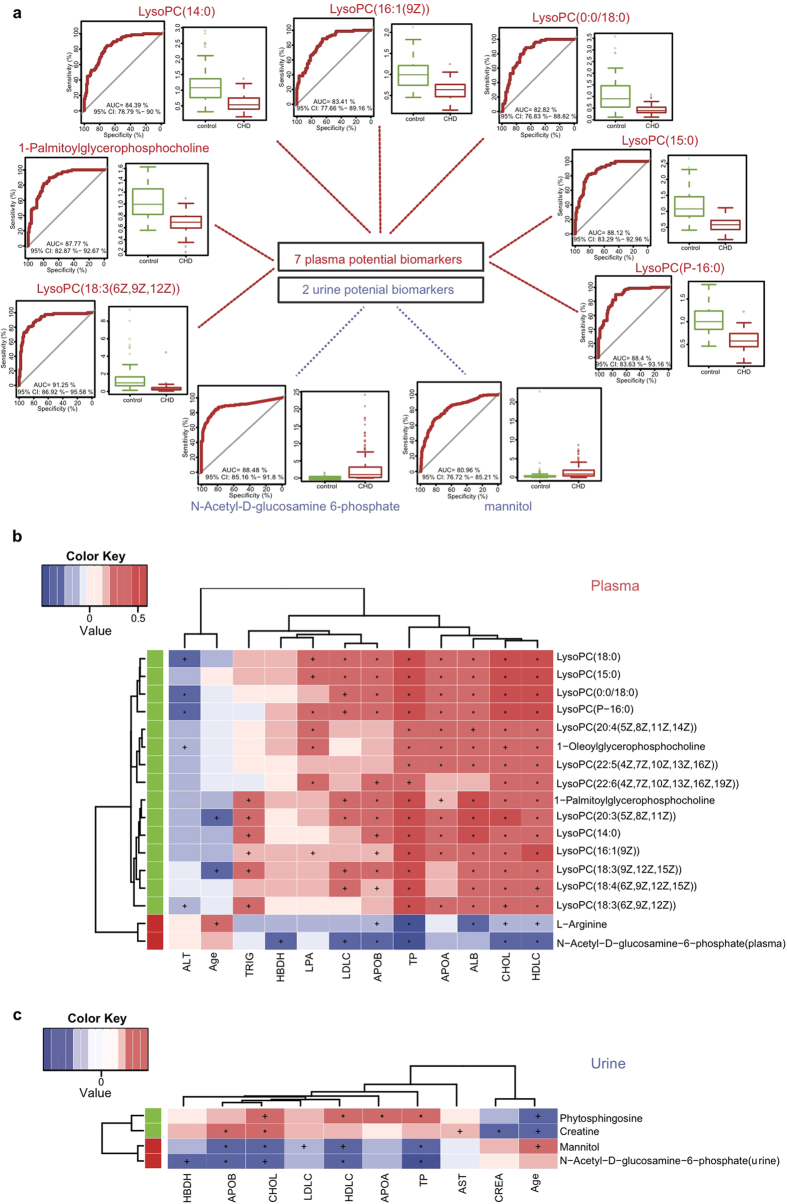
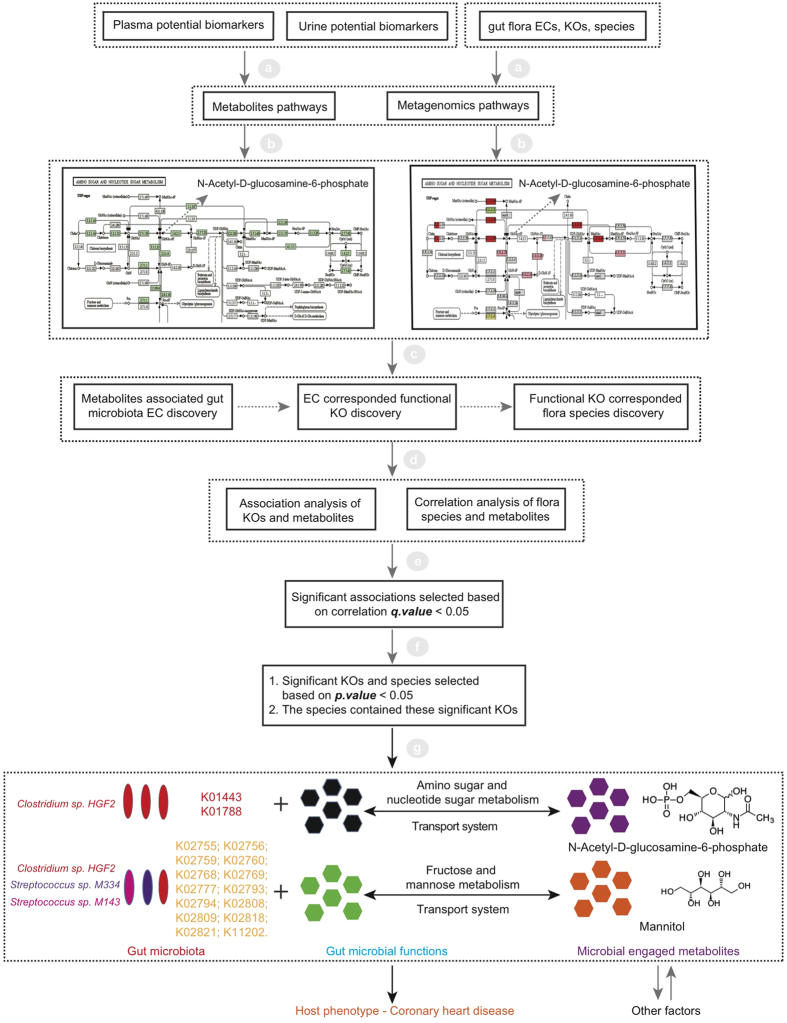
Coronary heart disease (CHD) is top risk factor for health in modern society, causing high mortality rate each year. However, there is no reliable way for early diagnosis and prevention of CHD so far. So study the mechanism of CHD and development of novel biomarkers is urgently needed. In this study, metabolomics and metagenomics technology are applied to discover new biomarkers from plasma and urine of 59 CHD patients and 43 healthy controls and trace their origin. We identify GlcNAc-6-P which has good diagnostic capability and can be used as potential biomarkers for CHD, together with mannitol and 15 plasma cholines. These identified metabolites show significant correlations with clinical biochemical indexes. Meanwhile, GlcNAc-6-P and mannitol are potential metabolites originated from intestinal microbiota. Association analysis on species and function levels between intestinal microbes and metabolites suggest a close correlation between Clostridium sp. HGF2 and GlcNAc-6-P, Clostridium sp. HGF2, Streptococcus sp. M143, Streptococcus sp. M334 and mannitol. These suggest the metabolic abnormality is significant and gut microbiota dysbiosis happens in CHD patients.


Figures

Figure 1
Figure 1. Overview of the study.
Non-targeted metabolomics technique is performed to discover potential metabolites in plasma and urine samples. Statistical and bioinformatics methods are used to identify significantly different metabolites that can discriminate CHD cases from healthy controls. Hierarchical cluster analysis (HCA) is performed to identify metabolites clusters contributing to phenotype separation and spearman correlation analysis is applied to identify potential biomarkers’ correlations related to abnormal functions. Pathway analysis and association analysis of potential biomarkers and gut flora are then applied. Finally, potential biomarkers associated gut flora species are discovered. Metagenomics technology is applied to further validate the potential metabolites originated from the fecal metagenomics data of CHD patients and healthy subjects.
Figure 2
Figure 2. Potential biomarkers discovery in plasma and urine metabolomics.
(a) Cloud plot of plasma metabolites profiles demonstrated significant metabolic changes had happened in CHD patients’ plasma. Red and blue circles indicated metabolites with increased (fold change > 1.2, 196 metabolites) and decreased intensity (fold change < 0.8, 319 metabolites) in CHD patients’ plasma samples compared with healthy controls. The darkness of color is correlated with adjusted p.value (named as q.value): color from pink to dark red or cyan to dark blue indicated smaller adjusted p.value. The area of circle is correlated with magnitude of intensity change: In the red part, the bigger the circle was, the more enriched metabolites were in CHD patients’ plasma samples compared with healthy controls’ plasma samples. While in the blue part, the bigger the circle was, the more enriched metabolites were in healthy controls’. (b) Three-dimensional PLS-DA scores plot of plasma samples. It depicted obvious difference between CHD patients’ plasma samples and healthy controls’ plasma samples with PC1(15.32%), PC2(10.62%), PC3(13.73%). (c) Heat map showed the distribution of 109 metabolites that were significantly different between CHD patients’ plasma samples and healthy controls’ plasma samples. The CHD patients’ and healthy control group’s plasma samples were labeled with red and green ribbons and texts respectively. The mass data (m/z) which could be annotated with database such as HMDB, KEGG were listed. (d) Cloud plot of urine metabolites profiles also demonstrated significant metabolic changes happened in CHD patients’ urine. (e) Three-dimensional PLS-DA scores plot of urine samples with PC1(4.34%), PC2(8.25%), PC3(2.99%). (f) Heat map analysis of 160 significantly different metabolites in the urine samples of CHD group and healthy control group.
Figure 3
Figure 3. Correlation analysis of all significant metabolites or seven common metabolites in plasma and urine.
(a) Correlation profile of 109 plasma significant metabolites and 160 urine significant metabolites among CHD samples and control subjects were performed by spearman correlation analysis with Cytoscape software. All these annotated metabolites were distributed by their engaged pathways and metabolisms: lipids metabolism showed significantly negatively correlations with microbial related metabolism. Ellipses were plasma metabolites, round rectangles were urine metabolites. Yellow lines : 0.9 > rho ≥ 0.5, Green lines : rho ≤ −0.5. (b) Veen diagram of all significant differential metabolites in plasma and urine showed there are 7 common significantly changed metabolites. (c) Spearman correlation analysis of 7 metabolites in plasma. (d) Spearman correlation analysis of 7 metabolites in urine.
Figure 4
Figure 4. Receiver operating characteristic (ROC) analysis of potential biomarkers and numeric correlation between clinical phenotype and identified significant metabolites.
(a) ROC analysis and boxplots of 7 identified plasma potential biomarkers and 2 identified urine potential biomarkers with AUC larger than 0.80 in validation datasets. (b) Spearman correlation analysis was performed between 18 plasma identified potential biomarkers and clinical indicators. Red, positive correlation; blue, negative correlation. + , adjusted p.value < 0.05; *, adjusted p.value < 0.01. Red panel indicated increased metabolites in CHD patients while green panel suggested decreased metabolites in CHD patients. Paraxanthine did not show significant correlations with any of the 15 numerical phenotypes (adjusted p.value > 0.05, Spearman’s), creatine kinase MB (CKMB), aspartate transaminase (AST) and creatinine (CREA) did not show significant correlations with any of 18 plasma identified potential biomarkers, both of which were not shown. albumin (ALB), alanine aminotransferase (ALT), total protein (TP), hydroxybutyrate dehydrogenase (HBDH), triglyceride (TRIG), low-density lipoprotein (LDLC), cholesterol (CHOL), high-density lipoprotein (HDLC), apolipoprotein (b) (APOB), apolipoprotein (a) (APOA), lipoprotein (a) (LPA). (c) Spearman correlation analysis was performed between 4 urine identified potential biomarkers and clinical indicators. CKMB, ALB, ALT, TRIG and LPA did not show significant correlations with any of 4 urine identified potential biomarkers were not shown.
Figure 5
Figure 5. A workflow for the discovery of interactions between metabolites and gut microbiota.
Pathways analysis and association analysis among plasma, urine potential biomarkers and gut microbiota were implemented in the workflow. First, plasma and urine potential biomarkers could be obtained in the previous metabolomics studies, the information of gut flora ECs, KOs and species could be attained in the metagenomics study. They could be applied for the metabolic and metagenomics pathways constructions. Second, we could find the metabolites corresponded ECs by analysing the metabolic and metagenomics pathways and get the corresponded KOs by tracing the ECs data, further we could obtain the corresponded species by tracing the KOs data. Third, association analysis would be performed between KOs and metabolites, species and metabolites. Significant correlations would be obtained on the condition of correlation q.value < 0.05. Lastly, in these significant correlations, we further strictly screened these correlations on the conditions that the correlated KOs and species should be significant in the metagenomics data (p.value < 0.05), and the correlated species should contain these significantly correlated KOs. By integrating these metabolomics and metagenomics data, Clostridium sp. HGF2 was found to significantly correlate with GlcNAc-6-P. Clostridium sp. HGF2, Streptococcus sp. M143, Streptococcus sp. M334 were found to significantly associate with mannitol.

References

    1. Graninger D. J. et al.. Metabolomics in coronary heart disease. Heart. Metab 55, 8–12 (2012).
    1. Gorenoi V. et al.. CT coronary angiography vs invasive coronary angiography in CHD. GMS Health Technol Assess 8, 1–16 (2012). - PMC - PubMed
    1. Khan M. et al.. Contraindications and side effects of commonly used medications in coronary CT angiography. Int. J. Cardiovasc. Imaging 27, 441–449 (2011). - PubMed
    1. Huss J. M. et al.. Nuclear receptor signaling and cardiac energetics. Circ. Res 95, 568–578 (2004). - PubMed
    1. Chilton R. J. Pathophysiology of coronary heart disease: a brief review. JAOA 104, S5–S8 (2004). - PubMed

Publication types