

DNA methylation in human epigenomes depends on local topology of CpG sites
- PMID: 26932361
- PMCID: PMC4914085
- DOI: 10.1093/nar/gkw124
DNA methylation in human epigenomes depends on local topology of CpG sites
Abstract
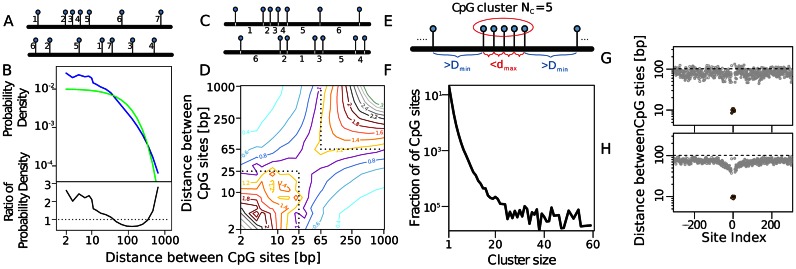
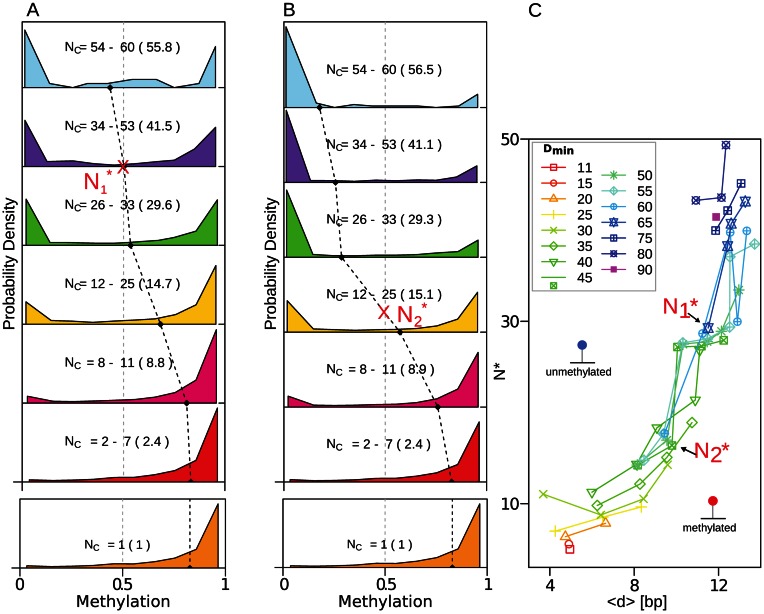
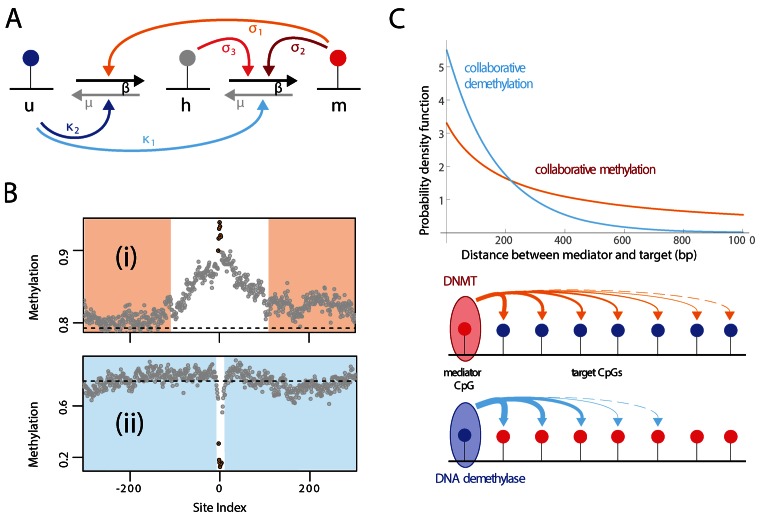
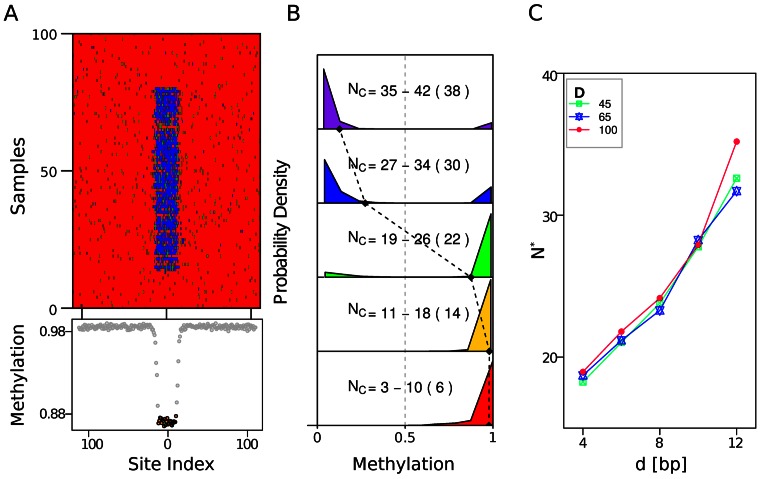
In vertebrates, methylation of cytosine at CpG sequences is implicated in stable and heritable patterns of gene expression. The classical model for inheritance, in which individual CpG sites are independent, provides no explanation for the observed non-random patterns of methylation. We first investigate the exact topology of CpG clustering in the human genome associated to CpG islands. Then, by pooling genomic CpG clusters on the basis of short distances between CpGs within and long distances outside clusters, we show a strong dependence of methylation on the number and density of CpG organization. CpG clusters with fewer, or less densely spaced, CpGs are predominantly hyper-methylated, while larger clusters are predominantly hypo-methylated. Intermediate clusters, however, are either hyper- or hypo-methylated but are rarely found in intermediate methylation states. We develop a model for spatially-dependent collaboration between CpGs, where methylated CpGs recruit methylation enzymes that can act on CpGs over an extended local region, while unmethylated CpGs recruit demethylation enzymes that act more strongly on nearby CpGs. This model can reproduce the effects of CpG clustering on methylation and produces stable and heritable alternative methylation states of CpG clusters, thus providing a coherent model for methylation inheritance and methylation patterning.
© The Author(s) 2016. Published by Oxford University Press on behalf of Nucleic Acids Research.
Figures
Similar articles
-
Nucleosome dynamics and maintenance of epigenetic states of CpG islands.Phys Rev E. 2016 Jun;93(6):062417. doi: 10.1103/PhysRevE.93.062417. Epub 2016 Jun 28. Phys Rev E. 2016. PMID: 27415308
-
Collaboration between CpG sites is needed for stable somatic inheritance of DNA methylation states.Nucleic Acids Res. 2014 Feb;42(4):2235-44. doi: 10.1093/nar/gkt1235. Epub 2013 Nov 27. Nucleic Acids Res. 2014. PMID: 24288373 Free PMC article.
-
Stabilization of epigenetic states of CpG islands by local cooperation.Mol Biosyst. 2016 Jun 21;12(7):2142-6. doi: 10.1039/c6mb00044d. Mol Biosyst. 2016. PMID: 26923344
-
Methods for analysis of specific DNA methylation status.Methods. 2021 Mar;187:3-12. doi: 10.1016/j.ymeth.2020.06.021. Epub 2020 Jul 5. Methods. 2021. PMID: 32640317 Review.
-
DNA repair and the control of DNA methylation.Prog Drug Res. 2011;67:51-68. doi: 10.1007/978-3-7643-8989-5_3. Prog Drug Res. 2011. PMID: 21141724 Review.
Cited by
-
Inheritable epigenetic response towards foreign DNA entry by mammalian host cells: a guardian of genomic stability.Epigenetics. 2018;13(12):1141-1153. doi: 10.1080/15592294.2018.1549463. Epub 2018 Dec 12. Epigenetics. 2018. PMID: 30458693 Free PMC article. Review.
-
Requirement of DNMT1 to orchestrate epigenomic reprogramming for NPM-ALK-driven lymphomagenesis.Life Sci Alliance. 2020 Dec 11;4(2):e202000794. doi: 10.26508/lsa.202000794. Print 2021 Feb. Life Sci Alliance. 2020. PMID: 33310759 Free PMC article.
-
Short-Half-Life Chemicals: Maternal Exposure and Offspring Health Consequences-The Case of Synthetic Phenols, Parabens, and Phthalates.Toxics. 2024 Sep 29;12(10):710. doi: 10.3390/toxics12100710. Toxics. 2024. PMID: 39453131 Free PMC article. Review.
-
Recent Advances in Glioma Cancer Treatment: Conventional and Epigenetic Realms.Vaccines (Basel). 2022 Sep 2;10(9):1448. doi: 10.3390/vaccines10091448. Vaccines (Basel). 2022. PMID: 36146527 Free PMC article. Review.
-
BoostMe accurately predicts DNA methylation values in whole-genome bisulfite sequencing of multiple human tissues.BMC Genomics. 2018 May 23;19(1):390. doi: 10.1186/s12864-018-4766-y. BMC Genomics. 2018. PMID: 29792182 Free PMC article.
References
-
- Jaenisch R., Bird A. Epigenetic regulation of gene expression: how the genome integrates intrinsic and environmental signals. Nat. Genet. 2003;33:245–254. - PubMed
-
- Bird A. Perceptions of epigenetics. Nature. 2007;447:396–398. - PubMed
-
- Holliday R., Pugh J.E. DNA modification mechanisms and gene activity during development. Science. 1975;187:226–232. - PubMed
-
- Riggs A.D. X inactivation, differentiation, and DNA methylation. Cytogenet. Genome Res. 1975;14:9–25. - PubMed
Publication types
MeSH terms
LinkOut - more resources
Full Text Sources
Other Literature Sources
Medical
