. 2014 Dec;3(1):28.
doi: 10.1186/s40169-014-0028-z. Epub 2014 Sep 23.

Transcriptional factor snail controls tumor neovascularization, growth and metastasis in mouse model of human ovarian carcinoma

Affiliations

Transcriptional factor snail controls tumor neovascularization, growth and metastasis in mouse model of human ovarian carcinoma

Samar Abdulkhalek et al. Clin Transl Med. 2014 Dec.

Abstract

Background: Snail, a transcriptional factor and repressor of E-cadherin is well known for its role in cellular invasion. It can regulate epithelial to mesenchymal transition (EMT) during embryonic development and in epithelial cells. Snail also mediates tumor progression and metastases. Silencing of Snail and its associate member Slug in human A2780 ovarian epithelial carcinoma cell line was investigated to identify its role in tumor neovascularization.

Methods: Live cell sialidase, WST-1 cell viability and immunohistochemistry assays were used to evaluate sialidase activity, cell survival and the expression levels of tumor E-cadherin, N-cadherin, VE-cadherin, and host endothelial CD31+(PECAM-1) cells in archived paraffin-embedded ovarian A2780, A2780 Snail shRNA GIPZ lentiviral knockdown (KD) and A2780 Slug shRNA GIPZ lentiviral KD tumors grown in RAGxCγ double mutant mice.

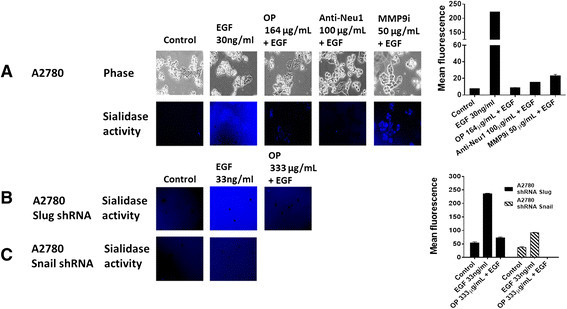
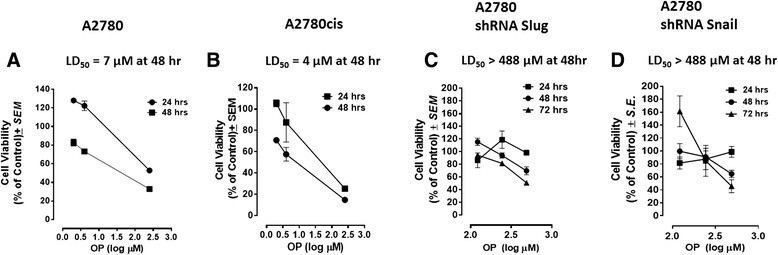
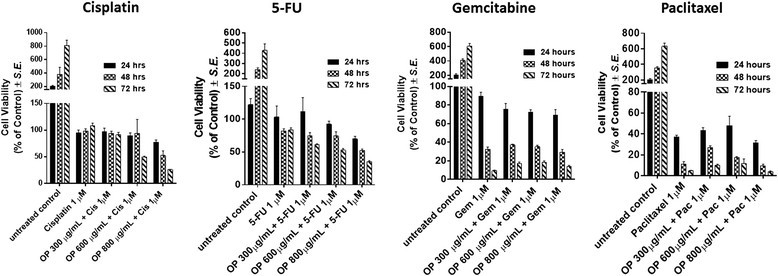
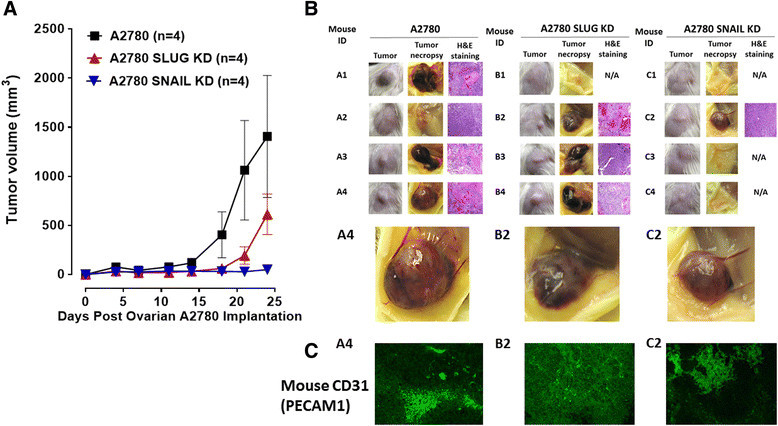
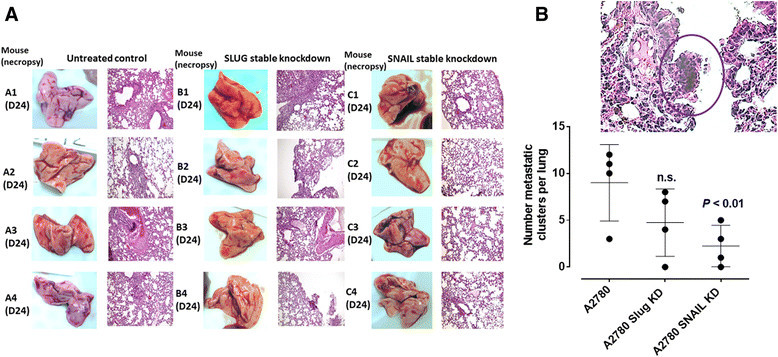
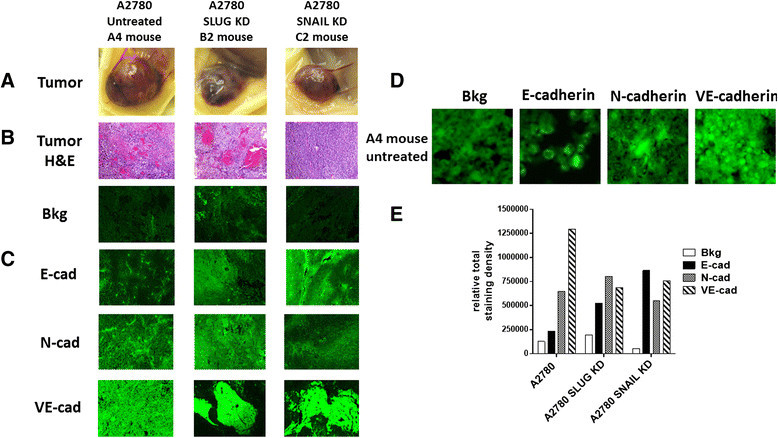
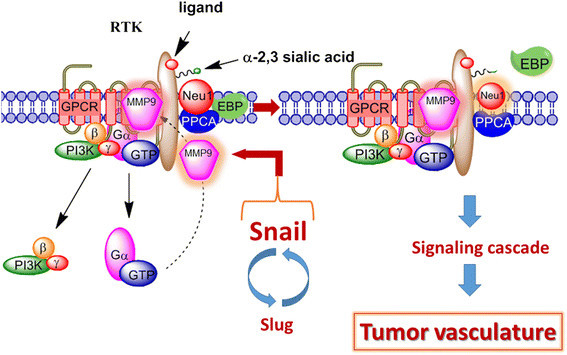
Results: Oseltamivir phosphate (OP), anti-Neu1 antibodies and MMP-9 specific inhibitor blocked Neu1 activity associated with epidermal growth factor (EGF) stimulated A2780 ovarian epithelial carcinoma cells. Silencing Snail in A2780 cells abrogated the Neu1 activity following EGF stimulation of the cells compared to A2780 and A2780 Slug KD cells. OP treatment of A2780 and cisplatin-resistant A2780cis cells reproducibly and dose-dependently abated the cell viability with a LD50 of 7 and 4 μm, respectively, after 48 h of incubation. Heterotopic xenografts of A2780 and A2780 Slug KD tumors developed robust and bloody tumor vascularization in RAG2xCγ double mutant mice. OP treatment at 50 mg/kg daily intraperitoneally did not significantly impede A2780 tumor growth rate but did cause a significant reduction of lung metastases compared with the untreated and OP 30mg/kg cohorts. Silencing Snail in A2780 tumor cells completely abrogated tumor vascularization, tumor growth and spread to the lungs in RAGxCγ double mutant mice. A2780 and A2780 Slug KD tumors expressed high levels of human N- and VE-cadherins, and host CD31+ endothelial cells, while A2780 Snail KD tumors expressed E-cadherin and reduced host CD31+ cells. OP 50mg/kg cohort tumors had reduced numbers of host CD31+ cells compared to a higher expression levels of CD31+ cells in tumors from the untreated control and OP 30mg/kg cohorts.

Conclusion: Snail transcriptional factor is an important intermediate player in human ovarian tumor neovascularization.

Keywords: Human ovarian cancer; Oseltamivir phosphate; Silencing transcriptional repressors Snail and Slug; Tumor neovascularization.


Figures

Figure 1
Figure 1
EGF induces sialidase activity in live (A) A2780 ovarian cancer cells, (B) A2780 shRNA Snail and (C) A2780 shRNA Slug. Cells were allowed to adhere on 12 mm circular glass slides in media containing 10% fetal calf sera for 24 h. After removing media, 0.318 mM 4-MUNANA substrate (2′-(4-methlyumbelliferyl)-α-N-acetylneuraminic acid) in Tris buffered saline pH 7.4 was added to live cells alone (control) or with EGF alone and in combination with OP, anti-Neu1 neutralizing antibodies, and specific inhibitor of MMP-9i at the indicated dosage. Fluorescent images were taken at 1-2 min after adding substrate using Zeiss Imager M2 epi-fluorescence microscopy (20× objective). The mean fluorescence of 50 multi-point replicates was quantified using the Image J software. The data are a representation of one out of three independent experiments showing similar results.
Figure 2
Figure 2
Cell viability of (A) A2780, (B) A2780cis cells, (C) A2780 shRNA Slug and (D) A2780 shRNA Snail treated with OP at different doses using the WST-1 assay. Cells were incubated in 96 well plates (5000 cells/well) and allowed to adhere for 24 h in 1× DMEM media containing 10% FCS. The media were replaced with fresh DMEM media containing 5% FCS without or with various concentrations of OP for indicated time periods. Cell viability was expressed as a percent of control ± S.E. of triplicate values. The data are a representation of one out of three independent experiments showing similar results. LD50 value is given as μm of drug concentration as determined by WST-1 assay after 48h for each of the cell lines.
Figure 3
Figure 3
Cell viability of A2780 cells treated with OP at indicated doses in combination with 1 μm of cisplatin, 5-FU, gemcitabine and paclitaxel using the WST-1 assay. Cells were incubated in 96 well plates (5000 cells/well) and allowed to adhere for 24 h in 1× DMEM media containing 10% FCS. The media were replaced with fresh DMEM media containing 5% FCS without or with various concentrations of OP for 24, 48 and 72 hr as predetermined optimally. Cell viability was expressed as a percent of control ± S.E. of three independent experiments.
Figure 4
Figure 4
OP treatment of RAGxCγ double mutant mice bearing heterotopic xenograft of A2780 tumors. A2780 cells at 0.5 × 10⁶ in 0.2 mL were implanted cutaneously in the right back flank of these mice. Twice a week following implantation of the cancer cells each mouse was monitored for tumor volume ((width square/2) × length) at the site of implantation. Mice were treated with 30 and 50 mg/kg of OP in sterile saline i.p. daily at day 7 post-implantation when the tumor volume reached approximately 50 mm3. (A) Tumor growth rates for individual mice (mouse label A1-4 for the control cohort; B1-4, 50mg/kg OP cohort and C1-4, 30mg/kg cohort). (B) Representative tumors on the right flank of the individual animals at end-point, necropsy of live tumors, H&E staining and immunostaining for mouse CD31+ (PECAM-1) cells of tumor tissues.
Figure 5
Figure 5
H&E staining of necropsy lung for number of metastatic clusters per lung in paraffin-embedded tissues taken from xenograft A2780 tumor-bearing RAGxCγ double mutant mice. (A) Mice were implanted with 0.5×10⁶ A2780 cells cutaneously on the rear flank and OP treatment began daily (i.p.) 7 days post implantation when tumors reached 50 mm3. Paraffin-embedded tissue sections (5 μm) on glass slides were processed for H&E staining fir each mouse necropsied at indicated day post-implantation. Stained tissue sections were photographed using AxioCam MRc5 digital color camera attached to a Zeiss Imager M2 fluorescence microscope at 400× magnification. Images are representative of at least five fields of view from two tissue sections. (B) Metastatic lung clusters as representative in the insert were microscopically counted per tissues and plotted in the graph. Statistical analysis was carried out using GraphPad Prism and results were compared by unpaired t-test.
Figure 6
Figure 6
A2780, A2780 shRNA Snail and A2780 shRNA Slug ovarian cancer cells in heterotopic xenograft of tumors growing in RAGxCγ double mutant mice. (A) Cells at 0.5×10⁶ in 0.2 mL were implanted cutaneously in the right back flank of these mice. Twice a week following implantation of the cancer cells each mouse was monitored for tumor volume ((width square/2) × length) at the site of implantation. Mice were sacrificed at day 24 post-implantation. (B) Representative tumors on the right flank of the animal, necropsy tumors and H&E staining of tumors; N/A, not available due to lack of tumor. (C) Paraffin-embedded tumor sections (5μm) on glass slides were processed for immunohistochemistry using primary DyLight 488 conjugated rat monoclonal anti-mouse CD31+ (PECAM-1) antibody in 1% BSA in PBS blocking solution and Entellan× rapid mounting media. Stained tissue sections were photographed using an AxioCamMRm3-2 fluorescence camera attached to a Zeiss Imager M2 fluorescence microscope at 400× magnification. Images are representative of at least five fields of view from two tumor sections.
Figure 7
Figure 7
H&E staining of necropsy lung for number of metastatic clusters per lung in paraffin-embedded tissues taken from xenograft tumor-bearing RAGxCγ double mutant mice. (A) Mice were implanted with 0.5×10⁶ A2780, A2780 shRNA Slug and A2780 shRNA Snail cells cutaneously on the rear flank and OP treatment began daily (i.p.) 7 days post implantation when tumors reached 50 mm3. Paraffin-embedded tissue sections (5μm) on glass slides were processed for H&E staining for each mouse necropsied at indicated day post-implantation. Stained tissue sections were photographed using AxioCam MRc5 digital color camera attached to a Zeiss Imager M2 fluorescence microscope at 400× magnification. Images are representative of at least five fields of view from two tissue sections. (B) Metastatic lung clusters as representative in the insert were microscopically counted per tissues and plotted in the graph. Statistical analysis was carried out using GraphPad Prism and results were compared by unpaired t-test.
Figure 8
Figure 8
Fluorescence immunohistochemical detection of E-cadherin, N-cadherin, and VE-cadherin expression in paraffin-embedded tumor tissues archived from xenograft tumors of A2780, A2780 shRNA Snail and A2780 shRNA Slug cells growing in RAGxCγ double mutant mice. Mice were implanted with 0.5 × 10⁶ cells cutaneously on the rear flank. (A) Live necropsy tumors. (B) H&E staining of tumor necropsy specimens. (C) Paraffin-embedded tumor sections (5 μm) on glass slides were processed for immunohistochemistry using primary anti-E-cadherin, N-cadherin, and VEcadherin antibodies followed with polyclonal goat anti-rabbit Alexa Fluor® 488 secondary antibody and Entellan® rapid mounting media. Background control (Bkg) sections were prepared without the primary antibodies. Stained tissue sections were photographed using an AxioCamMRm3-2 fluorescence camera attached to a Zeiss Imager M2 fluorescence microscope at 200× magnification. Images are representative of at least five fields of view from two tumor sections. (D) Tissue sections were visualized and photographed using an AxioCamMRm3-2 fluorescence camera attached to a Zeiss Imager M2 fluorescence microscope at 400× magnification and software enlarged. (E) Quantitative analysis was done by assessing the density of tumor staining corrected for background in each panel using Corel Photo Paint 8.0 2 software. Each bar in the figures represents the mean (± standard error of the mean) corrected density of tumor staining within the respective images.
Figure 9
Figure 9
Graphical abstract of the Snail and MMP-9 signaling axis in facilitating a neuraminidase-1 (Neu1) and matrix metalloproteinase-9 (MMP-9) cross-talk in regulating receptor tyrosine kinases (RTKs) in ovarian cancer cells to promote tumor neovascularization. Notes: For ovarian cancers, Snail and MMP-9 expressions are closely connected in similar invasive tumor processes. Snail induces MMP-9 secretion via multiple signaling pathways, but particularly in cooperation with oncogenic H-Ras (RasV12), Snail leads to the transcriptional up-regulation of MMP-9. This Snail-MMP-9 signaling axis is the connecting link in promoting growth factor receptor glycosylation modification involving the subsequent receptor-signaling platform of a Neu1-MMP-9 crosstalk tethered at the ectodomain of RTKs. Activated MMP-9 is proposed to remove the elastin-binding protein (EBP) as part of the molecular multi-enzymatic complex that contains β-galactosidase/Neu1 and protective protein cathepsin A (PPCA). Activated Neu1 hydrolyzes α-2,3-sialic acid residues of RTKs at the ectodomain to remove steric hindrance to receptor association and activation. This process sets the stage for Snail's role in tumor neovascularization. Abbreviations: GPCR, G-protein coupled receptor; Pi3K, phosphatidylinositol 3-kinase; GTP, guanine triphosphate; EBP, elastin binding protein; PPCA, protective protein cathepsin A. Citation: Taken in part from Research and Reports in Biochemistry 2013:3 17-30. © 2013 Abdulkhalek et al, publisher and licensee Dove Medical Press Ltd. This is an Open Access article which permits unrestricted non-commercial use, provided the original work is properly cited.

Similar articles

Cited by

References

    1. Jayson GC, Kohn EC, Kitchener HC, Ledermann JA: Ovarian cancer. The Lancet 2014, corrected proof (DOI: 10.1016/S0140–6736(13)62146–7). Jayson GC, Kohn EC, Kitchener HC, Ledermann JA: Ovarian cancer.The Lancet 2014, corrected proof (DOI: 10.1016/S0140-6736(13)62146-7). - PubMed
    1. Grunert S, Jechlinger M, Beug H. Diverse cellular and molecular mechanisms contribute to epithelial plasticity and metastasis. Nat Rev Mol Cell Biol. 2003;4:657–665. doi: 10.1038/nrm1175. - DOI - PubMed
    1. Thiery JP, Sleeman JP. Complex networks orchestrate epithelial-mesenchymal transitions. Nat Rev Mol Cell Biol. 2006;7:131–142. doi: 10.1038/nrm1835. - DOI - PubMed
    1. Thiery JP. Epithelial-mesenchymal transitions in tumour progression. Nat Rev Cancer. 2002;2:442–454. doi: 10.1038/nrc822. - DOI - PubMed
    1. Kang Y, Massague J. Epithelial-mesenchymal transitions: twist in development and metastasis. Cell. 2004;118:277–279. doi: 10.1016/j.cell.2004.07.011. - DOI - PubMed