. 2016 Mar 2:7:10877.
doi: 10.1038/ncomms10877.

Myocardial pathology induced by aldosterone is dependent on non-canonical activities of G protein-coupled receptor kinases

Affiliations

Myocardial pathology induced by aldosterone is dependent on non-canonical activities of G protein-coupled receptor kinases

Alessandro Cannavo et al. Nat Commun. .

Abstract

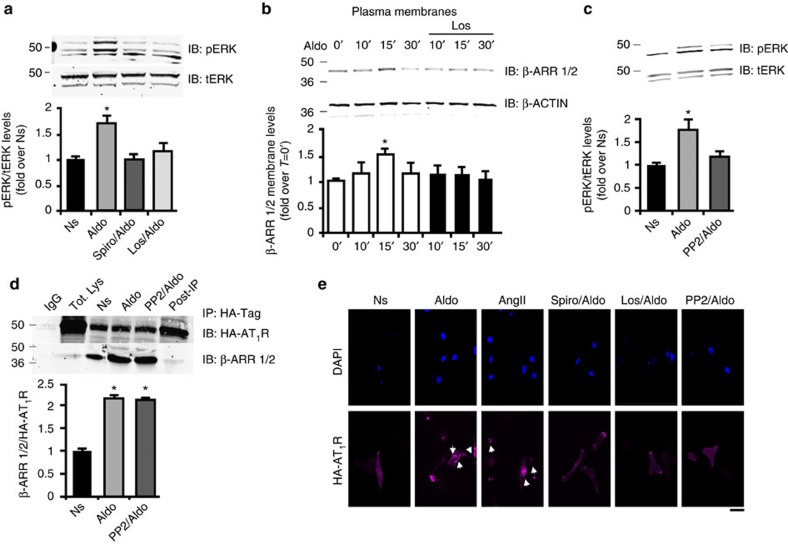
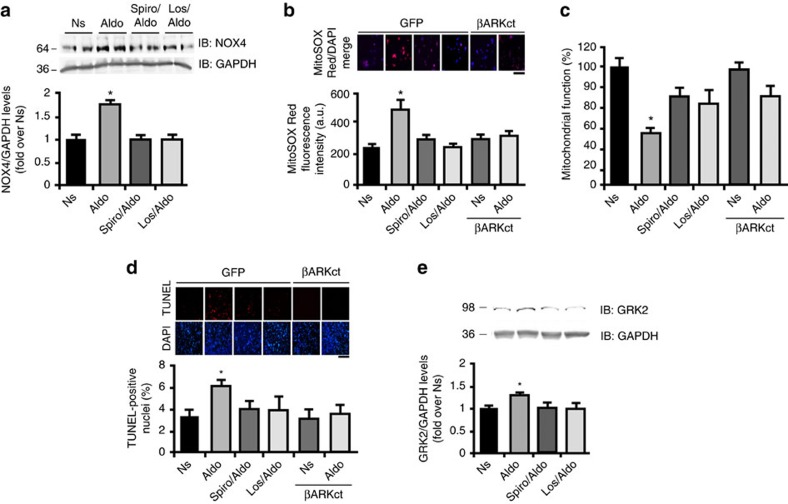
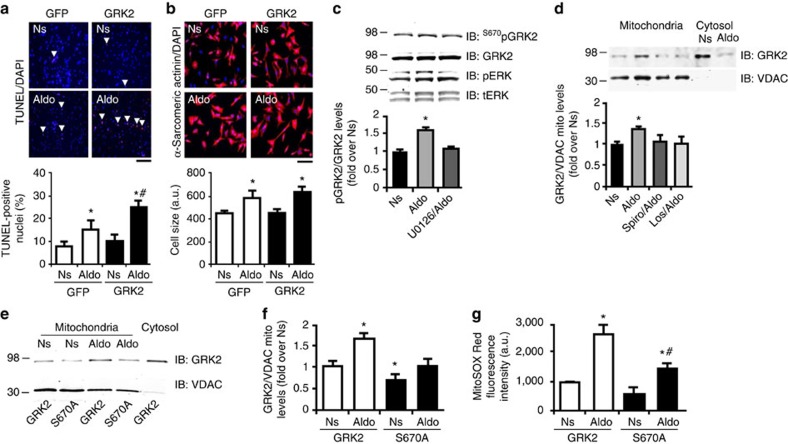
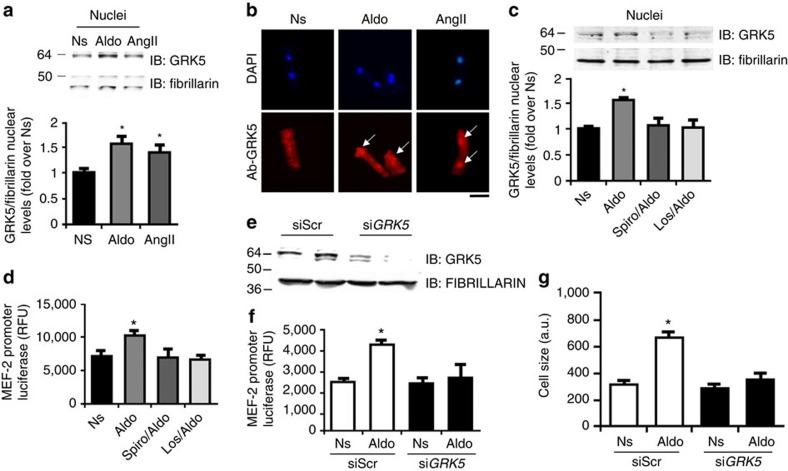
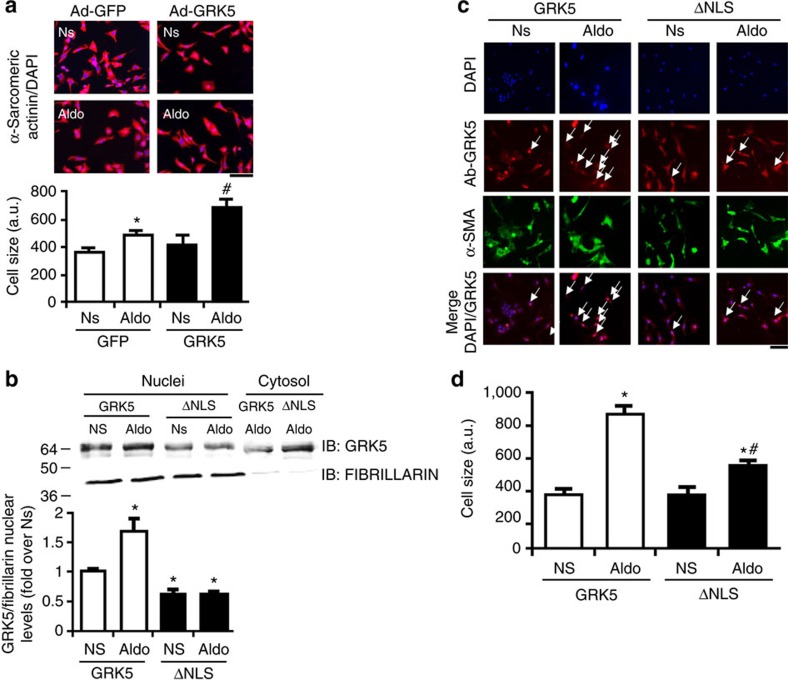
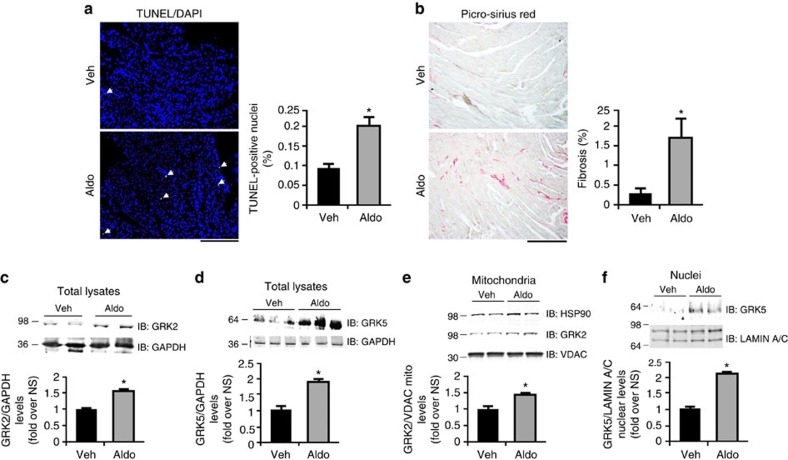
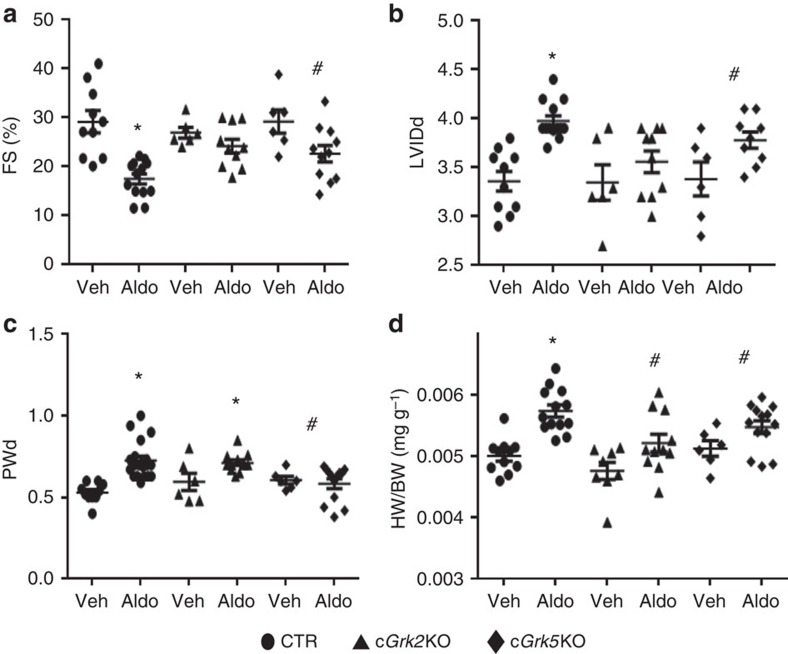
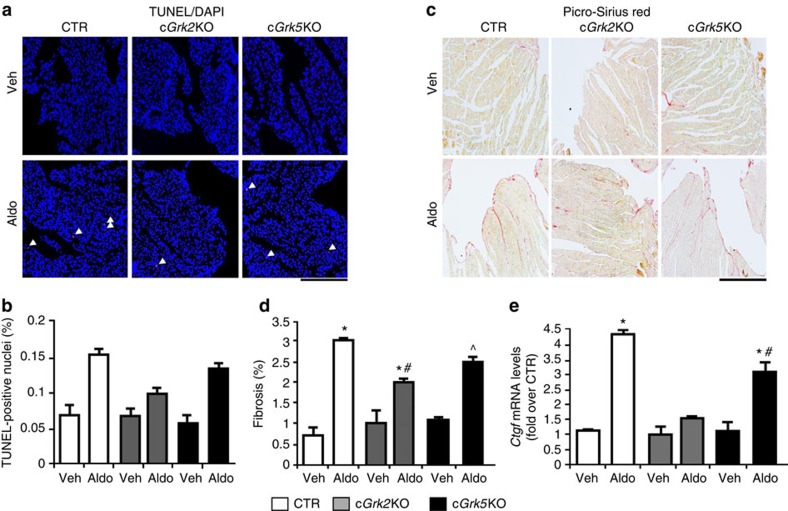
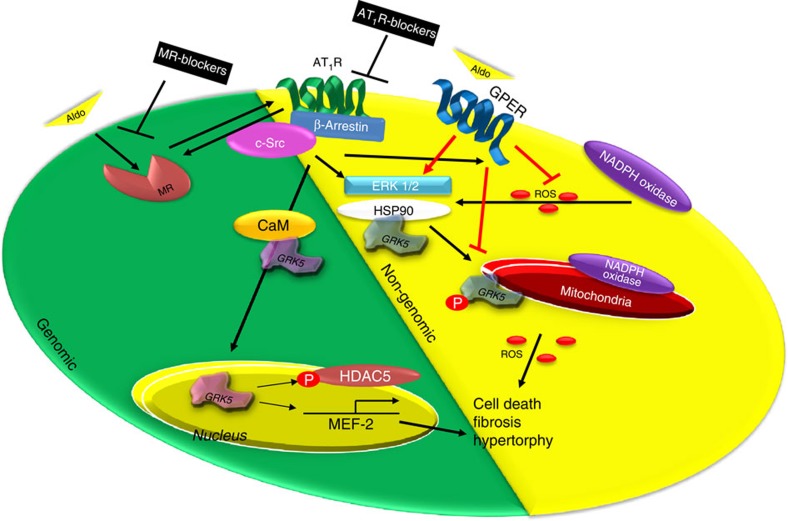
Hyper-aldosteronism is associated with myocardial dysfunction including induction of cardiac fibrosis and maladaptive hypertrophy. Mechanisms of these cardiotoxicities are not fully understood. Here we show that mineralocorticoid receptor (MR) activation by aldosterone leads to pathological myocardial signalling mediated by mitochondrial G protein-coupled receptor kinase 2 (GRK2) pro-death activity and GRK5 pro-hypertrophic action. Moreover, these MR-dependent GRK2 and GRK5 non-canonical activities appear to involve cross-talk with the angiotensin II type-1 receptor (AT1R). Most importantly, we show that ventricular dysfunction caused by chronic hyper-aldosteronism in vivo is completely prevented in cardiac Grk2 knockout mice (KO) and to a lesser extent in Grk5 KO mice. However, aldosterone-induced cardiac hypertrophy is totally prevented in Grk5 KO mice. We also show human data consistent with MR activation status in heart failure influencing GRK2 levels. Therefore, our study uncovers GRKs as targets for ameliorating pathological cardiac effects associated with high-aldosterone levels.


Figures

Figure 1
Figure 1. Aldosterone-mediated cross-talk between the MR and the AT1R.
(a) Representative immunoblots (upper panels) and densitometric quantitative analysis (lower panel) of multiple (n=3) independent experiments to evaluate ERK 1/2 phosphorylation (pERK) as a ratio of activated ERK to total ERK (tERK) in neonatal rat ventricular myocytes (NRVMs) either unstimulated (Ns) or stimulated with aldosterone (Aldo 1 μM) for 15 min. Before Aldo treatment, myocytes were pre-treated with spironolactone (Spiro 10 μM) or losartan (Los 10 μM) for 30 min; *P<0.05 versus Ns. (b) Representative immunoblots (upper panels) and densitometric quantitative analysis (lower panel) of multiple (n=3) independent experiments to evaluate β-arrestin membrane recruitment in crude plasma membrane preparations from NRVMs. Shown is a time course (0–30 min) of Aldo (1 μM) treatment alone or with 30 min pre-treatment with Los (10 μM). β-ACTIN was used as loading control; *P<0.05 versus Ns. (c) Representative immunoblots (upper panels) and densitometric analysis (lower panel) of multiple (n=3) independent experiments to evaluate pERK in NRVMs Ns or stimulated with Aldo (1 μM) for 15 min. Before Aldo, a group of cells was pre-treated with PP2 (10 μM) for 30 min. tERK was used as loading control; *P<0.05 versus Ns. (d) Representative panels (upper panels) and densitometric analysis (lower panel) of multiple (n=3) independent experiments of Co-IP assay in total lysates from NRVMs infected with HA-tagged AT1R. Cells were Ns or stimulated with Aldo (1 μM) for 30 min. Before stimulation, a group of cells was pre-treated with the c-Src inhibitor PP2 (10 μM). Immunoprecipitated proteins (IP) for HA-tag were blotted with an antibody anti-β-arrestin 1/2 antibody; *P<0.05 versus Ns. (e) Representative immunofluorescence images of NRVMs infected with HA-tagged AT1R (red, lower panels). DAPI-stained myocyte nuclei are shown in the upper panel of images. Shown are cells treated for 30 min with Aldo (1 μM) or AngII (1 μM) or before Aldo, pre-treated for 30 min with Spiro (10 μM), Los (10 μM) or PP2 (10 μM). Arrows indicate receptors that are internalized. Scale bar, 20 μm. (ad) Statistical significance between groups was determined by one-way ANOVA with Bonferroni post hoc correction. All data are shown as mean±s.e.m.
Figure 2
Figure 2. Aldosterone induced oxidative stress and apoptosis.
(a) Representative immunoblots (upper) and densitometric quantitative analysis (lower) of panels of multiple (n=3) independent experiments to evaluate NOX4 protein levels in NRVMs unstimulated (Ns) or stimulated with Aldo (1 μM) for 15 min. Before Aldo, a group of cells was pre-treated with Spiro (10 μM) or Los (10 μM) for 30 min. GAPDH was used as loading control; *P<0.05 versus Ns. (b) Representative panels (upper) and cumulative fluorescence data (bottom) from (n=3) independent experiments of MitoSOX Red staining of NRVMs (∼200 cells analysed for the group for each experiment) infected with adenoviruses encoding for either GFP or βARKct. Myocytes were then Ns or stimulated for 30 min with Aldo. Before Aldo stimulation, a group of GFP cells was pre-treated (30 min) with Spiro (10 μM) or Los (10 μM); *P<0.05 versus GFP Ns. Scale bar, 50 μm. (c) Bar graphs showing multiple (n=3) independent experiment of MTT assay using NRVMs expressing βARKct or GFP after Aldo treatment for 24 h. Before Aldo stimulation, a group of GFP cells was pre-treated with Spiro (10 μM) or Los (10 μM) for 30 min; *P<0.05 versus GFP Ns. (d) Representative panels of TUNEL-positive myocytes (Red staining with blue DAPI staining) and quantitative data (n=3 independent experiments) showing NRVM apoptosis (∼1,000 cells analysed for the group for each experiment) induced by Aldo (1 μM for 24 h) with Ad-GFP infection or Ad-βARKct treatment. Before Aldo stimulation, a group of GFP cells was pre-treated with Spiro (10 μM) or Los (10 μM) for 30 min; scale bar, 200 μm. *P<0.05 versus GFP Ns. (e) Representative immunoblots (upper panels) and densitometric quantitative analysis (lower panel) of multiple (n=3) independent experiments to evaluate GRK2 protein levels in NRVMs Ns or stimulated with Aldo (1 μM) for 12 h. Before Aldo, a group of cells was pre-treated with Spiro (10 μM) or Los (10 μM) for 30 min. GAPDH was used as loading control. *P<0.05 versus Ns. (ae) Statistical significance between groups was determined by one-way ANOVA with Bonferroni post hoc correction. All data are shown as mean±s.e.m.
Figure 3
Figure 3. Aldosterone-mediated GRK2 mitochondrial localization in myocytes.
(a,b) Representative images and quantitative data from (n=3) independent experiments showing (a) apoptotic (TUNEL staining; scale bar, 100 μm) NRVMs (∼1,000 cells analysed for the group for each experiment) or (b) hypertrophic (α-sarcomeric actin staining; scale bar, 50 μm) NRVMs (∼200 cells analysed for the group for each experiment) infected with either Ad-GFP or Ad-GRK2 to determine the effect of Aldo with GRK2 overexpression. Myocytes were unstimulated (Ns) or stimulated with Aldo (1 μM) for 24 (a) or 48 h (b). *P<0.05 versus GFP Ns; #P<0.05 versus GFP Aldo. (c) Representative immunoblots (upper panels) and densitometric quantitative analysis (lower panel) of multiple (n=3) independent experiments to evaluate GRK2 phosphorylation (ser670) or ERK 1/2 phosphorylation (pERK) levels in NRVMs Ns or stimulated with Aldo (1 μM) for 15 min. Before Aldo, a group of cells was pre-treated with U0126 (3 μM) for 30 min. Total ERK (tERK) and GRK2 are shown as loading controls; *P<0.05 versus Ns. (d) Representative immunoblots (upper panels) and densitometric quantitative analysis (lower panel) of multiple (n=3) independent experiments to evaluate GRK2 levels in mitochondrial fractions purified from NRVMs that were either Ns or stimulated with Aldo (1 μM) for 30 min. Before Aldo, a group of cells was pre-treated with Spiro (10 μM) or Los (10 μM) for 30 min. VDAC was used as loading and mitochondrial purity control; *P<0.05 versus Ns. (e,f) Representative immunoblots (e) and denistometric quantitative analysis (f) of multiple (n=3) independent experiments to evaluate GRK2 levels in mitochondrial fractions purified from NRVMs infected with Ad-GRK2 and Ad-GRK2-S670A that were either Ns or stimulated with Aldo (1 μM) for 30 min. VDAC was used as loading and mitochondrial purity control; *P<0.05 versus GRK2 Ns. (g) Cumulative fluorescence data from (n=3) independent experiments of MitoSOX Red staining of NRVMs (∼200 cells analysed for the group for each experiment) infected with adenoviruses encoding for either GRK2 or GRK2-S670A. Myocytes were then Ns or stimulated for 30 min with Aldo. *P<0.05 versus GRK2 Ns; #P<0.05 versus GRK2 Aldo. (ad,f,g) Statistical significance between groups was determined by one-way ANOVA with Bonferroni post hoc correction. All data are shown as mean±s.e.m.
Figure 4
Figure 4. Aldosterone-mediated GRK5 nuclear localization and hypertrophic response.
(a) Representative immunoblots (upper panels) and densitometric analysis (lower panel) of multiple independent experiments (n=3) to evaluate GRK5 levels in nuclear fractions purified from NRVMs, unstimulated (Ns) or stimulated with Aldo (1 μM) or AngII (1 μM) for 30 min. Fibrillarin was used as loading control; *P<0.05 versus Ns. (b) Representative panels of DAPI (upper) and GRK5 (bottom) immunofluorescence images in adult ventricular myocytes. The cells were Ns or stimulated with Aldo (1 μM) or AngII (1 μM) for 30 min; scale bar, 10 μm. (c) Representative immunoblots (upper panels) and densitometric analysis (lower panel) of multiple independent experiments (n=3) to evaluate GRK5 levels in nuclear fractions purified from NRVMs Ns or stimulated with Aldo (1 μM) for 30 min. Before Aldo, a group of cells was pre-treated with Spiro (10 μM) or Los (10 μM) for 30 min. Fibrillarin was used as loading control; *P<0.05 versus Ns. (d) Bar graph showing MEF2 reporter activity in NRVMs measured using a luciferase assay system. Cells were infected with an Ad encoding for MEF2 promoter-luciferase (Ad-MEF2-Luc) reporter construct for 48 h. Following the infection, the cells were Ns or stimulated for 24 h with Aldo (1 μM). Before Aldo, a group of cells was pre-treated with Spiro (10 μM) or Los (10 μM) for 30 min; *P<0.05 versus Ns. (e) Representative immunoblots showing total GRK5 levels in NRVMs transfected with siRNAs targeting GRK5 (siGRK5). Scrambled siRNAs (siScr) were used as control. The cells were then Ns or stimulated for 24 h with Aldo (1 μM). (f) Bar graph showing MEF2 reporter activity in NRVMs measured using a luciferase assay system. Cells were infected with an Ad-MEF2-Luc and transfected with siRNAs targeting GRK5 (siGRK5). siScr were used as control. The cells were then Ns or stimulated for 24 h with Aldo (1 μM); *P<0.05 versus siScr. (g) Cumulative fluorescence data from (n=3) independent experiments of α-sarcomeric actinin staining in NRVMs (∼200 cells analysed for the group for each experiment) transfected with siGRK5 or siScr. The cells were Ns or stimulated with Aldo (1 μM) for 48 h; *P<0.05 versus siScr Ns. (a,c,d,f,g) Statistical significance between groups was determined by one-way ANOVA with Bonferroni post hoc correction. All data are shown as mean±s.e.m.
Figure 5
Figure 5. Nuclear GRK5 localization induces hypertrophic response in NRVMs.
(a) Representative images and bar graphs showing hypertrophic response (α-sarcomeric actinin staining) in NRVMs (∼200 cells analysed for the group for each experiment) infected with Ad encoding for GFP or GRK5. The cells were Ns or stimulated with Aldo (1 μM) for 48 h; *P<0.05 versus GFP Ns; #P<0.05 versus GFP Aldo; scale bar, 50 μm. (b) Representative immunoblots (upper panels) and densitometric analysis (lower panel) of multiple independent experiments (n=3) to evaluate GRK5 levels in nuclear fractions purified from NRVMs infected with an Ad-GRK5 or an Ad-GRK5-ΔNLS. NRVMs were Ns or stimulated with Aldo (1 μM) for 30 min. FIBRILLARIN was used as loading control; *P<0.05 versus Ns. (c,d) Representative panels of DAPI (blue), GRK5 (red) and α-sarcomeric actinin staining (α-SMA) immunofluorescence images (scale bar, 50 μm) and (d) bar graphs showing cumulative data of multiple independent experiments (n=3) to evaluate hypertrophic response in NRVMs (∼200 cells analysed for the group for each experiment) infected with Ad encoding for GRK5 or GRK5-ΔNLS. The cells were Ns or stimulated with Aldo (1 μM) for 48 h; arrows in GRK5 and in merged (DAPI/GRK5) panels indicate the nuclear localization of GRK5. *P<0.05 versus GRK5 Ns; #P<0.05 versus GRK5 Aldo. (a,b,d) Statistical significance between groups was determined by one-way ANOVA with Bonferroni post hoc correction. All data are shown as mean±s.e.m.
Figure 6
Figure 6. In vivo effects of chronic aldosterone treatment on murine myocardium.
(a,b) Representative images and quantitative data from mice treated with vehicle (Veh-saline) or aldosterone (Aldo, 2 μg per day) for 4 weeks (n=6 mice each group). Shown in (a) is TUNEL/DAPI staining of cardiac sections of mice treated with Veh or Aldo and arrows indicate TUNEL-positive nuclei. Shown in (b) is Picro-Sirius red staining from these sections denoting cardiac fibrosis; *P<0.05 versus Veh; scale bar, 100 μm. (c,d) Representative immunoblots and quantitative data (n=6 mice each group) showing GRK2 (c) and GRK5 (d) protein levels in total cardiac lysates from mice treated with Aldo or Veh for 4 weeks; *P<0.05 versus Veh. (e) Representative immunoblots and quantitative data (n=6 mice each group) showing GRK2 and HSP90 levels in mitochondrial fractions purified from mouse hearts after 4 weeks of Aldo or Veh treatments. VDAC was used as mitochondrial marker and loading control; *P<0.05 versus Veh. (f) Representative immunoblots and quantitative data (n=6 mice each group) showing GRK5 levels in nuclear fractions purified from mouse hearts after 4 weeks of Aldo or Veh treatments with LAMIN A/C was used as loading control; *P<0.05 versus Veh. (af) Statistical significance between groups was determined by Mann-Whitney exact test. All data are shown as mean±s.e.m.
Figure 7
Figure 7. Aldosterone negatively affects in vivo cardiac function in a GRK2- and GRK5-dependent manner.
(ac) Dot plots showing the echocardiographic analysis of individual mice from WT (CTR), cardiac Grk2 and Grk5 knockout (cGrk2 KO and cGrk5 KO) mice after 4 weeks of Aldo (2 μg per day) or Veh (saline) treatment. Shown are measurements for (a) fractional shortening (FS, %); (b) LV internal diameter at diastole (LVIDd); and (c) posterior wall diastolic thickness (PWd); *P<0.05 versus CTR Veh; #P<0.05 versus CTR Aldo. (d) Ratio of heart weight to body weight (HW/BW) following Aldo infusion in these mice for 4 weeks; *P<0.05 versus CTR Veh; #P<0.05 versus CTR Aldo. (ad) Statistical significance between groups was determined by one-way ANOVA with Bonferroni post hoc correction. All data are shown as mean±s.e.m. CTR, control.
Figure 8
Figure 8. Cardiac-specific Grk2 KO and Grk5 KO mice are protected against the negative molecular effects induced by aldosterone (Aldo).
(a,b) Representative images (upper scale bar, 200 μm) and quantitative data (n=8 mice each group; bottom) showing findings of myocyte cell death via TUNEL staining after 4 weeks of Aldo treatment of CTR, cGrk2 KO and cGrk5 KO mice; *P<0.05 versus CTR Veh; #P<0.05 versus CTR Aldo; ^P<0.05 versus all. (c,d) Representative images (upper scale bar, 200 μm) and quantitative data (n=8 mice each group; bottom) showing percentage of cardiac fibrosis via Picro-Sirius red staining following 4 weeks of Aldo treatment of CTR, cGrk2 KO and cGrk5 KO mice; *P<0.05 versus CTR Veh; #P<0.05 versus CTR Aldo; ^P<0.05 versus all. (e) Bar graph showing quantitative data of qPCR experiments to evaluate myocardial Ctgf mRNA levels from CTR, cGrk2 KO and cGrk5 KO hearts (n=8 each group) after Veh or Aldo treatment; *P<0.05 versus CTR Veh; #P<0.05 versus CTR Aldo. (b,d,e) Statistical significance between groups was determined by one-way ANOVA with Bonferroni post hoc correction. All data are shown as mean±s.e.m.
Figure 9
Figure 9. Schematic representation of aldosterone-dependent activation of GRK2 and GRK5 in NRVMs.
Following binding with the MR, aldosterone recruits the β-arrestin/c-Src complex thus inducing the endocytosis of the AT1R and then leading to the activation of ‘genomic' and ‘non-genomic' pathways. GRK5 is part of genomic pathway since following AT1R activation, it binds to the Ca2+-CaM and translocates into the nucleus of the cardiomyocyte. Then, GRK5 acts as a HDAC5 kinase increasing the transcription of hypertrophic genes (that is, MEF2). In contrast, GRK2 is mainly involved in the non-genomic response to aldosterone stimulation. In fact, this kinase following NADPH oxidases and ERK activation is phosphorylated at ser670, and following the binding to the chaperone HSP90, GRK2 translocates to mitochondria, where it increases myocyte apoptosis. Aldosterone through GPER activation activates a parallel signalling that inhibits the phosphorylation of GRK2 and the subsequent ROS generation. Thus, GRK2 and GRK5 participate to ventricular dysfunction and heart failure progression downstream of hyper-aldosteronism. Treatment of cardiomyocytes with MR or AT1R antagonists or with βARKct and also knockdown of GRK2 or GRK5 them self inhibit the MR/AT1R signalling axis.

Similar articles

Cited by

References

    1. Briet M. & Schiffrin E. L. Aldosterone: effects on the kidney and cardiovascular system. Nat. Rev. Nephrol. 6, 261–273 (2010). - PubMed
    1. Swedberg K., Eneroth P., Kjekshus J. & Wilhelmsen L. Hormones regulating cardiovascular function in patients with severe congestive heart failure and their relation to mortality. CONSENSUS Trial Study Group. Circulation 82, 1730–1736 (1990). - PubMed
    1. Jorde U. P. et al.. Elevated plasma aldosterone levels despite complete inhibition of the vascular angiotensin-converting enzyme in chronic heart failure. Circulation 106, 1055–1057 (2002). - PubMed
    1. Gutierrez-Marcos F. M. et al.. Atrial natriuretic peptide in patients with acute myocardial infarction without functional heart failure. Eur. Heart J. 12, 503–507 (1991). - PubMed
    1. Yoshida M. et al.. Mineralocorticoid receptor is overexpressed in cardiomyocytes of patients with congestive heart failure. Congest. Heart Fail. 11, 12–16 (2005). - PubMed

Publication types