

Differentiation resistance through altered retinoblastoma protein function in acute lymphoblastic leukemia: in silico modeling of the deregulations in the G1/S restriction point pathway
- PMID: 26932523
- PMCID: PMC4774111
- DOI: 10.1186/s12918-016-0264-5
Differentiation resistance through altered retinoblastoma protein function in acute lymphoblastic leukemia: in silico modeling of the deregulations in the G1/S restriction point pathway
Abstract
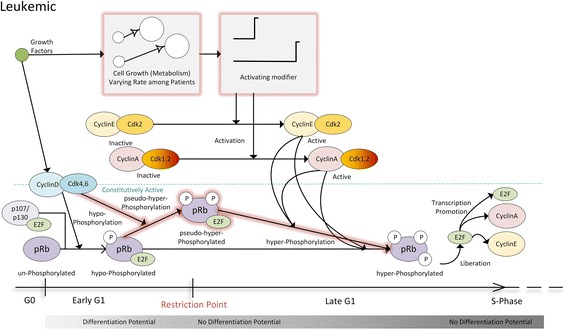
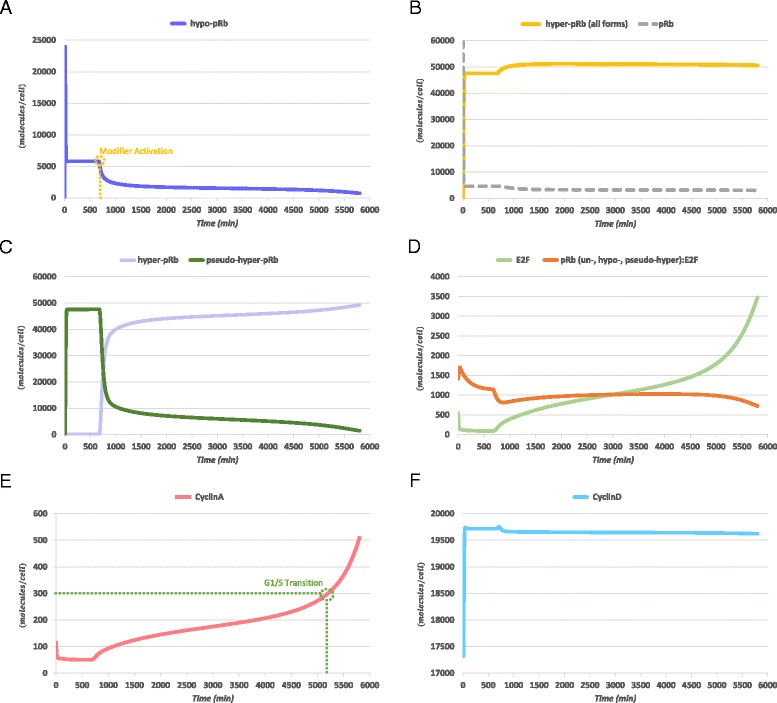
Background: As in many cancer types, the G1/S restriction point (RP) is deregulated in Acute Lymphoblastic Leukemia (ALL). Hyper-phosphorylated retinoblastoma protein (hyper-pRb) is found in high levels in ALL cells. Nevertheless, the ALL lymphocyte proliferation rate for the average patient is surprisingly low compared to its normal counterpart of the same maturation level. Additionally, as stated in literature, ALL cells possibly reside at or beyond the RP which is located in the late-G1 phase. This state may favor their differentiation resistant phenotype. A major phenomenon contributing to this fact is thought to be the observed limited redundancy in the phosphorylation of retinoblastoma protein (pRb) by the various Cyclin Dependent Kinases (Cdks). The latter may result in partial loss of pRb functions despite hyper-phosphorylation.
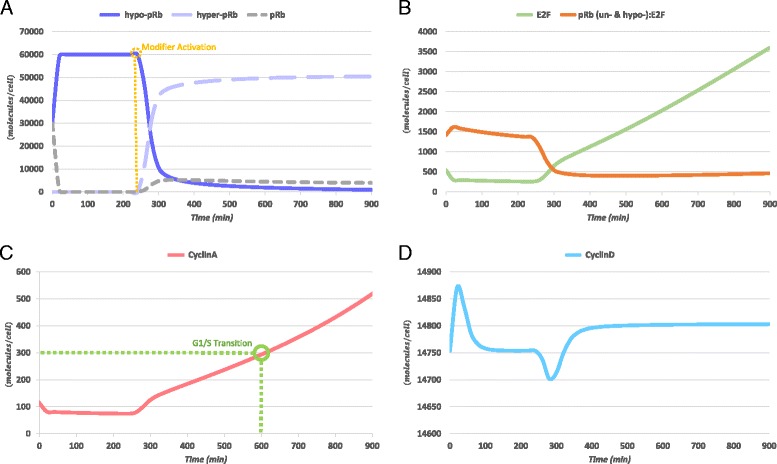
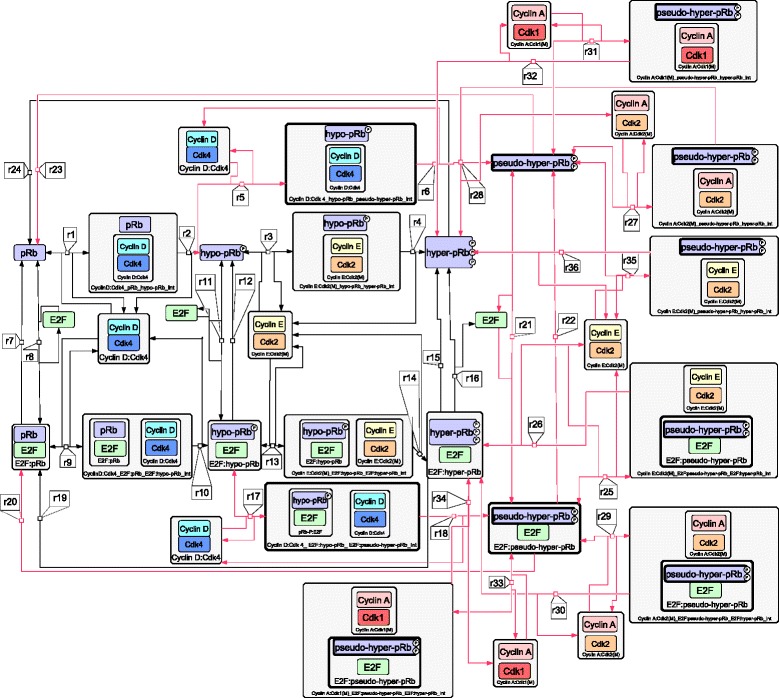
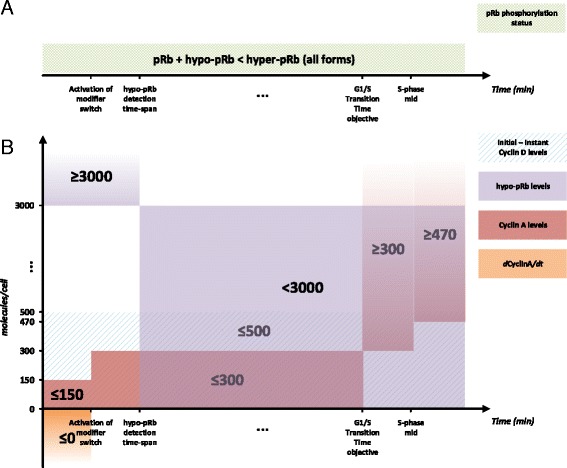
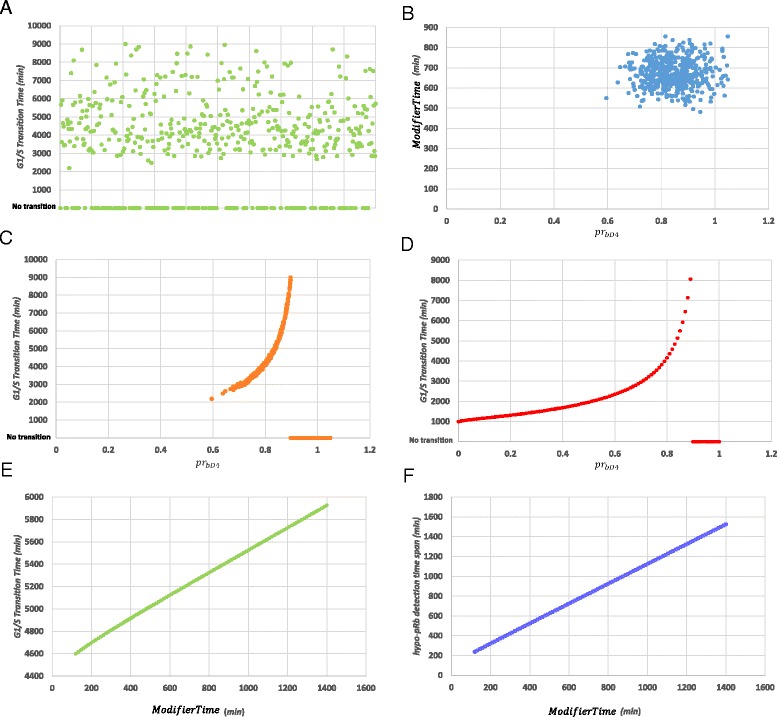
Results: To test this hypothesis, an in silico model aiming at simulating the biochemical regulation of the RP in ALL is introduced. By exploiting experimental findings derived from leukemic cells and following a semi-quantitative calibration procedure, the model has been shown to satisfactorily reproduce such a behavior for the RP pathway. At the same time, the calibrated model has been proved to be in agreement with the observed variation in the ALL cell cycle duration.
Conclusions: The proposed model aims to contribute to a better understanding of the complex phenomena governing the leukemic cell cycle. At the same time it constitutes a significant first step in the creation of a personalized proliferation rate predictor that can be used in the context of multiscale cancer modeling. Such an approach is expected to play an important role in the refinement and the advancement of mechanistic modeling of ALL in the context of the emergent and promising scientific domains of In Silico Oncology and more generally In Silico Medicine.
Figures


Similar articles
-
Forskolin-mediated G1 arrest in acute lymphoblastic leukaemia cells: phosphorylated pRB sequesters E2Fs.J Cell Sci. 2002 Mar 1;115(Pt 5):1073-82. doi: 10.1242/jcs.115.5.1073. J Cell Sci. 2002. PMID: 11870225
-
Differential phosphorylation of the retinoblastoma protein by G1/S cyclin-dependent kinases.J Biol Chem. 1997 May 9;272(19):12738-46. doi: 10.1074/jbc.272.19.12738. J Biol Chem. 1997. PMID: 9139732
-
Limited redundancy in phosphorylation of retinoblastoma tumor suppressor protein by cyclin-dependent kinases in acute lymphoblastic leukemia.Am J Pathol. 2006 Sep;169(3):1074-9. doi: 10.2353/ajpath.2006.051137. Am J Pathol. 2006. PMID: 16936279 Free PMC article.
-
Cyclins and CDKS in development and cancer: lessons from genetically modified mice.Front Biosci. 2006 Jan 1;11:1164-88. doi: 10.2741/1871. Front Biosci. 2006. PMID: 16146805 Review.
-
Integrating Old and New Paradigms of G1/S Control.Mol Cell. 2020 Oct 15;80(2):183-192. doi: 10.1016/j.molcel.2020.08.020. Epub 2020 Sep 17. Mol Cell. 2020. PMID: 32946743 Free PMC article. Review.
Cited by
-
High methylation of the 4-aminobutyrate aminotransferase gene predicts a poor prognosis in patients with myelodysplastic syndrome.Int J Oncol. 2019 Feb;54(2):491-504. doi: 10.3892/ijo.2018.4652. Epub 2018 Dec 4. Int J Oncol. 2019. PMID: 30535457 Free PMC article.
-
Navigating Multi-Scale Cancer Systems Biology Towards Model-Driven Clinical Oncology and Its Applications in Personalized Therapeutics.Front Oncol. 2021 Nov 24;11:712505. doi: 10.3389/fonc.2021.712505. eCollection 2021. Front Oncol. 2021. PMID: 34900668 Free PMC article. Review.
-
Modeling Cellular Noise Underlying Heterogeneous Cell Responses in the Epidermal Growth Factor Signaling Pathway.PLoS Comput Biol. 2016 Nov 30;12(11):e1005222. doi: 10.1371/journal.pcbi.1005222. eCollection 2016 Nov. PLoS Comput Biol. 2016. PMID: 27902699 Free PMC article.
-
A study on the predictability of acute lymphoblastic leukaemia response to treatment using a hybrid oncosimulator.Interface Focus. 2018 Feb 6;8(1):20160163. doi: 10.1098/rsfs.2016.0163. Epub 2017 Dec 15. Interface Focus. 2018. PMID: 29285342 Free PMC article.
References
-
- Stamatakos G, Dionysiou D, Lunzer A, Belleman R, Kolokotroni E, Georgiadi E, et al. The technologically integrated oncosimulator: combining multiscale cancer modeling with information technology in the in silico oncology context. IEEE J Biomed Health Inform. 2014;18:840–54. doi: 10.1109/JBHI.2013.2284276. - DOI - PubMed
-
- Kolokotroni E, Ouzounoglou E, Stanulla M, Dionysiou D, Stamatakos GS. In Silico Oncology: Developing and Clinically Adapting the Acute Lymphoblastic Leukemia (ALL) Oncosimulator by Exploiting Pathway Based Gene Expression Analysis in the Context of the ALL-BFM 2000 Clinical Study. Virtual Physiological Human Conference 2014 (VPH 2014). In Virtual Physiological Human Conference 2014 (VPH 2014). Trondheim, Norway.
-
- p-medicine – Grant Agreement no. 270089 Deliverable No. 12.3 Report on the development of the Oncosimulator and the utilization of the biomechanism models. 2013. http://p-medicine.eu/fileadmin/p-medicine/public_website/downloads/p-med.... Accessed 2 May 2015.
-
- p-medicine – Grant Agreement no. 270089 Deliverable No. 12.4 Report on the clinical adaptation and optimization of the Oncosimulator models. In silico studies. 2014. http://p-medicine.eu/fileadmin/p-medicine/public_website/downloads/p-med.... Accessed 2 May 2015.
Publication types
MeSH terms
Substances
LinkOut - more resources
Full Text Sources
Other Literature Sources
Research Materials
