Quantifying Demyelination in NK venom treated nerve using its electric circuit model
- PMID: 26932543
- PMCID: PMC4773768
- DOI: 10.1038/srep22385
Quantifying Demyelination in NK venom treated nerve using its electric circuit model
Abstract
Reduction of myelin in peripheral nerve causes critical demyelinating diseases such as chronic inflammatory demyelinating polyneuropathy, Guillain-Barre syndrome, etc. Clinical monitoring of these diseases requires rapid and non-invasive quantification of demyelination. Here we have developed formulation of nerve conduction velocity (NCV) in terms of demyelination considering electric circuit model of a nerve having bundle of axons for its quantification from NCV measurements. This approach has been validated and demonstrated with toad nerve model treated with crude Naja kaouthia (NK) venom and also shows the effect of Phospholipase A2 and three finger neurotoxin from NK-venom on peripheral nerve. This opens future scope for non-invasive clinical measurement of demyelination.
Figures

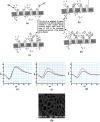
 ≤ A ≤ 1). A = 1 indicates that two axons are aligned exactly, and
  indicates that two axons are evenly staggered. “L” is the internodal length i.e., the distance between two internodes in the nerve. (b) Typical SEM image of normal nerve having bundle of axons in which axon 1 is surrounded by six axons. (c) Correspondingly to SEM image we consider axon 1 is surrounded by six axons of equal diameter. We consider only ephaptic interactions of six surrounded axons on neuro conduction in axon 1. (d) Electric circuit model corresponds to bundle of axons in a nerve shown in the figure. (e) Nerve conduction velocity (NCV in m/s) versus demyelinating factor is obtained by using equation (1). NCV is formulated by using electric circuit model of a nerve having bundle of axons misaligned by alignment factor,
  . The NCV of toad sciatic nerve decreases with increase of demyelination. The experimental points of black dots are obtained from conduction of action potential (latency between proximal and distal action potential) in sciatic nerve of frog model demyelinated by Naja kaouthia crude venom with concentration 0.1, 1.0 and 10 μg/ml. Similarly experimental points of triangle are obtained from sciatic nerves treated with NK-PLA2 (purified from crude venom). The inset of Fig. 1(e) shows demyelination ΔD in μm versus concentration of crude venom/NK-PLA2 (ΔD is the difference between normal nerve thickness and demyelinated nerve, obtained from SEM images shown in Fig. 2). The solid line and dashed line in inset figure are drawn by using experimental points with minimum deviation. The lines are almost close to each other proving NK-PLA2 mainly responsible for demyelination of the nerve of toad model.


Similar articles
-
Electro-Physiology of Coupling Model and Its Impact on Naja Kaouthia Venom Treated Sciatic Nerves of Toad.IEEE Trans Neural Syst Rehabil Eng. 2018 May;26(5):987-992. doi: 10.1109/TNSRE.2018.2824844. IEEE Trans Neural Syst Rehabil Eng. 2018. PMID: 29752233
-
Purification and Characterization of Nk-3FTx: A Three Finger Toxin from the Venom of North East Indian Monocled Cobra.J Biochem Mol Toxicol. 2016 Feb;30(2):59-70. doi: 10.1002/jbt.21734. Epub 2015 Aug 21. J Biochem Mol Toxicol. 2016. PMID: 26293154
-
Binding of a Naja naja venom acidic phospholipase A2 cognate complex to membrane-bound vimentin of rat L6 cells: Implications in cobra venom-induced cytotoxicity.Biochim Biophys Acta Biomembr. 2019 May 1;1861(5):958-977. doi: 10.1016/j.bbamem.2019.02.002. Epub 2019 Feb 15. Biochim Biophys Acta Biomembr. 2019. PMID: 30776333
-
Modulation of C-nociceptive Activities by Inputs from Myelinated Fibers.Adv Exp Med Biol. 2016;904:33-40. doi: 10.1007/978-94-017-7537-3_3. Adv Exp Med Biol. 2016. PMID: 26900061 Review.
-
New evidence for secondary axonal degeneration in demyelinating neuropathies.Neurosci Lett. 2021 Jan 23;744:135595. doi: 10.1016/j.neulet.2020.135595. Epub 2020 Dec 24. Neurosci Lett. 2021. PMID: 33359733 Free PMC article. Review.
Cited by
-
Assessment of tibial and common peroneal nerves in diabetic peripheral neuropathy by diffusion tensor imaging: a case control study.Eur Radiol. 2017 Aug;27(8):3523-3531. doi: 10.1007/s00330-016-4698-3. Epub 2016 Dec 21. Eur Radiol. 2017. PMID: 28004159
References
-
- Jessen K. R. & Mirsky R. The origin and development of axon ensheathment and myelin growth. Nat. Rev. Neurosci. 6, 671–690 (2005). - PubMed
-
- Toothaker T. B. & Brannagan T. H. Chronic inflammatory demyelinating polyneuropathies: current treatment strategies. Curr. Neurol. Neurosci. Rep. 7(1), 63–70 (2007). - PubMed
-
- Berg B. V. D. et al.. Guillain-Barre syndrome: pathogenesis, diagnosis, treatment and prognosis. Nat. Rev. Neurol. 10, 469–482 (2014). - PubMed
Publication types
MeSH terms
Substances
LinkOut - more resources
Full Text Sources
Other Literature Sources

