. 2016 Mar 1;143(5):810-21.
doi: 10.1242/dev.132688.

KMT2D regulates specific programs in heart development via histone H3 lysine 4 di-methylation

Affiliations

KMT2D regulates specific programs in heart development via histone H3 lysine 4 di-methylation

Siang-Yun Ang et al. Development. .

Abstract

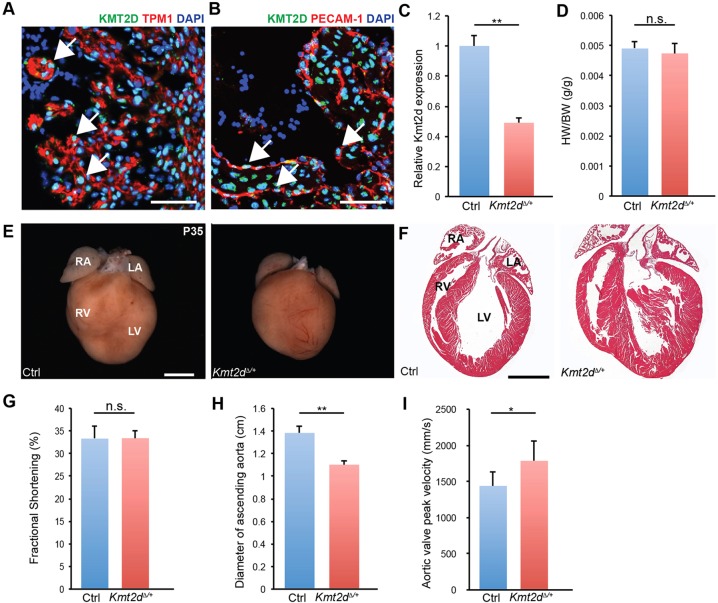
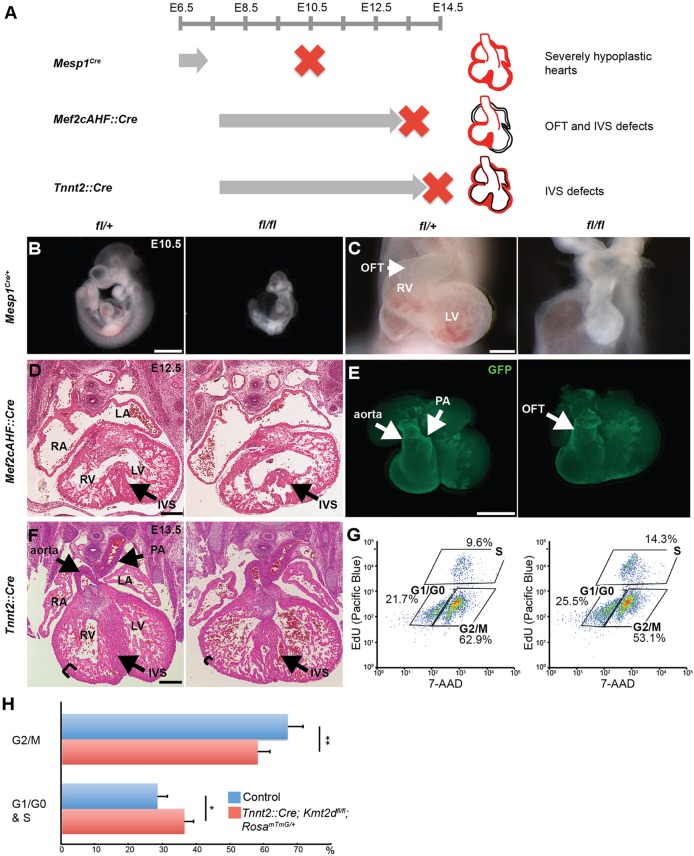
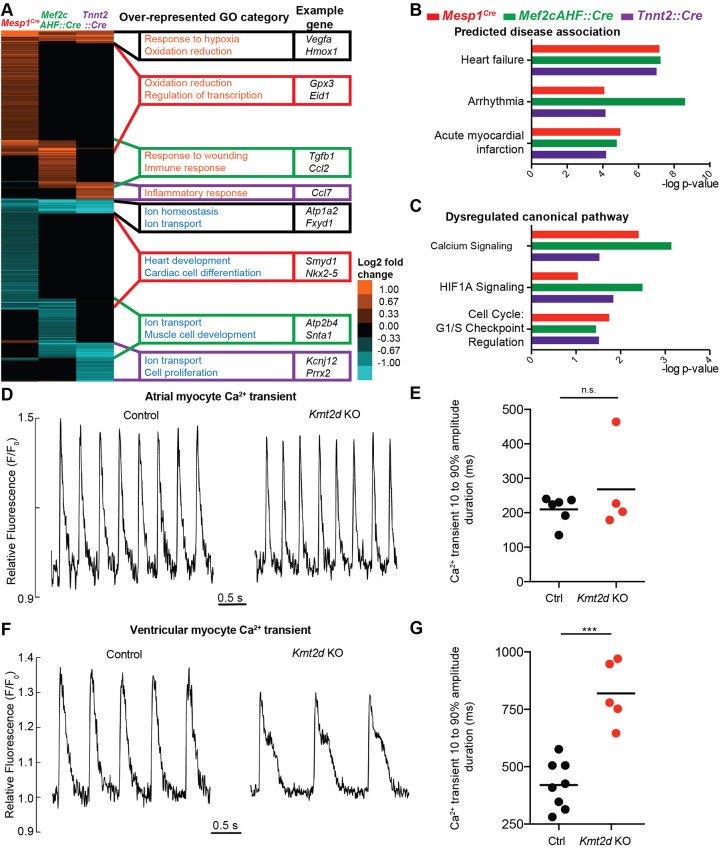
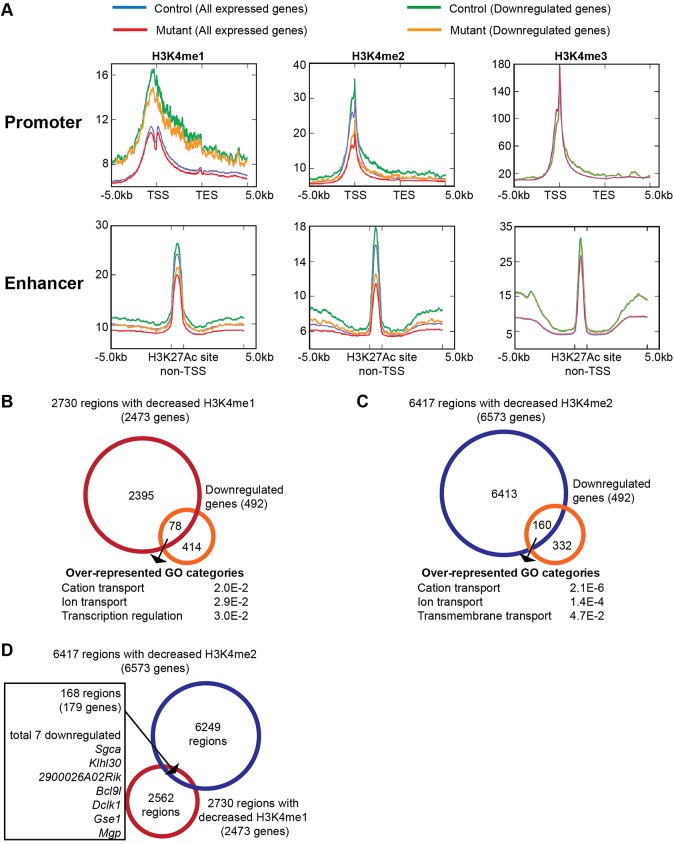
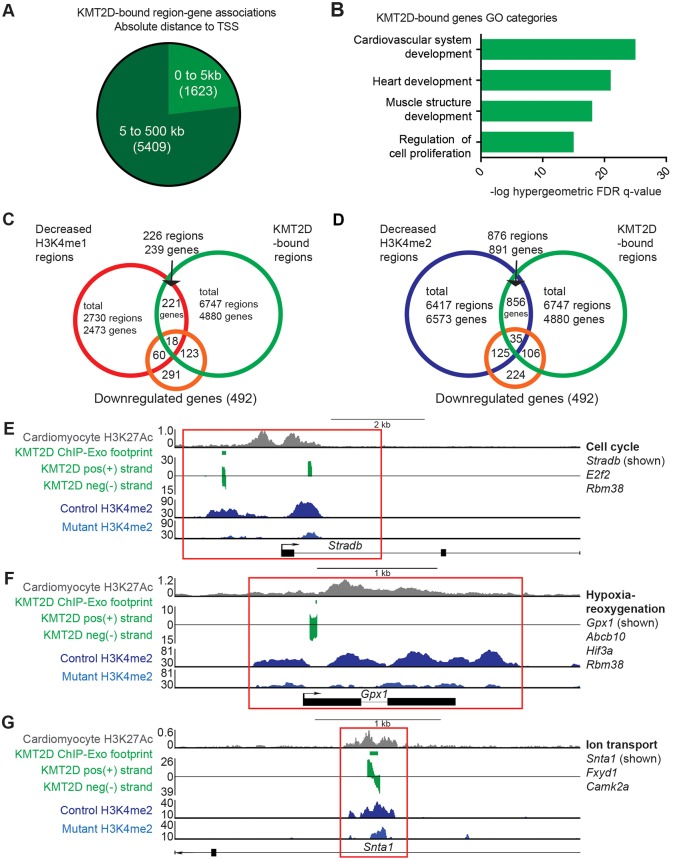
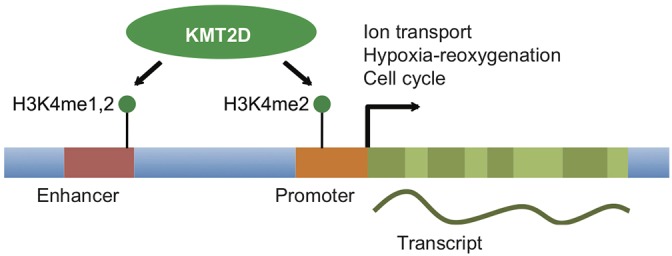
KMT2D, which encodes a histone H3K4 methyltransferase, has been implicated in human congenital heart disease in the context of Kabuki syndrome. However, its role in heart development is not understood. Here, we demonstrate a requirement for KMT2D in cardiac precursors and cardiomyocytes during cardiogenesis in mice. Gene expression analysis revealed downregulation of ion transport and cell cycle genes, leading to altered calcium handling and cell cycle defects. We further determined that myocardial Kmt2d deletion led to decreased H3K4me1 and H3K4me2 at enhancers and promoters. Finally, we identified KMT2D-bound regions in cardiomyocytes, of which a subset was associated with decreased gene expression and decreased H3K4me2 in mutant hearts. This subset included genes related to ion transport, hypoxia-reoxygenation and cell cycle regulation, suggesting that KMT2D is important for these processes. Our findings indicate that KMT2D is essential for regulating cardiac gene expression during heart development primarily via H3K4 di-methylation.

Keywords: ALR; H3K4 methylation; Heart development; KMT2D; Kabuki syndrome; MLL2; MLL4; Mouse.


Conflict of interest statement

Competing interests

The authors declare no competing or financial interests.

Figures

Fig. 1.
Fig. 1.
Kmt2dΔ/+ mice have normal cardiac development but exhibit mild narrowing of the ascending aorta. (A,B) Magnified images of the left ventricle from a four-chamber view section at E12.5 shows (A) KMT2D expression (green) in the nuclei (DAPI, blue) of myocardial cells (TPM1, red) (arrows) and (B) KMT2D expression in the nuclei of endocardial cells (PECAM1, red) (arrows). (C) qRT-PCR for Kmt2d transcript levels in E8.0 control and Kmt2dΔ/+ embryos. (D) Heart weight to body weight ratio of P35 control (n=6) and Kmt2dΔ/+ (n=5) mice. (E) Representative images of P35 control and Kmt2dΔ/+ hearts. (F) Four-chamber view cardiac sections from P35 control and Kmt2dΔ/+ mice stained with Hematoxylin and Eosin (H&E). (G-I) Fractional shortening (G), diameter of the ascending aorta (H) and peak velocity of blood flow through the aortic valve (I) of P35 control and Kmt2dΔ/+ mice. RA, right atrium; LA, left atrium; RV, right ventricle; LV, left ventricle. *P<0.05, **P<0.01; n.s., no significant difference. Error bars indicate s.d. Scale bars: 50 μm in A,B; 2 mm in E; 500 μm in F.
Fig. 2.
Fig. 2.
Deletion of Kmt2d in cardiac precursors and myocardium leads to embryonic lethality and cardiac defects. (A) Schematic overview of Kmt2d deletion phenotypes in mesodermal precursors, anterior heart field (AHF) precursors and cardiomyocytes. (B) E10.5 Mesp1Cre;Kmt2d fl/fl embryos show developmental delay compared with wild-type littermates. (C) E10.5 Mesp1Cre;Kmt2d fl/fl mutants show severely hypoplastic hearts. (D) E12.5 Mef2cAHF::Cre;Kmt2d fl/fl four-chamber view cardiac sections stained with H&E show a disorganized interventricular septum (arrowheads). (E) E12.5 Mef2cAHF::Cre;Kmt2d fl/fl;RosamTmG/+ hearts show defects in outflow tract septation (arrowhead). GFP reporter is expressed in Cre-positive cells. (F) E13.5 Tnnt2::Cre;Kmt2d fl/fl four-chamber view cardiac sections stained with H&E show disorganized interventricular septum (arrowheads) and thin compact myocardium (brackets) in mutants. (G) E12.5 control (WT) and Tnnt2::Cre;Kmt2d fl/fl;RosamTmG/+ (cKO) hearts were labeled with EdU for newly synthesized DNA and EdU-labeled cells were detected with Pacific Blue azide using Click chemistry. Cells were stained with 7-AAD to determine total DNA content and cell cycle distribution was determined by FACS analysis, sorting for Cre-positive cells using GFP reporter. Representative FACS plots of the Cre-positive population show an increase in the number of cells in G1/G0 and S phase and a decrease in G2/M phase in the mutant. (H) Cell cycle analysis of E12.5 control and Tnnt2::Cre;Kmt2d fl/fl;RosamTmG/+ hearts (n=4 per genotype) shows an 8.0% increase in G1/G0 and S phases (P<0.05) and an 8.8% decrease in G2/M phases in mutants (P<0.01). RV, right ventricle; LV, left ventricle; PA, pulmonary artery; OFT, outflow tract; IVS, interventricular septum. *P<0.05, **P<0.01. Error bars indicate s.d. Scale bars: 1 mm in B; 200 μm in C; 250 μm in D,F; 500 μm in E.
Fig. 3.
Fig. 3.
Deletion of Kmt2d in cardiac precursors and myocardium leads to downregulation of ion transport genes and altered calcium handling in ventricular cardiomyocytes. (A) RNA-Seq analysis comparing differentially expressed genes in E9.0 Mesp1Cre;Kmt2d fl/fl mutant hearts, E11.5 Mef2cAHF::Cre;Kmt2d fl/fl right ventricles and outflow tract and E11.5 Tnnt2::Cre;Kmt2d fl/fl mutant hearts (FDR<0.05). (B) IPA of differentially expressed genes in all three deletion genotypes shows that common disease associations that were significantly predicted are related to heart failure (P<0.05). (C) IPA shows that common canonical pathways that were significantly dysregulated are associated with calcium signaling, HIF1A signaling and G1/S cell cycle checkpoint regulation (P<0.05). (D) Representative Fluo-4 fluorescence recordings from control and Tnnt2::Cre;Kmt2d fl/fl (Kmt2d KO) atrial myocytes isolated at E11.5. (E) Mean durations of Ca2+-dependent Fluo-4 fluorescence transients plotted for control and Kmt2d KO atrial myocytes. Each point represents the Ca2+ transient duration from myocytes representing one embryonic heart, as determined at the level between 10% of the upstroke and 90% of the decay. An average of 5.8 samples (cells or clusters) were combined per point. n.s., no significant difference. (F) Representative Fluo-4 fluorescence recordings (upper panel) from control and Kmt2d KO ventricular myocytes isolated at E11.5. Typically, the Ca2+ transients, expressed relative to diastolic fluorescence (F0), showed similar peak amplitudes but strong differences in duration due to the presence of a late shoulder or plateau in the Kmt2d KO myocytes. (G) Mean durations of Ca2+-dependent Fluo-4 fluorescence transients plotted for control and Kmt2d KO ventricular myocytes. An average of 23 samples (cells or clusters) were combined per point. Kmt2d KO ventricular myocytes had a significantly prolonged duration at 819±137 ms (n=5) compared with controls at 420±103 ms (n=8) (***P<0.001).
Fig. 4.
Fig. 4.
Myocardial deletion of Kmt2d results in a decrease in average H3K4me1 and H3K4me2 levels at enhancers and promoters. (A) Metagene profiles showing the average distribution of H3K4me1, H3K4me2 and H3K4me3 input-normalized tag density at promoters and enhancers in E11.5 control and Tnnt2::Cre;Kmt2d fl/fl hearts. For all expressed genes and 492 downregulated genes analyzed, mutants show decreased H3K4me1 levels at enhancers, decreased H3K4me2 levels at promoters and enhancers, and no difference in H3K4me3 levels. (B) 2730 regions with decreased H3K4me1 levels (FDR<0.1) are assigned to 2473 genes by proximity using Stanford GREAT. GO categories of 78 downregulated genes with decreased H3K4me1 in mutant hearts are over-represented for ion transport genes. (C) 6417 regions with decreased H3K4me2 levels (FDR<0.1) are assigned to 6573 genes by proximity using GREAT. GO categories of 162 downregulated genes with decreased H3K4me2 are over-represented for ion transport genes. (D) Venn diagram representing the overlap of 2730 regions with decreased H3K4me1 with 6417 regions with decreased H3K4me2. Of the overlapping 168 regions mapped to 179 genes, only seven genes are downregulated in E11.5 Tnnt2::Cre;Kmt2d fl/fl hearts. TSS, transcription start site; TES, transcription end site.
Fig. 5.
Fig. 5.
KMT2D binds to promoter and enhancer regions of genes related to cell cycle, hypoxia-reoxygenation and ion transport. (A) 6747 regions bound by KMT2D in in vitro cardiomyocytes are assigned to 4880 genes by proximity using Stanford GREAT. 1623 region-gene associations are within 5 kb of a TSS and 5409 region-gene associations are 5 to 100 kb of a TSS. (B) GO categories of KMT2D-bound genes are over-represented for heart development and cell proliferation. (C) Venn diagram showing that only a subset of 18 genes overlap between 492 downregulated genes in E11.5 Tnnt2::Cre;Kmt2dfl/fl hearts and regions bound by KMT2D with decreased H3K4me1 levels (FDR<0.1). (D) Venn diagram showing that only a subset of 35 genes overlap between 492 downregulated genes in E11.5 Tnnt2::Cre;Kmt2dfl/fl hearts and regions bound by KMT2D with decreased H3K4me2 levels (FDR<0.1). (E) Representative browser tracks of KMT2D ChIP-Exo positive strand, negative strand, and resulting footprint shows that KMT2D binds to the TSS of the cell cycle gene Stradb in cardiomyocytes, which corresponds to a region with decreased H3K4me2 (FDR<0.1) in mutant hearts (red box). (F) KMT2D binds to the TSS of the antioxidant enzyme gene Gpx1 in cardiomyocytes, which corresponds to a region with decreased H3K4me2 (FDR<0.1) in mutant hearts (red box). (G) KMT2D binds to the intronic H3K27Ac-enriched enhancer of the ion transport gene Snta1 in in vitro cardiomyocytes, which corresponds to a region with decreased H3K4me2 (FDR<0.1) in mutant hearts (red box). The H3K27Ac browser track y-axis corresponds to reads per million; for the other tracks the y-axis corresponds to input-normalized tag density.
Fig. 6.
Fig. 6.
KMT2D is required for H3K4 di-methylation (and mono-methylation) to maintain specific gene expression programs in heart development. Diagrammatic representation of a protein-coding gene, including promoter and enhancer, acted upon by KMT2D to deposit the histone modifications H3K4me1 and H3K4me3.

Similar articles

Cited by

References

    1. Abela D., Ritchie H., Ababneh D., Gavin C., Nilsson M. F., Khan M. K., Carlsson K. and Webster W. S. (2010). The effect of drugs with ion channel-blocking activity on the early embryonic rat heart. Birth Defects Res. B Dev. Reprod. Toxicol. 89, 429-440. 10.1002/bdrb.20270 - DOI - PubMed
    1. Alexander J. M., Hota S. K., He D., Thomas S., Ho L., Pennacchio L. A. and Bruneau B. G. (2015). Brg1 modulates enhancer activation in mesoderm lineage commitment. Development 142, 1418-1430. 10.1242/dev.109496 - DOI - PMC - PubMed
    1. Bayeva M., Khechaduri A., Wu R., Burke M. A., Wasserstrom A., Singh N., Liesa M., Shirihai O. S., Langer N. B., Paw B. H. et al. (2013). ATP-binding cassette B10 regulates early steps of heme synthesis. Circ. Res. 113, 279-287. 10.1161/CIRCRESAHA.113.301552 - DOI - PMC - PubMed
    1. Bernstein B. E., Kamal M., Lindblad-Toh K., Bekiranov S., Bailey D. K., Huebert D. J., McMahon S., Karlsson E. K., Kulbokas E. J., Gingeras T. R. et al. (2005). Genomic maps and comparative analysis of histone modifications in human and mouse. Cell 120, 169-181. 10.1016/j.cell.2005.01.001 - DOI - PubMed
    1. Boudeau J., Miranda-Saavedra D., Barton G. J. and Alessi D. R. (2006). Emerging roles of pseudokinases. Trends Cell Biol. 16, 443-452. 10.1016/j.tcb.2006.07.003 - DOI - PubMed

Publication types

MeSH terms