Plasmodium yoelii infection of BALB/c mice results in expansion rather than induction of CD4(+) Foxp3(+) regulatory T cells
- PMID: 26932746
- PMCID: PMC4863568
- DOI: 10.1111/imm.12602
Plasmodium yoelii infection of BALB/c mice results in expansion rather than induction of CD4(+) Foxp3(+) regulatory T cells
Abstract
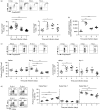
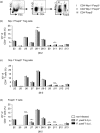
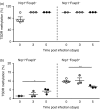
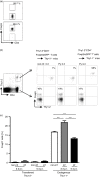
Recently, we demonstrated elevated numbers of CD4(+) Foxp3(+) regulatory T (Treg) cells in Plasmodium yoelii-infected mice contributing to the regulation of anti-malarial immune response. However, it remains unclear whether this increase in Treg cells is due to thymus-derived Treg cell expansion or induction of Treg cells in the periphery. Here, we show that the frequency of Foxp3(+) Treg cells expressing neuropilin-1 (Nrp-1) decreased at early time-points during P. yoelii infection, whereas percentages of Helios(+) Foxp3(+) Treg cells remained unchanged. Both Foxp3(+) Nrp-1(+) and Foxp3(+) Nrp-1(-) Treg cells from P. yoelii-infected mice exhibited a similar T-cell receptor Vβ chain usage and methylation pattern in the Treg-specific demethylation region within the foxp3 locus. Strikingly, we did not observe induction of Foxp3 expression in Foxp3(-) T cells adoptively transferred to P. yoelii-infected mice. Hence, our results suggest that P. yoelii infection triggered expansion of naturally occurring Treg cells rather than de novo induction of Foxp3(+) Treg cells.
Keywords: parasitic protozoan; regulatory T cells; rodent.
© 2016 John Wiley & Sons Ltd.
Figures


Similar articles
-
Strong impact of CD4+ Foxp3+ regulatory T cells and limited effect of T cell-derived IL-10 on pathogen clearance during Plasmodium yoelii infection.J Immunol. 2012 Jun 1;188(11):5467-77. doi: 10.4049/jimmunol.1102223. Epub 2012 Apr 27. J Immunol. 2012. PMID: 22544931
-
Concurrent infection with Heligmosomoides polygyrus suppresses anti-Plasmodium yoelii protection partially by induction of CD4(+)CD25(+)Foxp3(+) Treg in mice.Eur J Immunol. 2009 Oct;39(10):2822-30. doi: 10.1002/eji.200939433. Eur J Immunol. 2009. PMID: 19728313
-
Resistance of regulatory T cells to glucocorticoid-induced [corrected] TNFR family-related protein (GITR) during Plasmodium yoelii infection.Eur J Immunol. 2005 Dec;35(12):3516-24. doi: 10.1002/eji.200526073. Eur J Immunol. 2005. PMID: 16304635
-
Induction and maintenance of regulatory T cells by transcription factors and epigenetic modifications.J Autoimmun. 2017 Sep;83:113-121. doi: 10.1016/j.jaut.2017.07.002. Epub 2017 Jul 11. J Autoimmun. 2017. PMID: 28709726 Review.
-
Anergy into T regulatory cells: an integration of metabolic cues and epigenetic changes at the Foxp3 conserved non-coding sequence 2.F1000Res. 2018 Dec 17;7:F1000 Faculty Rev-1938. doi: 10.12688/f1000research.16551.1. eCollection 2018. F1000Res. 2018. PMID: 30613389 Free PMC article. Review.
Cited by
-
T cell-mediated immunity to malaria.Nat Rev Immunol. 2019 Jul;19(7):457-471. doi: 10.1038/s41577-019-0158-z. Nat Rev Immunol. 2019. PMID: 30940932 Free PMC article. Review.
-
DC-Derived IL-10 Modulates Pro-inflammatory Cytokine Production and Promotes Induction of CD4+IL-10+ Regulatory T Cells during Plasmodium yoelii Infection.Front Immunol. 2017 Feb 28;8:152. doi: 10.3389/fimmu.2017.00152. eCollection 2017. Front Immunol. 2017. PMID: 28293237 Free PMC article.
-
Depletion of regulatory T cells in ongoing paracoccidioidomycosis rescues protective Th1/Th17 immunity and prevents fatal disease outcome.Sci Rep. 2018 Nov 8;8(1):16544. doi: 10.1038/s41598-018-35037-8. Sci Rep. 2018. PMID: 30410119 Free PMC article.
-
T Cell-Specific Overexpression of Acid Sphingomyelinase Results in Elevated T Cell Activation and Reduced Parasitemia During Plasmodium yoelii Infection.Front Immunol. 2019 May 31;10:1225. doi: 10.3389/fimmu.2019.01225. eCollection 2019. Front Immunol. 2019. PMID: 31214184 Free PMC article.
-
Macrophage migration inhibitory factor contributes to immunopathogenesis during Plasmodium yoelii 17XL infection.Front Cell Infect Microbiol. 2022 Aug 24;12:968422. doi: 10.3389/fcimb.2022.968422. eCollection 2022. Front Cell Infect Microbiol. 2022. PMID: 36093199 Free PMC article.
References
-
- Maizels R. Regulation of the immune system in metazoan parasite infections. Novartis Found Symp 2007; 281:192–204. - PubMed
-
- McSorley HJ, Harcus YM, Murray J, Taylor MD, Maizels RM. Expansion of Foxp3+ regulatory T cells in mice infected with the filarial parasite Brugia malayi . J Immunol 2008; 181:6456–66. - PubMed
-
- Kandulski A, Wex T, Kuester D, Peitz U, Gebert I, Roessner A, Malfertheiner P. Naturally occurring regulatory T cells (CD4+, CD25high, FOXP3+) in the antrum and cardia are associated with higher H. pylori colonization and increased gene expression of TGF‐β1. Helicobacter 2008; 13:295–303. - PubMed
-
- Walther M, Tongren JE, Andrews L, Korbel D, King E, Fletcher H, Andersen RF et al Upregulation of TGF‐β, FOXP3, and CD4+CD25+ regulatory T cells correlates with more rapid parasite growth in human malaria infection. Immunity 2005; 23:287–96. - PubMed
Publication types
MeSH terms
Substances
Associated data
- Actions
LinkOut - more resources
Full Text Sources
Other Literature Sources
Medical
Research Materials
Miscellaneous

