

Analytical workflow of double-digest restriction site-associated DNA sequencing based on empirical and in silico optimization in tomato
- PMID: 26932983
- PMCID: PMC4833422
- DOI: 10.1093/dnares/dsw004
Analytical workflow of double-digest restriction site-associated DNA sequencing based on empirical and in silico optimization in tomato
Abstract
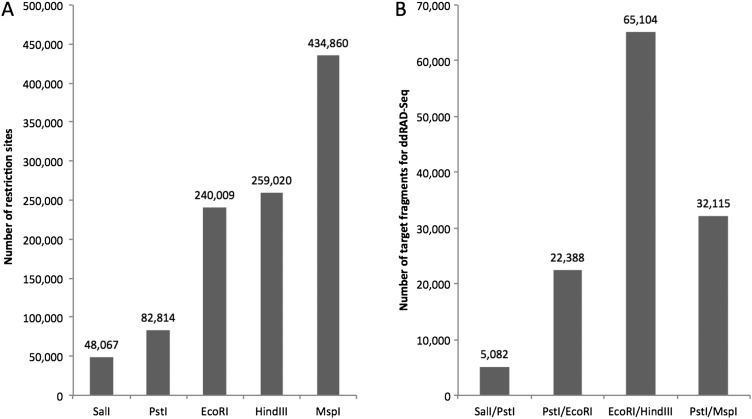
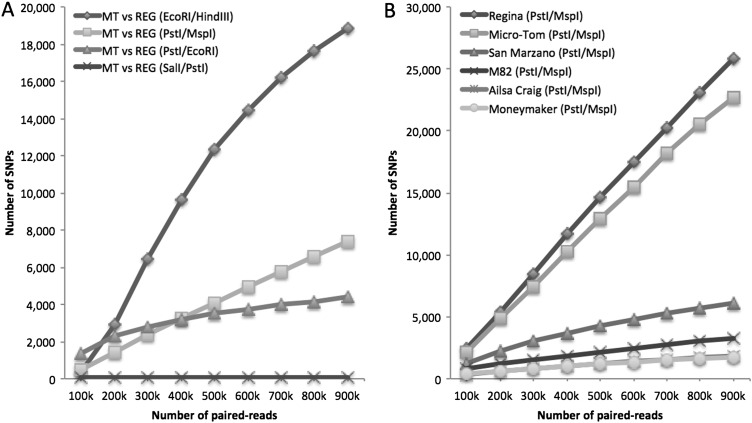
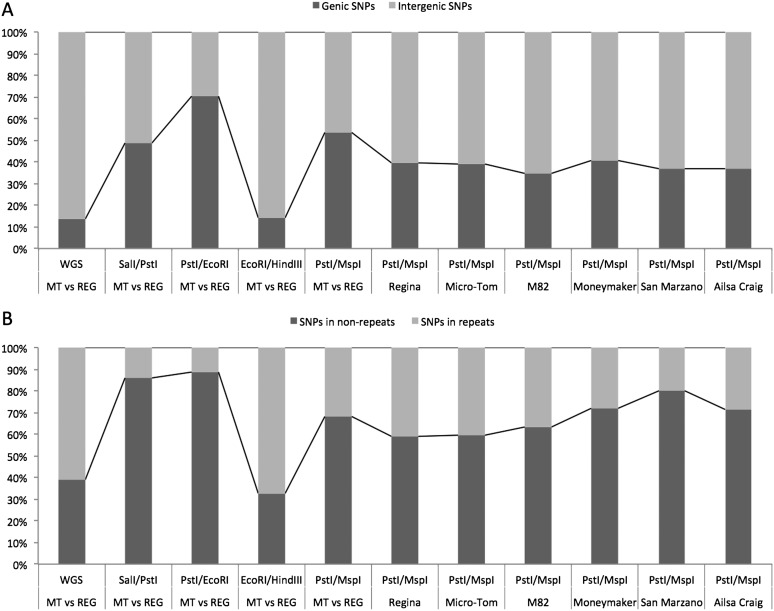
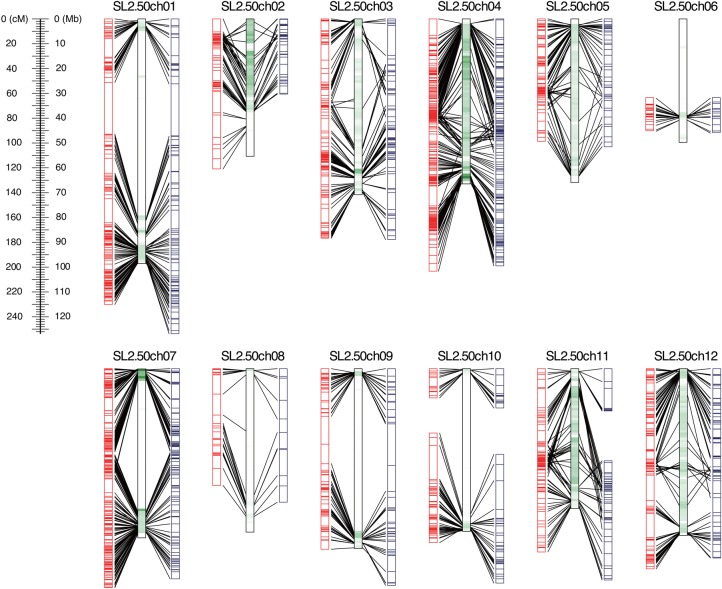
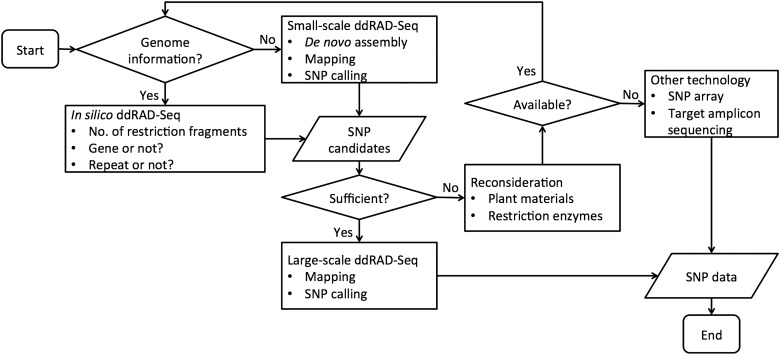
Double-digest restriction site-associated DNA sequencing (ddRAD-Seq) enables high-throughput genome-wide genotyping with next-generation sequencing technology. Consequently, this method has become popular in plant genetics and breeding. Although computational in silico prediction of restriction sites from the genome sequence is recognized as an effective approach for choosing the restriction enzymes to be used, few reports have evaluated the in silico predictions in actual experimental data. In this study, we designed and demonstrated a workflow for in silico and empirical ddRAD-Seq analysis in tomato, as follows: (i)in silico prediction of optimum restriction enzymes from the reference genome, (ii) verification of the prediction by actual ddRAD-Seq data of four restriction enzyme combinations, (iii) establishment of a computational data processing pipeline for high-confidence single nucleotide polymorphism (SNP) calling, and (iv) validation of SNP accuracy by construction of genetic linkage maps. The quality of SNPs based on de novo assembly reference of the ddRAD-Seq reads was comparable with that of SNPs obtained using the published reference genome of tomato. Comparisons of SNP calls in diverse tomato lines revealed that SNP density in the genome influenced the detectability of SNPs by ddRAD-Seq. In silico prediction prior to actual analysis contributed to optimization of the experimental conditions for ddRAD-Seq, e.g. choices of enzymes and plant materials. Following optimization, this ddRAD-Seq pipeline could help accelerate genetics, genomics, and molecular breeding in both model and non-model plants, including crops.
Keywords: genetic linkage map; in silico prediction; restriction-associated DNA sequencing; single nucleotide polymorphism; tomato (Solanum lycopersicum).
© The Author 2016. Published by Oxford University Press on behalf of Kazusa DNA Research Institute.
Figures
Similar articles
-
Variant calling and genotyping accuracy of ddRAD-seq: Comparison with 20X WGS in layers.PLoS One. 2024 Jul 26;19(7):e0298565. doi: 10.1371/journal.pone.0298565. eCollection 2024. PLoS One. 2024. PMID: 39058708 Free PMC article.
-
Comparative analysis of RAD-seq methods for SNP discovery and genetic diversity assessment in oil seed crop safflower.Sci Rep. 2025 Jul 2;15(1):22600. doi: 10.1038/s41598-025-06706-2. Sci Rep. 2025. PMID: 40595120 Free PMC article.
-
Genotyping for Species Identification and Diversity Assessment Using Double-Digest Restriction Site-Associated DNA Sequencing (ddRAD-Seq).Methods Mol Biol. 2020;2107:159-187. doi: 10.1007/978-1-0716-0235-5_8. Methods Mol Biol. 2020. PMID: 31893447
-
Elucidating the process of SNPs identification in non-reference genome crops.J Biomol Struct Dyn. 2023;41(24):15682-15690. doi: 10.1080/07391102.2023.2194002. Epub 2023 Apr 5. J Biomol Struct Dyn. 2023. PMID: 37021361 Review.
-
Functional genomics of tomato: opportunities and challenges in post-genome NGS era.J Biosci. 2014 Dec;39(5):917-29. doi: 10.1007/s12038-014-9480-6. J Biosci. 2014. PMID: 25431420 Review.
Cited by
-
Variant calling and genotyping accuracy of ddRAD-seq: Comparison with 20X WGS in layers.PLoS One. 2024 Jul 26;19(7):e0298565. doi: 10.1371/journal.pone.0298565. eCollection 2024. PLoS One. 2024. PMID: 39058708 Free PMC article.
-
Genomic insight into the developmental history of southern highbush blueberry populations.Heredity (Edinb). 2021 Jan;126(1):194-205. doi: 10.1038/s41437-020-00362-0. Epub 2020 Sep 1. Heredity (Edinb). 2021. PMID: 32873965 Free PMC article.
-
SNP discovery of Korean short day onion inbred lines using double digest restriction site-associated DNA sequencing.PLoS One. 2018 Aug 7;13(8):e0201229. doi: 10.1371/journal.pone.0201229. eCollection 2018. PLoS One. 2018. PMID: 30086138 Free PMC article.
-
Identification of genome-wide single-nucleotide polymorphisms among geographically diverse radish accessions.DNA Res. 2020 Feb 1;27(1):dsaa001. doi: 10.1093/dnares/dsaa001. DNA Res. 2020. PMID: 32065621 Free PMC article.
-
A self-compatible pear mutant derived from γ-irradiated pollen carries an 11-Mb duplication in chromosome 17.Front Plant Sci. 2024 Mar 5;15:1360185. doi: 10.3389/fpls.2024.1360185. eCollection 2024. Front Plant Sci. 2024. PMID: 38504898 Free PMC article.
References
-
- Gupta P.K., Rustgi S., Mir R.R.. 2008, Array-based high-throughput DNA markers for crop improvement, Heredity, 101, 5–18. - PubMed
-
- Xing Y. 2014, SNP array – a powerful platform to accelerate genetic studies and breeding, J. Plant Biochem. Physiol., 2, e119.
-
- Davey J.W., Hohenlohe P.A., Etter P.D., Boone J.Q., Catchen J.M., Blaxter M.L.. 2011, Genome-wide genetic marker discovery and genotyping using next-generation sequencing, Nat. Rev. Genet., 12, 499–510. - PubMed
Publication types
MeSH terms
Substances
LinkOut - more resources
Full Text Sources
Other Literature Sources
