. 2016 Mar 1;9(417):ra23.
doi: 10.1126/scisignal.aaa9227.

Cytokinesis involves a nontranscriptional function of the Hippo pathway effector YAP

Affiliations

Cytokinesis involves a nontranscriptional function of the Hippo pathway effector YAP

Duyen Amy Bui et al. Sci Signal. .

Abstract

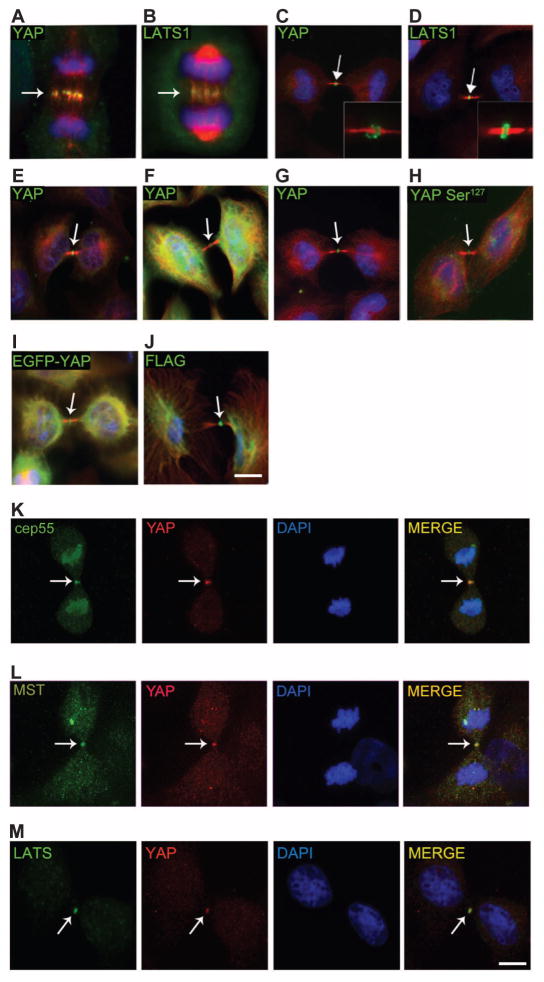
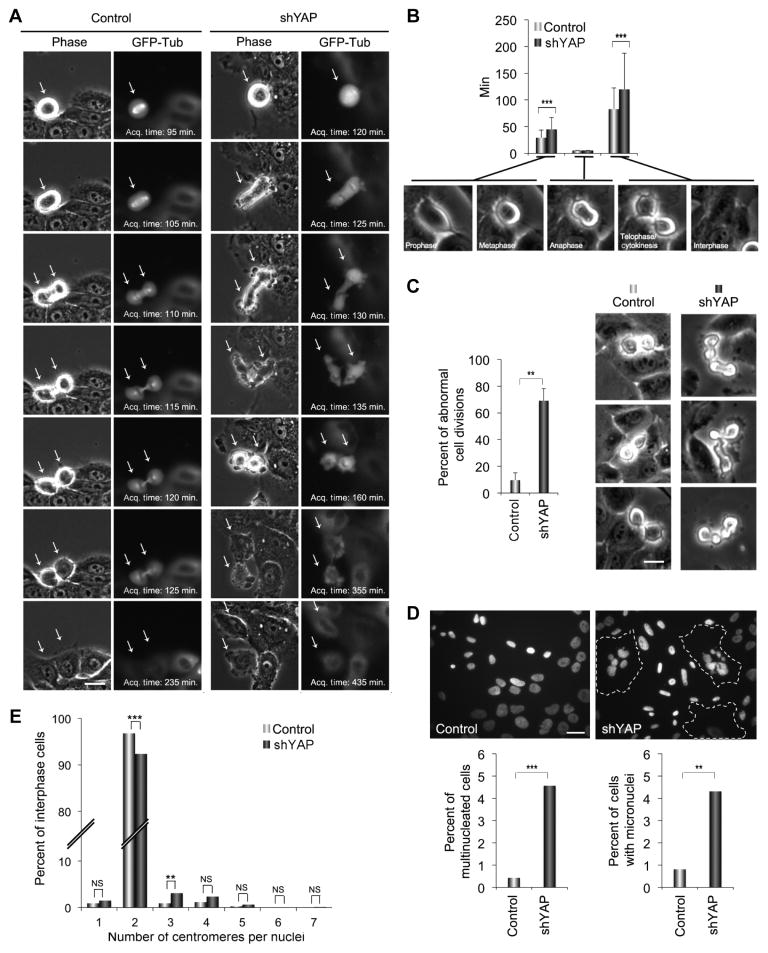
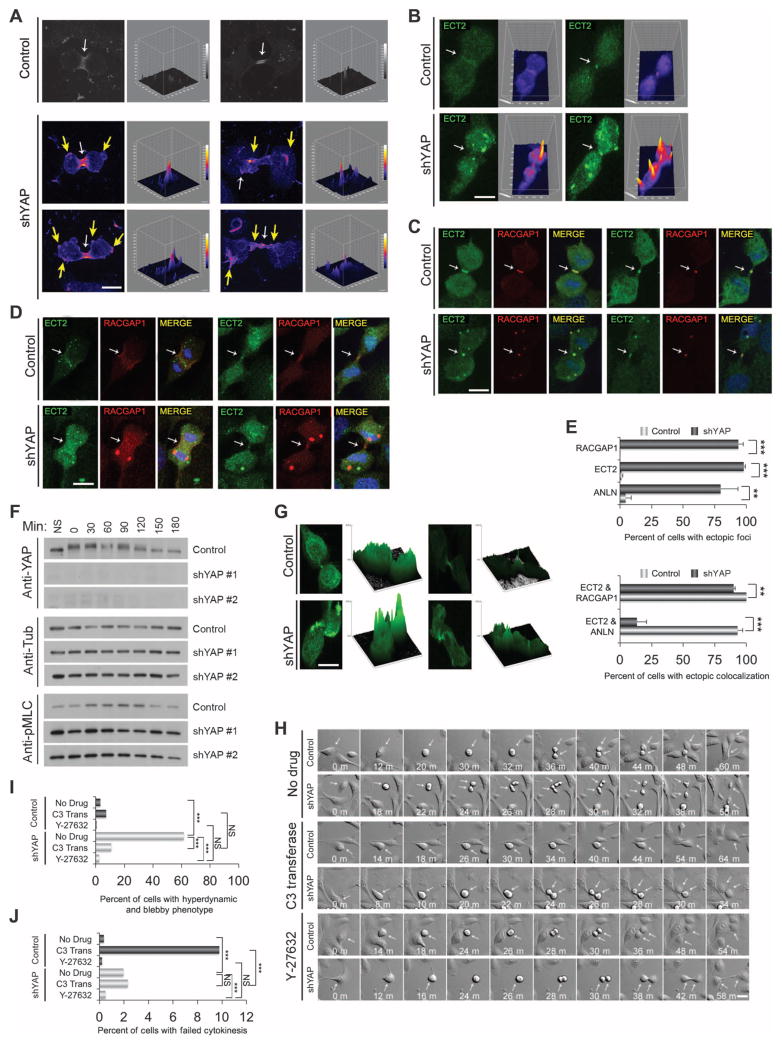
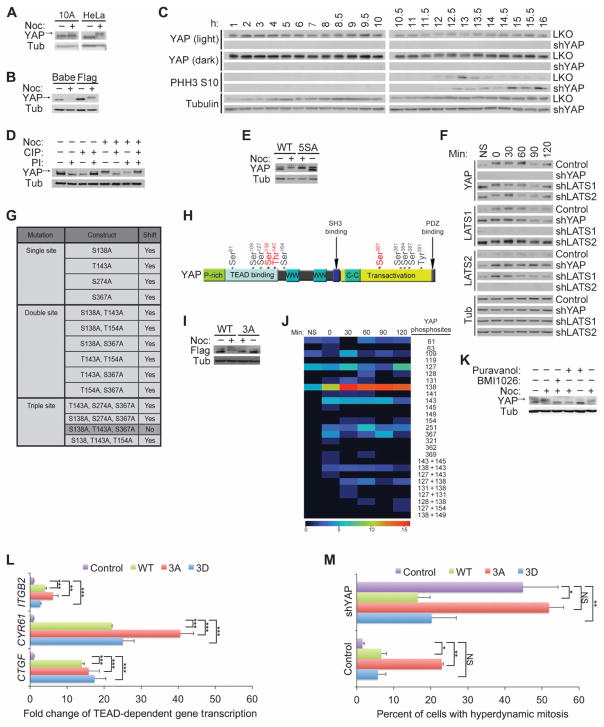
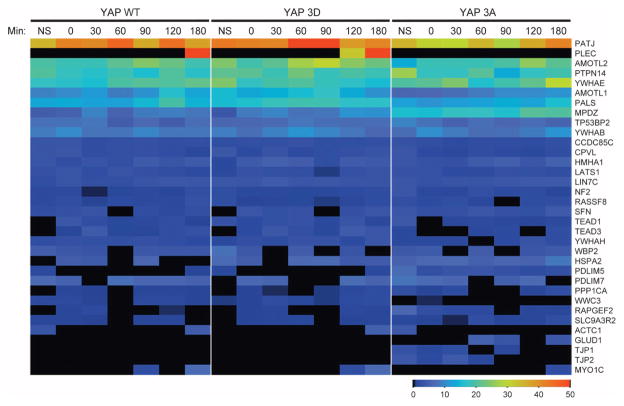
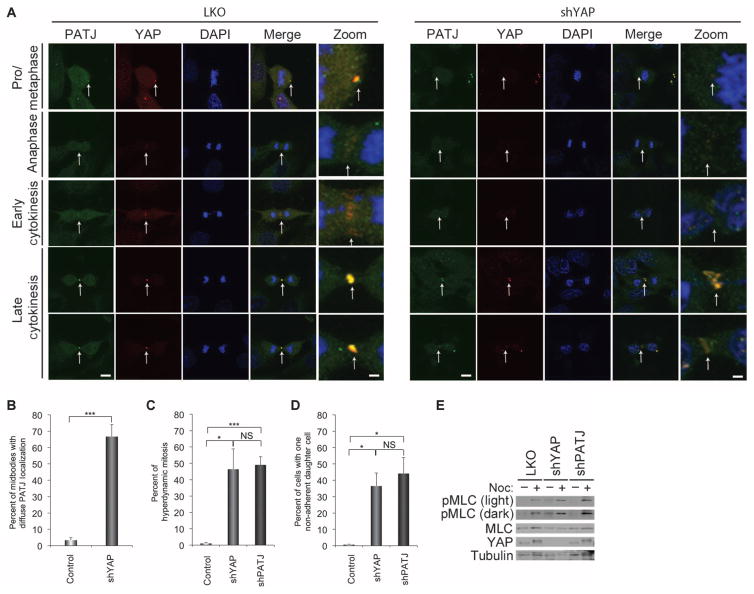
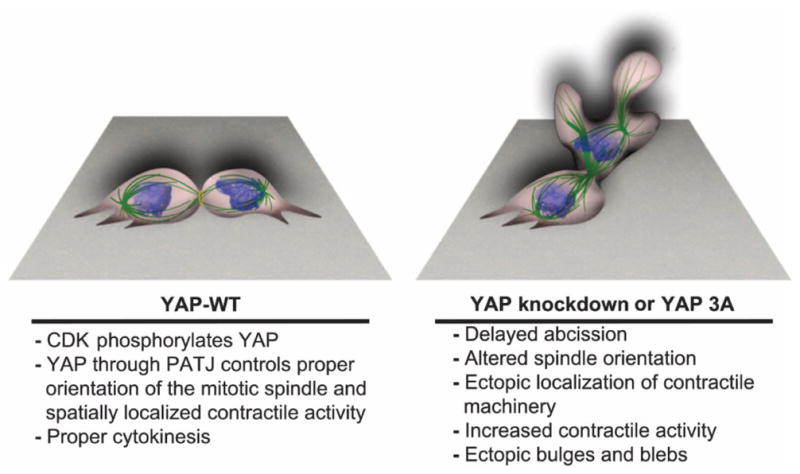
YAP is a transcriptional coactivator that controls organ expansion and differentiation and is inhibited by the Hippo pathway in cells in interphase. Here, we demonstrated that, during mitosis, YAP localized to the midbody and spindle, subcellular structures that are involved in cytokinesis, the process by which contraction of the cytoskeleton produces two daughter cells. Furthermore, YAP was phosphorylated by CDK1, a kinase that promotes cell cycle progression. Knockdown of YAP by shRNA or expression of a nonphosphorylatable form of YAP delayed the separation of daughter cells (called abscission) and induced a cytokinesis phenotype associated with increased contractile force, membrane blebbing and bulges, and abnormal spindle orientation. Consequently, these defects led to an increased frequency of multinucleation, micronuclei, and aneuploidy. YAP was required for proper localization of proteins that regulate contraction during cytokinesis, including ECT2, MgcRacGap, Anillin, and RHOA. In addition, depletion of YAP increased the phosphorylation of myosin light chain, which would be expected to activate the contractile activity of myosin II, the molecular motor involved in cytokinesis. The polarity scaffold protein PATJ coprecipitated with YAP and colocalized with YAP at the cytokinesis midbody, and knockdown of PATJ phenocopied the cytokinetic defects and spindle orientation alterations induced by either YAP depletion or expression of a nonphosphorylatable YAP mutant. Together, these results reveal an unanticipated role for YAP in the proper organization of the cytokinesis machinery during mitosis through interaction with the polarity protein PATJ.


Conflict of interest statement

Competing interests: The authors declare that they have no competing interests.

Figures

Fig. 1
Fig. 1. YAP localizes to the central spindle and to the midbody ring
(A and B) Endogenous YAP (A) and LATS1 (B) localize to the central spindle of MCF-10A cells in anaphase. YAP (Cell Signaling Technology) and LATS1 (Bethyl Laboratories Inc.), green; tubulin, red; and 4′,6-diamidino-2-phenylindole (DAPI), blue. (C to F) YAP (Cell Signaling Technology) (C) and LATS1 (Bethyl Laboratories Inc.) (D) localize to the midbody ring of MCF-10A cells during cytokinesis (green); inset shows midbody ring. Other YAP antibodies [Abcam, (E); Sigma-Aldrich, (F)] show localization to the mid-body ring in MCF-10A cells (green). (G) YAP localizes to the midbody ring in HeLa cells (green). (H) YAP Ser127 (Cell Signaling Technology) localization in MCF-10A. (I to M) Overexpressed exogenous EGFP-YAP (I) or Flag-YAP (J) in HeLa cells localizes to the midbody ring. YAP (red) colocalizes with Cep55 (K), MST (L), and LATS1 (green) (M) at the midbody. Arrows indicate the central spindle or midbody region. Scale bars, 5 μm. (A) to (J) are representative of 95 images obtained from three independent experiments. (K) to (M) are representative of 35 images obtained from three independent experiments.
Fig. 2
Fig. 2. Loss of YAP disrupts cytokinesis
(A) Representative time-lapse images of mitosis of MCF-10A cells expressing GFP-tubulin (GFP-Tub) and infected with an empty lentiviral vector (control) or a vector encoding an shRNA targeting YAP (shYAP) during mitosis. Arrows indicate mitotic cells. shYAP cells show extensive blebbing and altered morphology during mitosis. Scale bar, 5 μm. Acq., acquisition. (B) Graph shows mean duration of mitosis (+SD) from three independent experiments for control (n = 127) and shYAP (n = 116) cells at the indicated division stages. The duration of anaphase was less than the time-lapse minimum interval for all cells. (C) Images show control and shYAP MCF-10A cells in cytokinesis. Graph shows percent of the cell divisions in control (n = 127) and shYAP-expressing (n = 116) cells with abnormal morphology, as represented in the images in (A). Scale bar, 5 μm. Bars are means + SEM from three independent experiments. (D) Top panels show representative images of cell nuclei (DAPI) in control and shYAP MCF-10A cells; dotted lines indicate multinucleated cells. Graphs show percent of multi-nucleate cells or cells with micronuclei pooled from two experiments for control (n = 676) and shYAP (n = 655) cells. Scale bar, 10 μm. (E) FISH analysis of control (n = 114) and siYAP-expressing (n = 129) MCF-10A cells. Graph depicts the number of centromeres per nucleus for the indicated cells pooled from two independent experiments. Statistical significance [***P < 001; **P < 0.01; *P < 0.05; NS (not significant), P > 0.05] was assessed by unpaired Student’s t test in (B) and (C) and by Fisher’s exact test in (D) and (E).
Fig. 3
Fig. 3. YAP is required for proper cleavage furrow contractility
(A) Representative examples of RHOA immunostains at early (left panels) and late (right panels) cytokinesis in control (n = 27) and shYAP (n = 33) MCF-10A cells. Cells were monitored on gridded coverslips to identify cells undergoing cytokinesis and were immunostained for RHOA (red). Surface intensity plots are shown to the right of each image to visualize the positions of RHOA. White arrows indicate normal RHOA staining, and yellow arrows indicate abnormal RHO Aectopicfoci. Scale bar, 5 μm. Images were obtained from three independent experiments. (B) Representative images of ECT2 localization (green) during cytokinesis incontrol (n = 119) or shYAP (n = 127)MCF-10A cells. Corresponding surface plots of ECT2 staining intensity. Scale bar, 5 μm. Images were obtained from three independent experiments. (C) Colocalization (merge) of ECT2 (green) and RACGAP1 (red) for control (n = 46) or shYAP (n = 41) MCF10A cells. Scale bar, 5 μm. Images were obtained from three independent experiments.(D)Colocalization(merge) of ECT2 (green) and ANLN (red) for control(n =23) or shYAP (n = 27) MCF10A cells. Scale bar, 5 μm. Images were obtained from four independent experiments. (E) Quantification of the percent of cells with mislocalized foci for ECT2, RACGAP1, and ANLN and quantification of the percent of cells showing ectopic colocalization between RACGAP1 and ECT2 or ANLN and ECT2. RACGAP1 and ECT2 ectopic foci colocalized but ANLN and ECT2 foci did not. Statistical significance (***P<001;**P<0.01;*P<0.05;NS,P>0.05) was assessed by unpaired Student’s t test. Bars represent means + SEM from three independent experiments. (F) Lysates from HeLa cells expressing control plasmid or two different shYAP hairpins (#1 or #2) were immunoblotted for phosphorylated MLC (pMLC), YAP, and tubulin, at the indicated times after nocodazole release. Immunoblots are representative of two independent experiments. (G) Representative images from control (n = 40) and YAP knockdown (n = 26) cells were obtained from three independent experiments showing phosphorylated MLC immunostaining in cytokinesis. Surface intensity plots are shown to the right of each immunostaining image to visualize the intensity of phosphorylated MLC throughout the cell. Scale bar, 5 μm. (H) Representative time-lapse images of control or shYAP MCF-10A cells undergoing cell division. Analysis was obtained from YAP knockdown cells treated with no drug (n = 747), the Rho inhibitor C3 transferase (n = 973), or the ROCK inhibitor Y-27632 (n = 729) and LKO control cells (Control) treated with no drug (n = 983), C3 transferase Rho inhibitor (n = 514), or Y-27632 ROCK inhibitor (n=870). Arrows indicate mitotic cells. Scale bar, 10 μm.(I) Quantification of YAP-depleted mitotic cells that display the hyperdynamic cell division phenotype, which consists of considerable blebbing and bulging. C3 Trans, C3 transferase. (J) Quantification of failed division for the indicated treatments. Data in (I) and (J) were pooled from two independent experiments and assessed for statistical significance (***P < 001; **P < 0.01; *P < 0.05; NS, P > 0.05) with Fisher’s exact test.
Fig. 4
Fig. 4. YAP is differentially phosphorylated during mitosis
(A) Immunoblot of endogenous YAP from MCF-10A (10A) or HeLa cells treated with nocodazole (Noc). Arrow indicates the phosphorylated form of YAP. Immunoblot is representative of two independent experiments. (B) YAP immunoblot of exogenously expressed pBabeFlagYAP (Flag) or pBabePuro control (Babe) in HeLa cells treated with nocodazole. Immunoblots are representative of two independent experiments. (C) Immunoblot of HeLa cells with double thymidine block shows that YAP was phosphorylated during mitotic phase of the cell cycle. Phosphohistone H3 S10 (PHH3 S10) is a mitotic marker of the cell cycle, and tubulin is used as a loading control. The number of hours after release from the double thymidine block is indicated. Immunoblots are representative of two independent experiments. (D) YAP and tubulin immunoblots of CIP- and PI-treated lysates from HeLa cells treated with nocodazole. Arrow indicates the phosphorylated form of YAP. Immunoblots are representative of two independent experiments. (E) Immunoblot of lysates of nocodazole-treated HeLa cells expressing either the Flag-YAP combination mutant for the five LATS phosphorylation sites YAP S61A, S109A, S127A, S164A, S381A (5SA) or wild-type (WT) Flag-YAP .Immunoblots are representative of two independent experiments. (F) Anti-YAP immunoblot of lysates of HeLa cells expressing shRNAs against YAP, LATS1 or LATS2 or LKO empty vector showing the YAP mobility shift with nocodazole treatment. Immunoblots are representative of two independent experiments. (G) Table indicating the single, double, or triple phosphorylation site mutants used to identify the mitotic sites. Nocodazole treatment was used to identify the combination of mutations that could reverse the mitotic shift in immunoblot assays. Highlighted in darker gray is the combination of mutations (YAP S138A, T143A, and S367A, referred to as Flag–YAP 3A) that reversed the mitotic shift. (H) Schematic map showing locations of our identified mitotic phosphorylation sites on YAP (red) relative to previously identified YAP phosphorylation sites (gray) and TEAD-, SH3-, WW1-, WW2-, and PDZ-binding domains. (I) Anti-Flag immunoblot of nocodazole analysis of the combination alanine mutant Flag–YAP 3A shows that loss of YAP sites Ser138, Thr143, and Ser367 reversed the mitotic shift. Immunoblot is representative of three independent experiments. (J) MS heat map of total spectral counts of WT YAP phosphosites from nonsynchronized (NS) or mitotic MCF-10A cells after release from nocodazole treatment (after 0, 30, 60, 90, 120, and 180 min). The right-hand labels indicate the phosphorylation site or sites identified. Data are representative of two independent experiments. (K) Immunoblot analysis of HeLa cells treated with CDK inhibitor Puravanol A or BMI1026. Arrow indicates the phosphorylated form of YAP. Immunoblots are representative of two independent experiments. (L) Quantitative reverse transcription polymerase chain reaction (RT-PCR) analysis of cells expressing YAP WT, YAP 3A, YAP 3D, and empty vector control for the indicated TEAD-dependent transcriptional genes; representative of three biological replicates. Results were normalized to the housekeeping gene RPLP0 and are presented as mean fold change + SD. Statistical significance (***P < 001; **P < 0.01; *P < 0.05; NS, P > 0.05) was assessed by Student’s t test compared to control LKO. (M) Time-lapse analysis of the hyperdynamic phenotype of MCF-10A cells expressing the phosphomutants or shYAP cells reconstituted with the various phosphomutants. Quantification of the summary of three independent experiments from mitotic cells transfected with LKO (Control) and control pBABE (n = 542), YAP WT (n = 216), YAP 3A (n = 332), or YAP 3D (n = 229) or cells transfected with shYAP and control pBABE (n = 84), YAP WT (n = 117), YAP 3A (n = 119), or YAP 3D (n = 40). Data are represented as means + SEM, and statistical significance (***P < 001; **P < 0.01; *P < 0.05; NS, P > 0.05) was assessed by Student’s t test.
Fig. 5
Fig. 5. Proteins that coprecipitate with YAP
Heat map of normalized total spectral counts of LC-MS/MS-identified and CompPASS-analyzed interacting proteins for YAP WT, YAP 3A, or YAP 3D from nonsynchronized or mitotic cells after release from nocodazole treatment at the indicated times. Data are representative of two independent experiments.
Fig. 6
Fig. 6. Interaction of PATJ and YAP in mitotic cells
(A) Representative immunostaining images of the localization of endogenous PATJ (green) and YAP (red) to the midbody in mitotic cells. Zoom shows magnification of colocalized areas of the midzone and midbody. Loss of YAP results in diffuse immunostaining of PATJ in the cleavage and midbody region. Scale bars, 1 μm in zoomed images and 5 μm in all others. Representative images from 60 control cells and 50 shYAP cells. (B) Quantitation of the number of cells with diffuse immunostaining of PATJ in the cleavage and midbody region. (C and D) Quantification of cells with the hyperdynamic phenotype (D) or with the nonadherent daughter cell phenotype (D) in cells expressing shPATJ (n = 232), shYAP (n = 277), or control LKO (n = 2206). Bars in (B), (C), and (D) represent means + SEM of three experiments each performed in triplicate. Statistical significance (***P < 001; **P < 0.01; *P < 0.05; NS, P > 0.05) was assessed by unpaired Student’s t test compared to control LKO. (E) Contractile activity for these conditions was also analyzed by immunoblot of phosphorylated MLC activity. MLC and tubulin were used as internal loading controls. Immunoblots are representative of three independent experiments.
Fig. 7
Fig. 7. Model for YAP regulation in cytokinesis
CDK-mediated phosphorylation promotes the interaction of YAP with the polarity protein PATJ to regulate proper spindle orientation and localized cellular contraction during cytokinesis.

Comment in

  • Properly dividing with YAP.
    Pfeifer GP. Pfeifer GP. Sci Signal. 2016 Mar 1;9(417):fs3. doi: 10.1126/scisignal.aaf2527. Sci Signal. 2016. PMID: 26933061

Similar articles

Cited by

References

    1. Sudol M. Yes-associated protein (YAP65) is a proline-rich phosphoprotein that binds to the SH3 domain of the Yes proto-oncogene product. Oncogene. 1994;9:2145–2152. - PubMed
    1. Zhao B, Ye X, Yu J, Li L, Li W, Li S, Yu J, Lin JD, Wang CY, Chinnaiyan AM, Lai ZC, Guan KL. TEAD mediates YAP-dependent gene induction and growth control. Genes Dev. 2008;22:1962–1971. - PMC - PubMed
    1. Yagi R, Chen LF, Shigesada K, Murakami Y, Ito Y. A WW domain-containing Yes-associated protein (YAP) is a novel transcriptional co-activator. EMBO J. 1999;18:2551–2562. - PMC - PubMed
    1. Huang J, Wu S, Barrera J, Matthews K, Pan D. The Hippo signaling pathway coordinately regulates cell proliferation and apoptosis by inactivating Yorkie, the Drosophila Homolog of YAP. Cell. 2005;122:421–434. - PubMed
    1. Zender L, Spector MS, Xue W, Flemming P, Cordon-Cardo C, Silke J, Fan ST, Luk JM, Wigler M, Hannon GJ, Mu D, Lucito R, Powers S, Lowe SW. Identification and validation of oncogenes in liver cancer using an integrative oncogenomic approach. Cell. 2006;125:1253–1267. - PMC - PubMed

Publication types

MeSH terms