. 2016 Apr 5;113(14):E2066-72.
doi: 10.1073/pnas.1601702113. Epub 2016 Mar 1.

Architectural transitions in Vibrio cholerae biofilms at single-cell resolution

Affiliations

Architectural transitions in Vibrio cholerae biofilms at single-cell resolution

Knut Drescher et al. Proc Natl Acad Sci U S A. .

Abstract

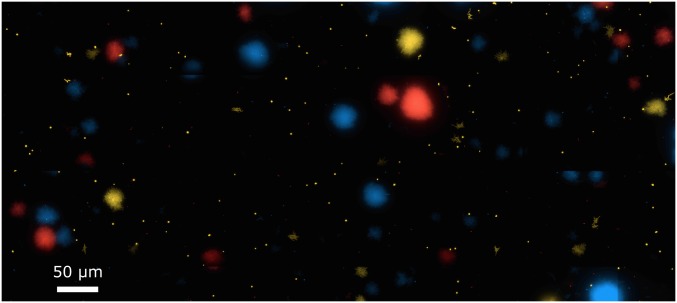
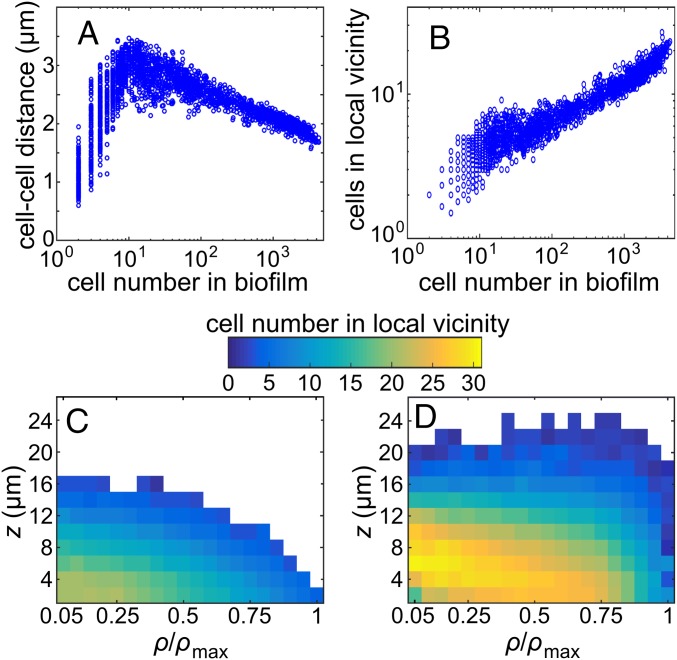
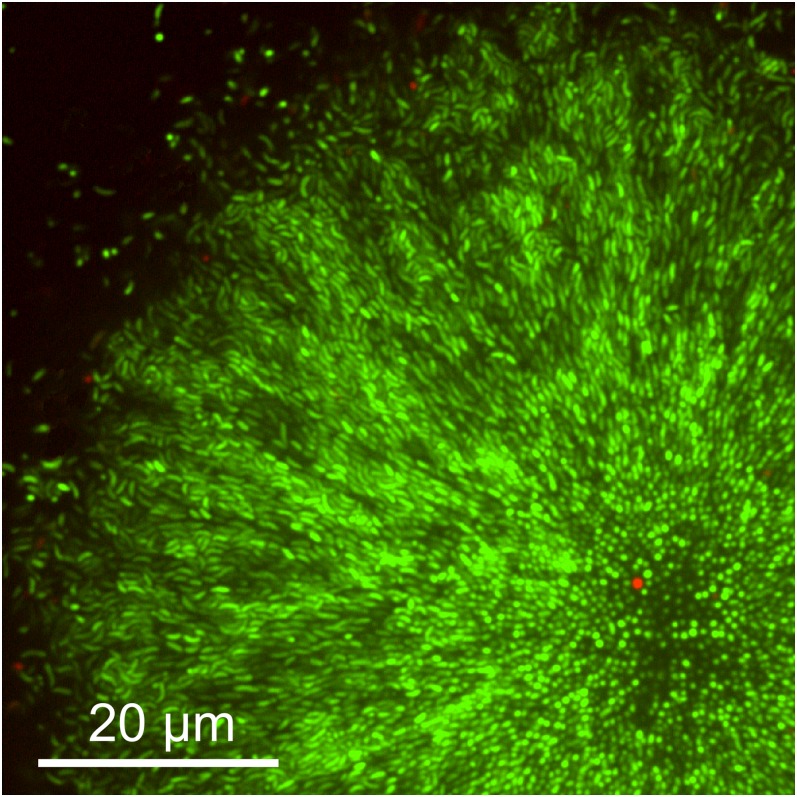
Many bacterial species colonize surfaces and form dense 3D structures, known as biofilms, which are highly tolerant to antibiotics and constitute one of the major forms of bacterial biomass on Earth. Bacterial biofilms display remarkable changes during their development from initial attachment to maturity, yet the cellular architecture that gives rise to collective biofilm morphology during growth is largely unknown. Here, we use high-resolution optical microscopy to image all individual cells in Vibrio cholerae biofilms at different stages of development, including colonies that range in size from 2 to 4,500 cells. From these data, we extracted the precise 3D cellular arrangements, cell shapes, sizes, and global morphological features during biofilm growth on submerged glass substrates under flow. We discovered several critical transitions of the internal and external biofilm architectures that separate the major phases of V. cholerae biofilm growth. Optical imaging of biofilms with single-cell resolution provides a new window into biofilm formation that will prove invaluable to understanding the mechanics underlying biofilm development.

Keywords: biofilm; community; emergent order; nematic order; self-organization.


Conflict of interest statement

The authors declare no conflict of interest.

Figures

Fig. 1.
Fig. 1.
V. cholerae wild-type biofilm at single-cell resolution. (A) Planar cross-sections through the biofilm at heights z = 0.6 µm, 12.6 µm, and 24.6 µm. (B) All individual cells from A were automatically segmented into separate 3D objects, which are color-coded in panel B according to the heights of their centers of mass using the color scale indicated at the top right. Panels A and B show the identical biofilm, which was grown until time t = 24.5 h and contains N = 4,543 cells. Global morphological parameters for this particular biofilm are indicated by the red data points in Fig. 2.
Fig. S1.
Fig. S1.
Biofilms investigated in this study are monoclonal and arise from founder cells. Biofilms grown for 30 h in the standard flow-channel assay are shown (see Materials and Methods). Strains are KDV103, KDV104, and KDV158 (see Table S1). These strains harbor genes encoding fluorescent proteins at the chromosomal lacZ site in wild-type V. cholerae N16961, under the control of the constitutive Ptac promoter. Fluorescent proteins are mTFP1 (blue), mKO (yellow), and mKate2 (red). The image demonstrates that biofilm colonies contain bacteria of a single color, indicating that cells of different lineages did not join biofilms that had already formed and that biofilms predominantly grow from a single founder cell or a cluster of clonal cells.
Fig. 2.
Fig. 2.
The growth laws and global morphology of V. cholerae wild-type biofilms. Each of the 2,429 data points in the subpanels represents a different biofilm. The red data point is the biofilm shown in Fig. 1. (A) Number of cells in biofilms as a function of incubation time. (B) The biofilm volume, calculated as the convex hull containing all of the cells inside each biofilm, shows a transition in slope around N = 102. The Inset shows the same data on a linear–linear scale. The green line depicts the running average of the data. (C) The peak height of the biofilm is the z-component of the center of the highest cell and reaches a maximum at ∼20 µm under the growth conditions tested. (D and E) Fitting an ellipse to the base of the biofilm in the XY plane yields a “width-A” and “width-B” for the biofilm, corresponding to the major and minor axes of the ellipse, respectively. For small N, ellipse fitting only provides qualitatively accurate results, whereas for large N, the ellipse fits are highly accurate. Panel D shows that the height of the biofilm remains lower than the width-A (a ratio height/width-A = 1 would correspond to a hemisphere), whereas the cross-section in the XY plane becomes nearly circular as the cell number in the biofilms increases.
Fig. S2.
Fig. S2.
Free surface and contact area of wild-type V. cholerae biofilms. (A) The free surface area of a biofilm is defined as the surface area of the biofilm colony (excluding the area that is in contact with the substratum). (B) The contact area of a biofilm colony is defined as the area that is occupied by the biofilm on the substratum. (C) The dimensionless ratio of the free surface area to the contact area. For a hemisphere, the ratio free surface/contact area = 2. (D) Free surface area as in panel A but on logarithmic axes. (E) Contact area as in panel B but on logarithmic axes. Each data point results from one biofilm.
Fig. 3.
Fig. 3.
Cell density depends on position inside biofilms and changes during V. cholerae biofilm growth. (A) The average distance to the center of mass of the nearest five neighboring cells from any individual cell center of mass in the biofilm, averaged over all cells in the entire biofilm, strongly depends on the total number of cells in the biofilm. (B) The cell number in the local vicinity, averaged over all cells in each biofilm and plotted as a function of the number of cells in the biofilm, shows a steady increase in cell density with biofilm size. The local vicinity in this figure is defined as a sphere of radius r = 3 µm around the center of each cell. (C and D) Spatially resolved average cell number in the local vicinity. To offset the effect that the cells in the bottom-most layers have fewer neighbors due to geometric constraints, the biofilm was mirrored at the z = 0 plane before calculating the cell number in the local vicinity in panels C and D. For panel C, 45 biofilms with N = 600–800 cells were averaged, using cylindrical coordinates. For panel D, 15 biofilms with N = 3,500–4,000 cells were averaged.
Fig. S3.
Fig. S3.
Cell sizes during biofilm growth and the heterogeneous distribution of cells inside biofilms. (A) Mean cell length for biofilms that contain different numbers of cells. (B) Mean aspect ratio of cells inside the biofilm for biofilms that contain different numbers of cells. For panels A and B, each data point results from one biofilm. (C) Spatially resolved average cell length in µm. For this graph, 15 biofilms with N = 3,500–4,000 cells were averaged using cylindrical coordinates. (D) The spatially resolved cell aspect ratio, averaged for the same set of biofilms shown in panel C.
Fig. S4.
Fig. S4.
Imaging live and dead cells in V. cholerae biofilms. To assess whether dead cells might play a role in shaping biofilm architecture, we applied the LIVE/DEAD BacLight bacterial viability stain (Life Technologies) to V. cholerae biofilms. This procedure stains the nucleic acids of all cells green, and cells with a compromised membrane are stained red. Only a few cells in the biofilm appear to have compromised membranes.
Fig. 4.
Fig. 4.
Transitions in local and global ordering of cells during wild-type V. cholerae biofilm growth. (A) Schematic drawing illustrating the definition of the local vicinity. The local vicinity is defined as a sphere of radius r around the center of each cell (denoted in blue; cells in the local vicinity are shown in pink). (B) The local nematic order parameter S(r) is color-coded and displayed for different radii r of the local vicinity, as a function of cell number in the biofilm. The red horizontal line in panel A indicates one value of r for which a more detailed graph is shown in panel C. (C) The biofilm architecture undergoes a transition in cell ordering as biofilms grow from N = 1–10 cells (a loss of order) and a further transition for biofilms for N > 2,000 cells (a gain in order). Solid lines are running averages of the red or black data points. (D) An XZ-slice through the center of a biofilm with N = 3,975 cells shows the internal architecture. Cells are colored according to their values of nz, the z-component of their orientation vector. (E) Biofilm local order parameter S from simulations for r = 6 µm. A “hedgehog”-type cellular arrangement corresponds to a von Mises–Fisher parameter κ >> 1, whereas complete disorder occurs for κ < 1. Our experimental data from panel C show that, for the simulated values of N, the local order parameter S ranges from 0.14–0.35, indicating that, for V. cholerae biofilms, κ = 3–10, which signifies an approximately hedgehog-type cellular arrangement.
Fig. S5.
Fig. S5.
Measuring the volume fraction of V. cholerae biofilms. To obtain an accurate visualization of the cell volume, we stained biofilms with the nucleic acid stain SYTO 9 and with the membrane stain FM4-64 (Life Technologies). (A) The nucleic acid stain labels the nucleoid, which fills most of the cytoplasm. (B) The membrane stain. (C) Merging panels A and B. (D) Binary image from our cell segmentation algorithm, obtained from panel A. (E) To obtain a binary image that more accurately describes the cell volume, we binarized both panels A and B to obtain the image shown in panel E. The volume fraction was calculated from images like panel E. The membrane stain revealed that 0.2 µm should be added to both the cell length and the cell width after extracting these values from images that are based on the nucleic acid stain.
Fig. S6.
Fig. S6.
Biofilm volume for different V. cholerae strains. The vpvCW240R strain is a matrix hyperproducing strain. The ΔrbmA, ΔrbmC, and Δbap1 strains each lack a specific component of the extracellular matrix. The luxOD47E strain is locked in the quorum-sensing low-cell density state, whereas the ΔluxO strain is locked in the quorum-sensing high-cell density state. The dependence of the biofilm volume on the number of cells inside the biofilm is similar for all strains that were investigated. The Insets show log–log plots of the data from each panel and fits of the parameter α, defined in the main manuscript. Each data point in this figure results from one biofilm.
Fig. S7.
Fig. S7.
Peak height for biofilms made by different V. cholerae strains. Strains are as in Fig. S6. The dependence of the biofilm peak height for the ΔrbmA strain is different from all other strains investigated. Relative to all other strains examined, the ΔrbmA strain peak height increases more slowly with cell number. Each data point in every panel results from one biofilm.
Fig. S8.
Fig. S8.
Aspect ratios of biofilm morphologies for different V. cholerae strains. The height corresponds to the peak height shown in Fig. S7, the parameters width-A and width-B are defined in Fig. 2E. Strains are as in Fig. S6. Each data point in every panel results from one biofilm.
Fig. 5.
Fig. 5.
The internal biofilm architecture of the V. cholerae ΔrbmA mutant strongly deviates from that of wild-type V. cholerae. (A) The average z-component of each cell orientation, nz, is shown for V. cholerae wild type; the matrix mutants ΔrbmA, ΔrbmC, and Δbap1; the matrix hyperproducing mutant vpvCW240R; and the quorum-sensing mutants ΔluxO and luxOD47E. Error bars indicate the SD from at least three different biofilms with N = 1,500–2,500 cells for each strain. Detailed global and morphological comparisons between the biofilms of these mutants are provided in Figs. S6–S8. (B and C) The segmented cells in an XZ-slice through a biofilm with N = 114 cells (B) and N = 1,658 cells (C) are shown, in which individual cells are colored according to their orientation along the z-direction, nz, using the same color scale as in Fig. 4D and Fig. 6.
Fig. 6.
Fig. 6.
The different phases of V. cholerae wild-type biofilm growth. (A and B) Biofilms in phase I consist of highly ordered N = 1∼6 cells growing along a line, and all cells are bound to the glass substratum. Panel A shows a representative image, and panel B shows the top and side views of the segmented cells in the community. (C and D) Biofilms in phase II consist of N = 20∼100 cells, which form a 2D community with low local order, in which all cells remain in contact with the glass substratum. (E and F) Biofilms in phase III consist of N = 200∼1,000 cells that form a disordered 3D community. Panel E shows the average magnitude of the z-component of the cellular orientation vector <nz>. For the heat map, 26 biofilms with N = 500–600 cells were averaged and the results plotted using cylindrical coordinates with radial coordinate ρ, normalized by the maximum cylindrical radius of the biofilm ρmax. Panel F shows all detected cells in an XZ-slice through a biofilm with N = 510 cells; individual cells are colored according to their value of nz, as indicated in the color bar. (G and H) Biofilms in phase IV are highly ordered 3D communities with N > 2,000 cells. Panel G shows <nz> averaged for 11 biofilms with N = 3,800–4,600 cells, using cylindrical coordinates. Panel H shows the cells in an XZ-slice through a biofilm with N = 3,975 cells; individual cells are colored according to their orientation along the z-direction, nz. Biofilms with cell numbers in between these four growth phases are undergoing transitions from 1D to 2D growth, from 2D to 3D disordered growth, or from 3D disordered to ordered growth, respectively.

Comment in

References

    1. Hall-Stoodley L, Costerton JW, Stoodley P. Bacterial biofilms: From the natural environment to infectious diseases. Nat Rev Microbiol. 2004;2(2):95–108. - PubMed
    1. Teschler JK, et al. Living in the matrix: Assembly and control of Vibrio cholerae biofilms. Nat Rev Microbiol. 2015;13(5):255–268. - PMC - PubMed
    1. Persat A, et al. The mechanical world of bacteria. Cell. 2015;161(5):988–997. - PMC - PubMed
    1. Parsek MR, Greenberg EP. Sociomicrobiology: The connections between quorum sensing and biofilms. Trends Microbiol. 2005;13(1):27–33. - PubMed
    1. Römling U, et al. Microbial biofilm formation: A need to act. J Intern Med. 2014;276(2):98–110. - PubMed

Publication types

MeSH terms