

Visual Field Outcomes for the Idiopathic Intracranial Hypertension Treatment Trial (IIHTT)
- PMID: 26934136
- PMCID: PMC4777274
- DOI: 10.1167/iovs.15-18626
Visual Field Outcomes for the Idiopathic Intracranial Hypertension Treatment Trial (IIHTT)
Abstract
Purpose: The Idiopathic Intracranial Hypertension Treatment Trial (IIHTT) showed that acetazolamide provided a modest, significant improvement in mean deviation (MD). Here, we further analyze visual field changes over the 6-month study period.
Methods: Of 165 subjects with mild visual loss in the IIHTT, 125 had perimetry at baseline and 6 months. We evaluated pointwise linear regression of visual sensitivity versus time to classify test locations in the worst MD (study) eye as improving or not; pointwise changes from baseline to month 6 in decibels; and clinical consensus of change from baseline to 6 months.
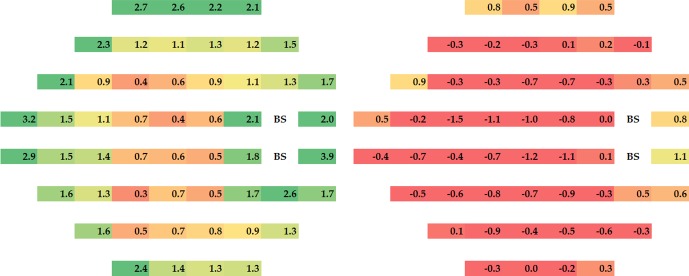
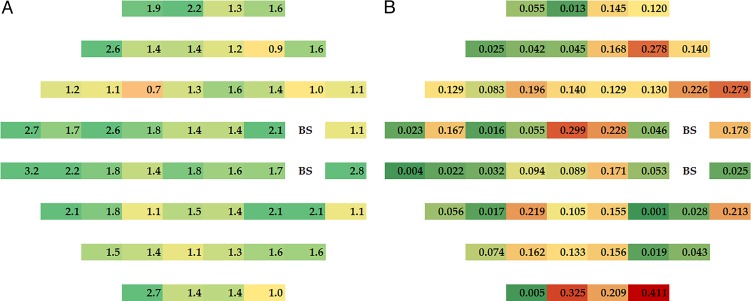
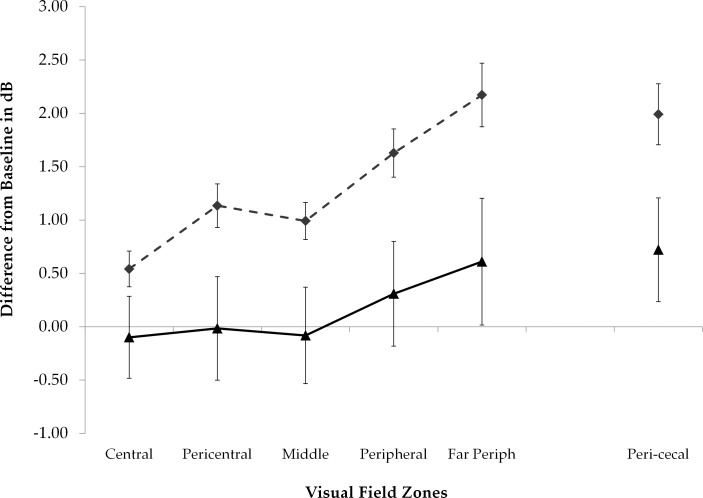
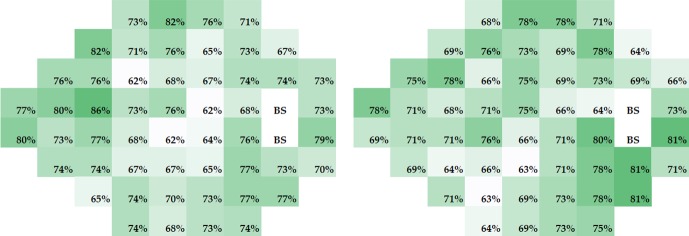
Results: The average study eye had 36 of 52 test locations with improving sensitivity over 6 months using pointwise linear regression, but differences between the acetazolamide and placebo groups were not significant. Pointwise results mostly improved in both treatment groups with the magnitude of the mean change within groups greatest and statistically significant around the blind spot and the nasal area, especially in the acetazolamide group. The consensus classification of visual field change from baseline to 6 months in the study eye yielded percentages (acetazolamide, placebo) of 7.2% and 17.5% worse, 35.1% and 31.7% with no change, and 56.1% and 50.8% improved; group differences were not statistically significant.
Conclusions: In the IIHTT, compared to the placebo group, the acetazolamide group had a significant pointwise improvement in visual field function, particularly in the nasal and pericecal areas; the latter is likely due to reduction in blind spot size related to improvement in papilledema. (ClinicalTrials.gov number, NCT01003639.).
Figures
References
-
- Wall M,, George D. Idiopathic intracranial hypertension. A prospective study of 50 patients. Brain. 1991; 114 (pt 1A): 155–180. - PubMed
-
- Hayreh SS. Optic disc edema in raised intracranial pressure. V. Pathogenesis. Arch Ophthalmol. 1977; 95: 1553–1565. - PubMed
-
- Tso MOM,, Hayreh SS. Optic disc edema in raised intracranial pressure. III. A pathologic study of experimental papilledema. Arch Ophthalmol. 1977; 95: 1448–1457. - PubMed
-
- Corbett JJ,, Jacobson DM,, Mauer RC,, Thompson HS. Enlargement of the blind spot caused by papilledema. Am J Ophthalmol. 1988; 105: 261–265. - PubMed
Publication types
MeSH terms
Substances
Associated data
Grants and funding
LinkOut - more resources
Full Text Sources
Other Literature Sources
Medical
