Review
. 2016 Aug;283(16):2987-3001.
doi: 10.1111/febs.13698. Epub 2016 Mar 24.

AMP-activated protein kinase: a cellular energy sensor that comes in 12 flavours

Affiliations
Review

AMP-activated protein kinase: a cellular energy sensor that comes in 12 flavours

Fiona A Ross et al. FEBS J. 2016 Aug.

Abstract

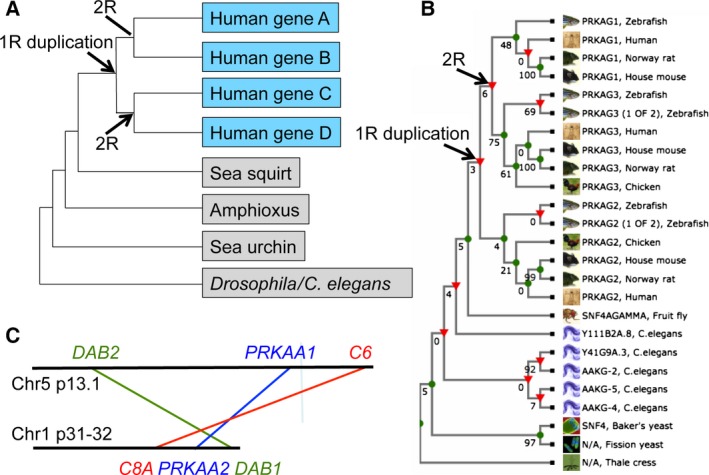
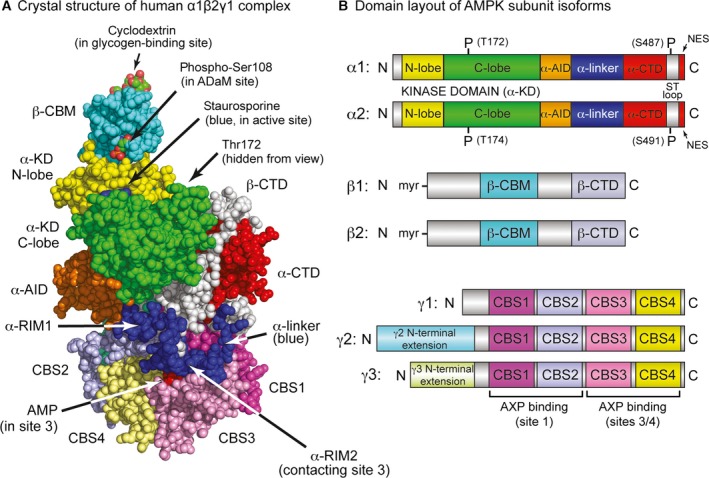
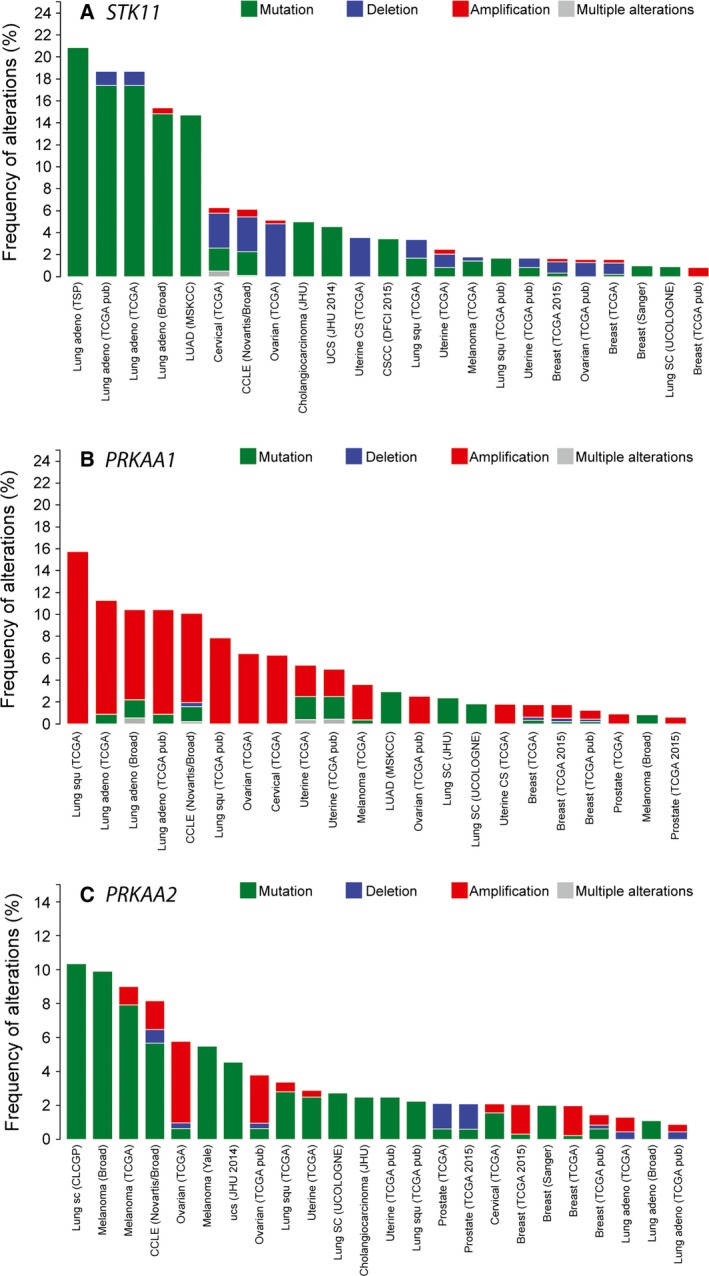
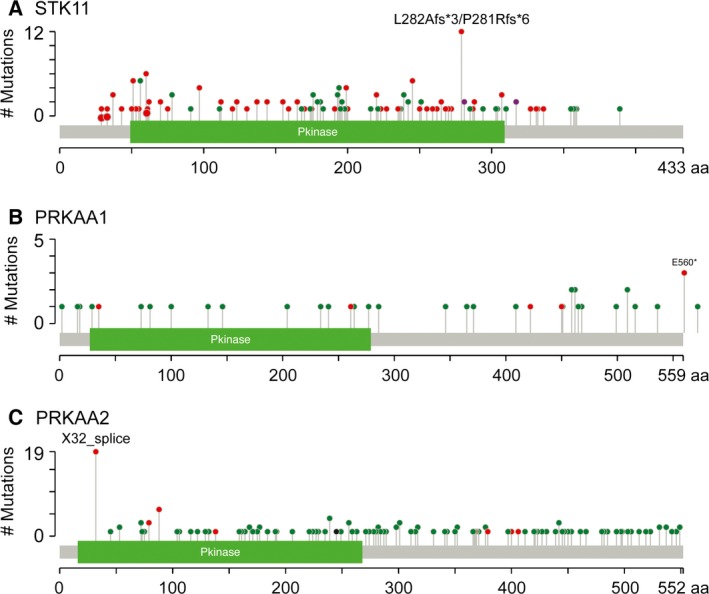
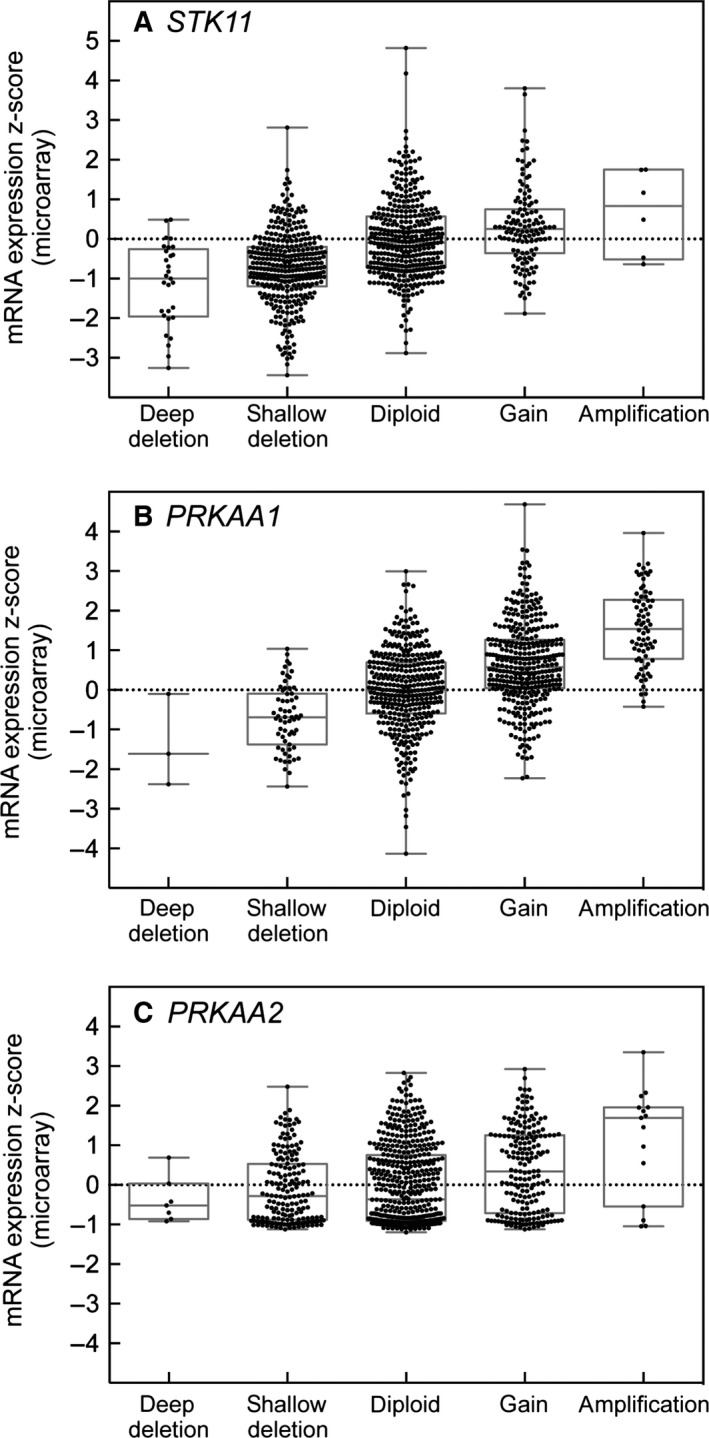
The AMP-activated protein kinase (AMPK) is a sensor of cellular energy status that is expressed in essentially all eukaryotic cells, suggesting that it arose during early eukaryotic evolution. It occurs universally as heterotrimeric complexes containing catalytic α subunits and regulatory β and γ subunits. Although Drosophila melanogaster contains single genes encoding each subunit, in mammals, each subunit exists as multiple isoforms encoded by distinct genes, giving rise to up to 12 heterotrimeric combinations. The multiple isoforms of each subunit are 2R-ohnologues generated by the two rounds of whole genome duplication that occurred at the evolutionary origin of the vertebrates. Although the differential roles of these isoform combinations remain only partly understood, there are indications that they may have different subcellular locations, different inputs and outputs, and different functions. The multiple isoforms are of particular interest with respect to the roles of AMPK in cancer because the genes encoding some isoforms, such as PRKAA1 and PRKAB2 (encoding α1 and β2), are quite frequently amplified in tumour cells, whereas the genes encoding others, such as PRKAA2 (encoding α2), tend to be mutated, which, in some but not all cases, may result in a loss of function. Thus, although AMPK acts downstream of the tumour suppressor liver kinase B1, and some of its isoform combinations may act as tumour suppressors that restrain the growth and proliferation of tumour cells, other isoform combinations may paradoxically act as oncogenes, perhaps by aiding the survival of tumour cells undergoing environmental stresses such as hypoxia or nutrient deprivation.

Keywords: 2R-ohnologue; AMP-activated protein kinase; LKB1; adenine nucleotides; cancer; energy homeostasis; oncogene; tumour suppressor.


Figures

Figure 1
Figure 1
Results supporting the assignments of human AMPK subunits as members of 2R‐ohnologue families. (A) An idealized phylogenetic tree for a family of four human 2R‐ohnologues. (B) A phylogenetic cladogram derived from TreeFam (family TF313247) (http://www.treefam.org) 81 shows that the human PRKAG1, PRKAG2 and PRKAG3 proteins cluster into three paralogy groups. Although some nodes have low bootstrap values, the tree topology is consistent with a single invertebrate pro‐orthologue giving rise to two genes in the 1R during early vertebrate evolution: one of these genes then generated PRKAG1 and PRKAG3 in the 2R, whereas duplication of the other generated PRKAG2 and a fourth gene that has been lost (no PRKAG1 gene could be identified in chickens). A third genomic duplication (3R) that occurred in the last common ancestor of the teleost fish may explain the additional PRKAG2 and PRKAG3 genes in zebrafish. Draft sequences of pro‐orthologues of AMPK subunits in B. floridae (an amphioxus species) have the UniProt identifiers: alpha (C3YCL4), beta (C3Y0T7) and gamma (C3YBW1). (C) Simplified map of the regions of chromosomes 5 and 1 that share synteny and contain the PRKAA1 and PRKAA2 genes, respectively; DAB2 and DAB1 and C6 and C8A are also pairs of 2R‐ohnologues.
Figure 2
Figure 2
(A) Structure of the human α1β2γ1 complex and (B) domain diagrams for the human subunit isoforms. Atomic coordinates in (A) are from Protein Data Bank entry: 4RER 21 and the model was rendered in space‐filling mode in pymol, version 1.7.4.2 (Schrödinger, LLC, New York, NY, USA). The glycogen‐binding and catalytic sites in this structure are occupied by β‐cyclodextrin (C atoms, green; O, red) and staurosporine (blue); the ADaM site was empty but the position of phospho‐Ser108 (C, green; O, red) indicates its location. AMP was bound in sites 1, 3 and 4, although only that in site 3 is visible (red); the other two are around the back of the γ subunit in this view. Phospho‐Thr172 is also round the back in this view. The domain diagrams in (B) are drawn approximately to scale; domains referred to in the text are given similar colour coding in (A) and (B).
Figure 3
Figure 3
Frequency of alterations in (A) STK11 (encoding LKB1), (B) PRKAA1 (encoding AMPK‐α1) and (C) PRKAA2 (encoding AMPK‐α2) displayed using cBioPortal [66,67] . Data are from a selected group of 43 cancer genome studies, and only those with alterations are displayed. Note how the alterations in STK11 are most frequently mutations (although deletions are particularly prevalent in cervical, ovarian and uterine cancers), whereas PRKAA1 is quite frequently amplified. With some exceptions, alterations in PRKAA2 are mostly mutations, and the frequency is lower (note different scales on the y‐axes).
Figure 4
Figure 4
Summary of nonsynonomous mutations in (A) STK11, (B) PRKAA1 and (C) PRKAA2 in the same set of cancer studies as in Fig. 3. Red dots indicate the positions of nonsense, frameshift or splicing mutations that would give rise to truncated or aberrantly spliced proteins, whereas green dots are the positions of missense mutations, which are less likely to cause a loss of function.
Figure 5
Figure 5
Correlation between deletion or amplification of the (A) STK11, (B) PRKAA1 and (C) PRKAA2 genes and mRNA expression by micro‐array (Z‐scores). ‘Deep’ and ‘shallow’ deletions most likely indicate homozygous and heterozygous gene loss, whereas ‘gain’ and ‘amplification’ indicate moderate and substantial gene amplification, assigned using analysis of single nucleotide polymorphism arrays. Data were from the Cancer Cell Line Encyclopedia 68 and were visualized using box and whisper plots; the boxes show the median and the 25th and 75th percentiles, whereas the whispers show the top and bottom values. Note that, with STK11, there is a high proportion of ‘shallow’ and a significant proportion of ‘deep’ deletions, which shows some correlation with mRNA expression. By contrast, with PRKAA1, there is a high proportion of ‘gains’ and a significant proportion of ‘amplifications’, which also show a clear correlation with mRNA expression. With PRKAA2, there is no significant bias towards amplification or deletion or to a change in expression at the mRNA level.

References

    1. Hardie DG (2015) Molecular pathways: is AMPK a friend or a foe in cancer? Clin Cancer Res 21, 3836–3840. - PMC - PubMed
    1. Hardie DG (2014) AMPK–sensing energy while talking to other signaling pathways. Cell Metab 20, 939–952. - PMC - PubMed
    1. Hardie DG, Schaffer BE & Brunet A (2016) AMPK: an energy‐sensing pathway with multiple inputs and outputs. Trends Cell Biol 26, 190–201. - PMC - PubMed
    1. Pan DA & Hardie DG (2002) A homologue of AMP‐activated protein kinase in Drosophila melanogaster is sensitive to AMP and is activated by ATP depletion. Biochem J 367, 179–186. - PMC - PubMed
    1. Stapleton D, Mitchelhill KI, Gao G, Widmer J, Michell BJ, Teh T, House CM, Fernandez CS, Cox T, Witters LA et al (1996) Mammalian AMP‐activated protein kinase subfamily. J Biol Chem 271, 611–614. - PubMed

Publication types

MeSH terms

LinkOut - more resources