. 2016 Mar 10;531(7593):253-7.
doi: 10.1038/nature16969. Epub 2016 Mar 2.

NAFLD causes selective CD4(+) T lymphocyte loss and promotes hepatocarcinogenesis

Affiliations

NAFLD causes selective CD4(+) T lymphocyte loss and promotes hepatocarcinogenesis

Chi Ma et al. Nature. .

Abstract

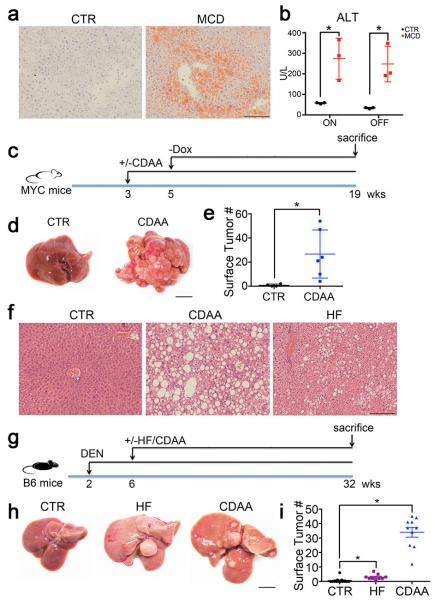
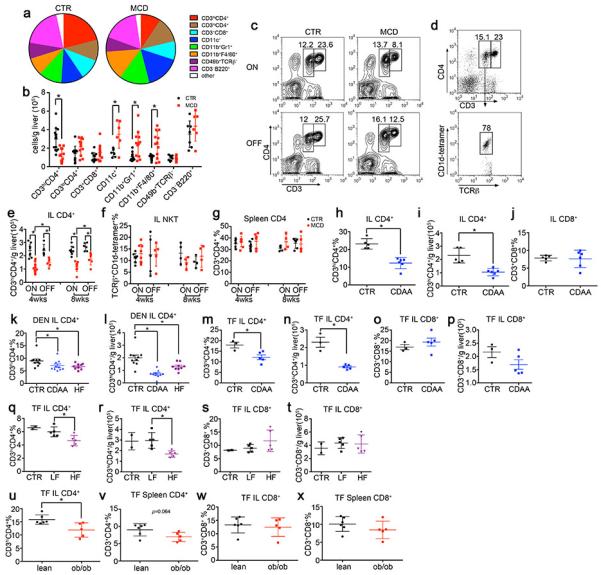
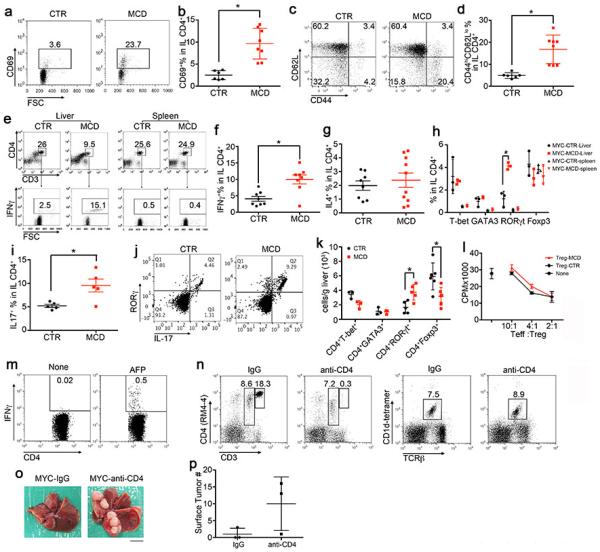
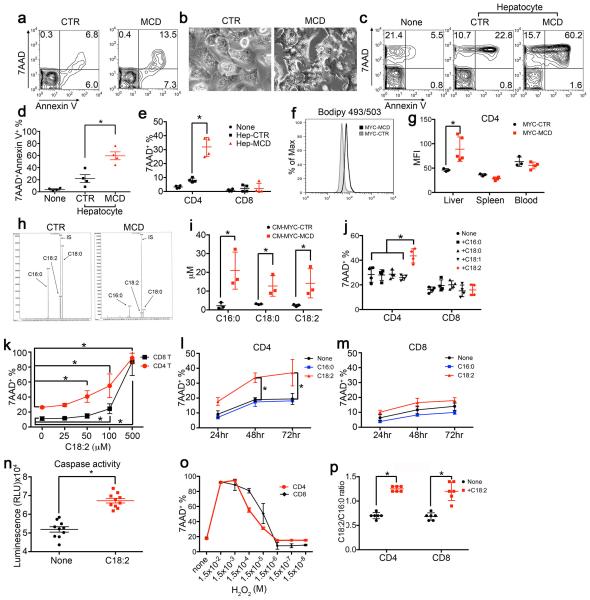
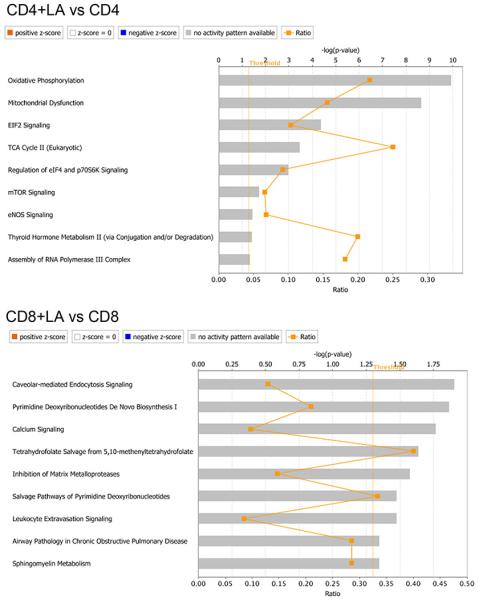
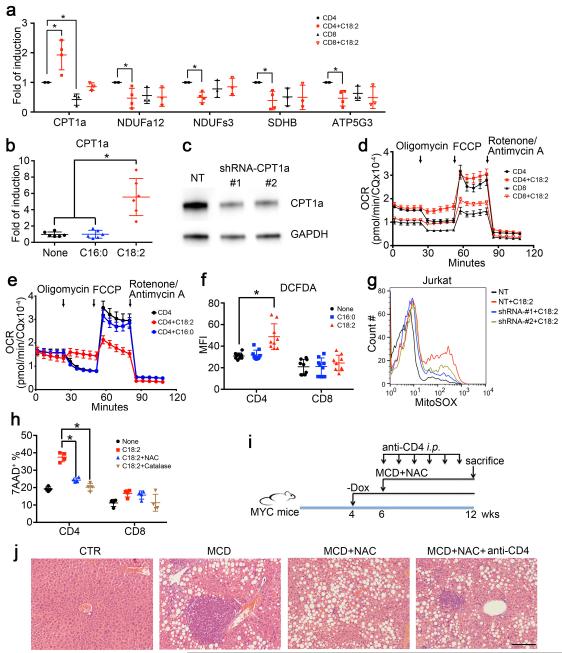
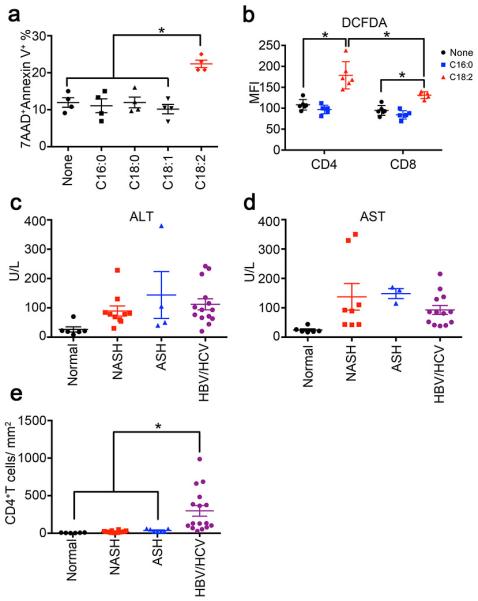
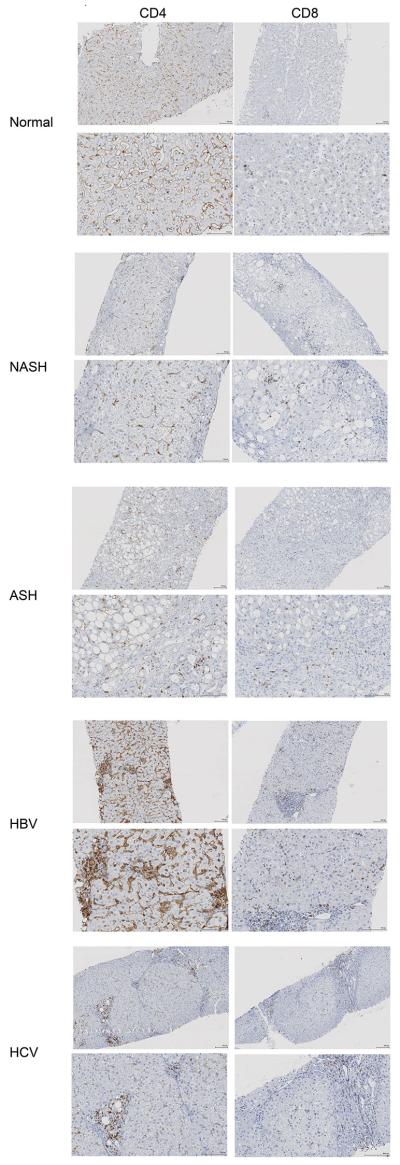
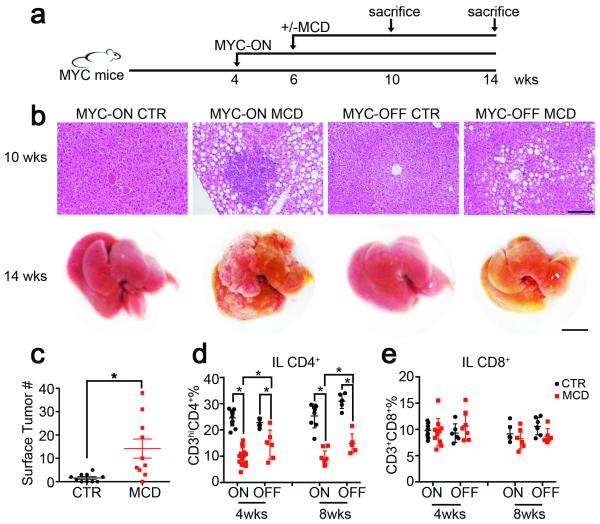
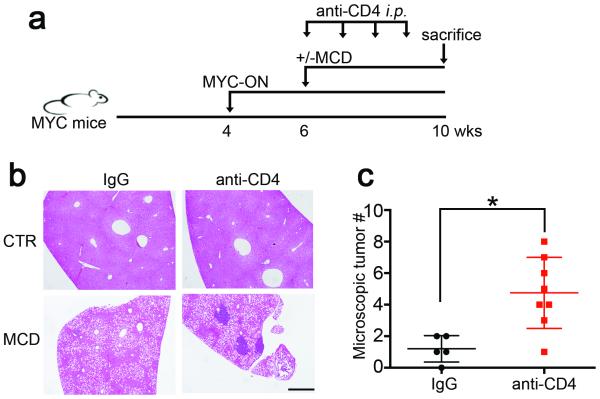
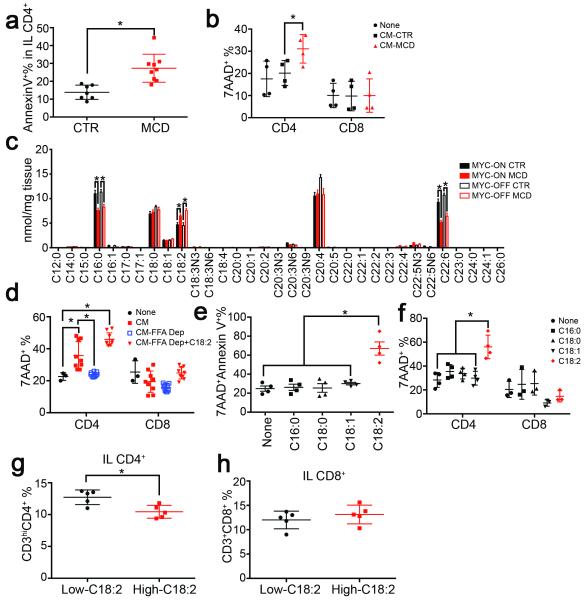
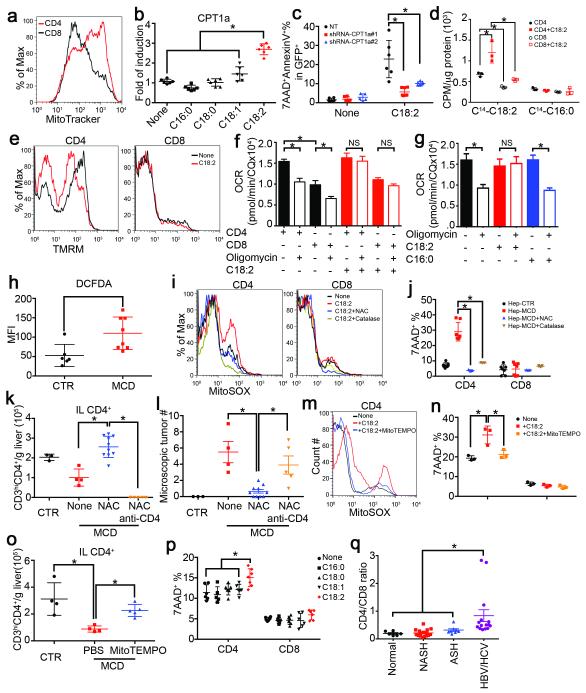
Hepatocellular carcinoma (HCC) is the second most common cause of cancer-related death. Non-alcoholic fatty liver disease (NAFLD) affects a large proportion of the US population and is considered to be a metabolic predisposition to liver cancer. However, the role of adaptive immune responses in NAFLD-promoted HCC is largely unknown. Here we show, in mouse models and human samples, that dysregulation of lipid metabolism in NAFLD causes a selective loss of intrahepatic CD4(+) but not CD8(+) T lymphocytes, leading to accelerated hepatocarcinogenesis. We also demonstrate that CD4(+) T lymphocytes have greater mitochondrial mass than CD8(+) T lymphocytes and generate higher levels of mitochondrially derived reactive oxygen species (ROS). Disruption of mitochondrial function by linoleic acid, a fatty acid accumulated in NAFLD, causes more oxidative damage than other free fatty acids such as palmitic acid, and mediates selective loss of intrahepatic CD4(+) T lymphocytes. In vivo blockade of ROS reversed NAFLD-induced hepatic CD4(+) T lymphocyte decrease and delayed NAFLD-promoted HCC. Our results provide an unexpected link between lipid dysregulation and impaired anti-tumour surveillance.


Figures

Extended Data Figure 1
MCD, CDAA and HF diet induce NASH and promote HCC. a, Representative imagines of Oil Red O staining of MYC-ON mice fed MCD or CTR. Black bar = 100 μm. b, Serum ALT levels analysis. Mean ± SEM; n=4, *p<0.05, one-way ANOVA. c-e, The effect of CDAA diet on tumor development in MYC transgenic mice. Experimental set-up, representative liver images and liver surface tumor counts are shown. Black bar=10 mm. Mean ± SEM; n= 6 for CDAA and n=5 mice for CTR, p=0.0345, Student’s t test. f-i, The effect of CDAA and HF diet on liver carcinogenesis in DEN-injected C57BL/6 mice. Experimental set-up, representative tumor-free H&E stainings, macroscopic liver images and surface tumor counts are shown. Black bar=100 μm. Mean ± SEM; n=13 for CTR, n=9 for HF, n=10 for CDAA, *p<0.05, one-way ANOVA.
Extended Data Figure 2
Immune cell monitoring in NAFLD-HCC. MYC mice were fed with MCD diet or CTR diet. Intrahepatic immune cells were determined by flow cytometry, a, composition and b, absolute numbers of different intrahepatic immune cell subsets in MYC-ON mice, which were kept for 4 weeks on MCD diet or CTR diet. Mean ± SEM; n≥6, *p<0.05, one-way ANOVA. c, Representative contour plots of intrahepatic CD4+ T lymphocytes. d, Representative dot plots of CD1d-tetramer staining in CD3loCD4+ population. e-g, Absolute number of intrahepatic CD4+ T lymphocytes, frequencies of NKT cells and splenic CD4+ T lymphocytes were measured by flow cytometry. Mean ± SEM; n=4, *p<0.05, two-way ANOVA. h-j, Intrahepatic CD4+ and CD8+ T lymphocyte levels in MYC-ON mice fed with CDAA diet for 16 weeks. Mean ± SEM; n=6 for CDAA and n=5 for CTR, *p<0.05, Student’s t test. k, l, Intrahepatic CD4+ T lymphocyte levels in DEN-injected BL/6 male mice treated with CDAA diet, HF diet or CTR for 7 months. Mean ± SEM; n=13 for CTR, n=9 for HF, n=10 for CDAA, *p<0.05, one-way ANOVA. m-p, Intrahepatic CD4+ and CD8+ T lymphocytes in tumor free C57BL/6 mice treated with CDAA diet for 16 weeks. TF: tumor free; Mean ± SEM; n=3 for CTR, n=5 for CDAA, *p<0.05, Student’s t test. q-t, Intrahepatic CD4+ and CD8+ T lymphocytes in tumor free C57BL/6 mice treated with HF or LF diet for 6 months. Mean ± SEM; n=2 for CTR, n=5 for LF, n=5 for HF, *p<0.05, one-way ANOVA. u-x, CD4+ and CD8+ T lymphocytes in 12-week old male ob/ob or wild type lean mice. Mean ± SEM, n=5, *p<0.05, Student’s t test w, x, MYC mice were fed with MCD or CTR. Macrophage and CD11b+Gr1+ populations were measured. Mean ± SEM; n≥4, *p<0.05, two-way ANOVA.
Extended Data Figure 3
Intrahepatic CD4+ lymphocytes are activated in NAFLD, and CD4 depletion enhances HCC. MYC-ON mice were fed with MCD or CTR for 4 weeks. a-d, CD69 and CD44hiCD62Llo subsets in intrahepatic CD4+ T lymphocytes were measured. Mean ± SEM; n=8 for MCD and n=6 for CTR, *p<0.05, Student’s t test. e-g. Ex vivo IFNγ, IL4 production in intrahepatic CD4+ T lymphocytes were determined. Mean ± SEM; n=8, *p<0.05, Student’s t test. h, Ex vivo staining of T-bet, GATA3, RORγt and Foxp3 levels in intrahepatic and splenic CD4+ T lymphocytes. Mean ± SEM; n=3, *p<0.05, two-way ANOVA. i, Ex vivo IL17 production by intrahepatic CD4+ T lymphocytes. Mean ± SEM; n=5, *p<0.05, Student’s t test. j, Representative dot plots of RORγt/IL17 staining in intrahepatic CD4+ T lymphocytes. k, Absolute number of intrahepatic CD4+ lymphocyte subsets. Mean ± SEM; n=3, *p<0.05, two-way ANOVA. l, Suppressive function assay of isolated hepatic Tregs from Foxp3-GFP mice kept on MCD or CTR for 4 weeks. m, Detection of AFP-specific CD4+ T lymphocytes in spleen from MYC-MCD mice. n, Selective depletion of intrahepatic CD4+ T lymphocytes but not NKT by i.p. injection of 50 μg GK1.5. o, p, MYC-on mice on CTR received 50 μg of GK1.5 antibody or isotype control i.p. once per week for 8 weeks. Representative liver imagines and surface tumor counts are shown. Black bar=10 mm. Mean ± SEM, n=3.
Extended Data Figure 4
Lipid-laden hepatocytes release linoleic acid and induce CD4+ T lymphocyte death via apoptosis. a, Representative contour plots of ex vivo 7AAD/Annexin V staining of intrahepatic CD4+ T lymphocytes from MYC-ON mice fed with MCD or CTR. b, Representative phase-contrast images of primary hepatocytes from MYC-ON mice after MCD or CTR treatment. c-e, Isolated primary hepatocytes from MYC-ON mice on MCD or CTR were cocultured with isolated CD4+ T lymphocytes or splenocytes. Cell death levels were measured by flow cytometry. Mean ± SEM; n=4, one-way or two-way ANOVA. f, g, BODIPY 493/503 staining of CD4+ T lymphocytes in liver, spleen or blood from MYC-ON mice with MCD or CTR. Mean ± SEM; n=4, *p<0.05, two-way ANOVA. h,i, Identification of free fatty acids in hepatocyte conditioned medium by GC/MS. Mean ± SEM; n=3, *p<0.05, two-way ANOVA. j, Anti-CD3/28 beads-activated splenocytes were treated with different free fatty acids, and cell death level in CD4+ or CD8+ T lymphocytes were determined. Mean ± SEM; n=4, *p<0.05, two-way ANOVA. k-m, Dose-response curve and time course of linoleic acid-induced cell death in CD4+ or CD8+ T lymphocytes. n, caspase3/7 activity in CD4+ lymphocytes after linoleic acid treatment. Mean ± SEM; n=9, *p<0.05, Student’s t test. o, Dose-response curve of H2O2-induced cell death in CD4+ or CD8+ T lymphocytes. p, Uptake of linoleic acid by CD4+ and CD8+ T lymphocytes after incubation with 50 μM linoleic acid for 2 hrs. Mean ± SEM; n=6, *p<0.05. two-way ANOVA.
Extended Data Figure 5
Ingenuity pathway analysis of microarray data. CD4+ and CD8+ T lymphocytes sorted from linoleic acid-treated splenocytes were subjected to microarray analysis. Pathway analysis was done by IPA. n=3. Ratio= number of changed genes divided by total genes in the pathway.
Extended Data Figure 6
Mitochondrial ROS mediates linoleic acid-induced CD4+ T lymphocyte death in vitro and in vivo. a, Real-time PCR confirmed the gene changes from microarray. Mean ± SEM; n=3, *p<0.05, two-way ANOVA. b, CPT1a mRNA level in Jurkat cells after fatty acid treatment. Mean ± SEM; n=6, *p<0.05, one-way ANOVA. c, Expression of CPT1a in wild type and two knockdown Jurkat cells. NT: none-targeting control. d, e, OCR analysis of activated CD4+ and CD8+ T lymphocytes upon linoleic acid or palmitic acid incubation. f, ROS levels of CD4+ or CD8+ T lymphocytes in splenocytes treated with linoleic acid or palmitic acid. Mean ± SEM; n=8, *p<0.05, two-way ANOVA. g, Mitochondrial ROS in wild type and two CPT1 knockdown Jurkat cells. i, Cell death of CD4+ or CD8+ T lymphocytes in splenocytes treated with linoleic acid at the presence of NAC or catalase. Mean ± SEM; n=4, *p<0.05, two-way ANOVA. i, j, In vivo blocking ROS with NAC in MYC-ON mice treated with MCD. Some mice also received CD4 antibody depletion. Experimental setup and representative H&E liver sections are shown. Black bar= 200 μm.
Extended Data Figure 7
Linoleic acid induces cell death in human CD4+ T lymphocytes, and NASH patients have lower intrahepatic CD4+ T lymphocytes. a, Cell death levels of sorted human CD4+ T lymphocytes treated with different free fatty acids. Mean ± SEM; n=4 *p<0.05, one-way ANOVA. b, ROS level of CD4+ or CD8+ T lymphocyte in PBMC treated with linoleic acid or palmitic acid. Mean ± SEM; n=6 *p<0.05, two-way ANOVA. c,d, serum ALT and AST concentration in different patients. e, Intrahepatic CD4+ T lymphocyte count in biopsies. CD4+ T lymphocytes were identified by immunohistochemistry. Mean ± SEM; normal=6, NASH=16, ASH=8, HBV/HCV=16, *p<0.05, one-way ANOVA.
Extended Data Figure 8
Immunohistochemistry staining of intrahepatic CD4+ or CD8+ T lymphocytes in patient biopsies. Representative CD4 or CD8 immunohistochemistry images of liver biopsies from healthy individuals, NASH, ASH patients or patients with HBV or HCV. For each condition, two different magnifications are shown. Black bar =100 μm.
Figure 1
Figure 1
NAFLD induces a selective loss of intrahepatic CD4+ T lymphocytes and promotes HCC. a, Experimental set-up. b, Upper panel: representative H&E liver sections. Black bar = 100 μm. Lower panel: representative liver images. Black bar= 10 mm. c, Liver surface tumor counts (CTR=control diet, n=10 for CTR, 17 for MCD , p=0.0067, Student’s t test,). d, e, Intrahepatic CD4+ T lymphocytes (IL CD4+) and intrahepatic CD8+ T lymphocytes (IL CD8+) were measured by flow cytometry (n=12 for ON-CTR 4wks, 15 for ON-MCD 4wks, 6 for OFF-CTR 4wks, 6 for OFF-MCD 4wks, 8 for ON-CTR 8wks, 9 for ON-MCD 8wks, 6 for OFF-CTR 8wks, 6 for OFF-MCD 8wks *p<0.05, two-way ANOVA). All data are Mean ± SEM.
Figure 2
Figure 2
Depletion of intrahepatic CD4+ T lymphocytes accelerates tumor development in MYC-ON MCD mice. a, Experimental set-up. b, c, Representative H&E staining images and microscopic tumor counts. Black bar = 200 μm. Mean ± SEM; n=5 for IgG, 8 for anti-CD4, *p<0.05, Student’s t test.
Figure 3
Figure 3
Lipid-laden hepatocytes cause CD4+ T lymphocyte death through releasing C18:2. a, Ex vivo cell death of intrahepatic CD4+ T lymphocytes from MYC-ON NAFLD mice. (n=7 for CTR, 9 for MCD, Student’s t test). b, Lymphocyte survival after incubation with hepatocyte conditioned medium (CM) (n=4, two-way ANOVA). c, Hepatic total FFA composition analysis (n=6, *p<0.05, ANOVA). d, FFA depletion (Dep) from conditioned medium (n=3 for None, 9 for other treatments; two-way ANOVA). e, f, Lymphocyte survival after FFA treatment (n=4, one-way ANOVA). g, h, CD4+ and CD8+ T lymphocytes in high or low-C18:2 diet fed mice (n=5, Student’s t test). All data are Mean ± SEM, *p<0.05.
Figure 4
Figure 4
Mitochondrial ROS mediates C18:2-induced CD4+ T lymphocyte death. a, Mitochondrial mass analysis. b, CPT1a mRNA levels in FFA-treated CD4+ T lymphocytes (n=6). c, CPT1a knockdown on C18:2-induced Jurkat cell death (n=6). d, Oxidation rate of C18:2 or C16:0 in lymphocytes (n=3). e, Mitochondrial membrane potential in C18:2-treated lymphocytes. f, g, Oxygen consumption rate assay of activated CD4+ and CD8+ T lymphocytes treated with FFAs (n=8). h, Ex vivo ROS levels of intrahepatic CD4+ T lymphocytes (n=6 for CTR, 8 for MCD). i, Mitochondrial ROS levels in lymphocytes. j, Effect of NAC or catalase on hepatocyte-caused lymphocyte death (n=7). Hep: hepatocytes. k, l, In vivo effect of NAC treatment on intrahepatic CD4+ T lymphocytes and tumor development (n=3 for CTR, 4 for MCD, 10 for MCD+NAC, 5 for MCD+NAC+anti-CD4). m-o, MitoTEMPO treatment, mitochondrial ROS and survival in CD4+ T lymphocytes in vitro and in vivo (n=4 for CTR, 4 for MCD+PBS, 5 for MCD+MitoTEMPO). p, Human lymphocyte survival after FFA treatment (n=6). q, CD4/CD8 ratio of intrahepatic T lymphocytes in patient biopsies (n=6 for Normal, 16 for NASH, 8 for ASH, 15 for HBV/HCV). All data are Mean ± SEM, *p<0.05, one-way or two-way ANOVA analysis was used.

Comment in

Similar articles

Cited by

References

    1. European Association For The Study Of The, L. European Organisation For, R. & Treatment Of, C. EASL-EORTC clinical practice guidelines: management of hepatocellular carcinoma. J Hepatol. 2012;56:908–943. doi: 10.1016/j.jhep.2011.12.001. - DOI - PubMed
    1. Sun B, Karin M. Obesity, inflammation, and liver cancer. J Hepatol. 2012;56:704–713. doi: 10.1016/j.jhep.2011.09.020. - DOI - PMC - PubMed
    1. Michelotti GA, Machado MV, Diehl AM. NAFLD, NASH and liver cancer. Nature reviews. Gastroenterology & hepatology. 2013;10:656–665. doi: 10.1038/nrgastro.2013.183. - DOI - PubMed
    1. Schuppan D, Schattenberg JM. Non-alcoholic steatohepatitis: pathogenesis and novel therapeutic approaches. J Gastroenterol Hepatol. 2013;28(Suppl 1):68–76. doi: 10.1111/jgh.12212. - DOI - PubMed
    1. Wree A, Broderick L, Canbay A, Hoffman HM, Feldstein AE. From NAFLD to NASH to cirrhosis-new insights into disease mechanisms. Nature reviews. Gastroenterology & hepatology. 2013;10:627–636. doi: 10.1038/nrgastro.2013.149. - DOI - PubMed

Additonal References for Methods

    1. Andersson J, et al. CD4+ FoxP3+ regulatory T cells confer infectious tolerance in a TGF-beta-dependent manner. J Exp Med. 2008;205:1975–1981. doi: 10.1084/jem.20080308. - DOI - PMC - PubMed
    1. Nakagawa H, et al. ER stress cooperates with hypernutrition to trigger TNF-dependent spontaneous HCC development. Cancer Cell. 2014;26:331–343. doi: 10.1016/j.ccr.2014.07.001. - DOI - PMC - PubMed
    1. Ikehara Y, et al. CD4(+) Valpha14 natural killer T cells are essential for acceptance of rat islet xenografts in mice. J Clin Invest. 2000;105:1761–1767. doi: 10.1172/JCI8922. - DOI - PMC - PubMed
    1. Hanczko R, et al. Prevention of hepatocarcinogenesis and increased susceptibility to acetaminophen-induced liver failure in transaldolase-deficient mice by N-acetylcysteine. J Clin Invest. 2009;119:1546–1557. doi: 10.1172/JCI35722. - DOI - PMC - PubMed
    1. Radaeva S, et al. Interferon-alpha activates multiple STAT signals and down-regulates c-Met in primary human hepatocytes. Gastroenterology. 2002;122:1020–1034. - PubMed

Publication types

MeSH terms

Associated data