. 2016 Apr 5;7(14):18736-49.
doi: 10.18632/oncotarget.7702.

Inhibition of IRE1α-driven pro-survival pathways is a promising therapeutic application in acute myeloid leukemia

Affiliations

Inhibition of IRE1α-driven pro-survival pathways is a promising therapeutic application in acute myeloid leukemia

Haibo Sun et al. Oncotarget. .

Erratum in

Abstract

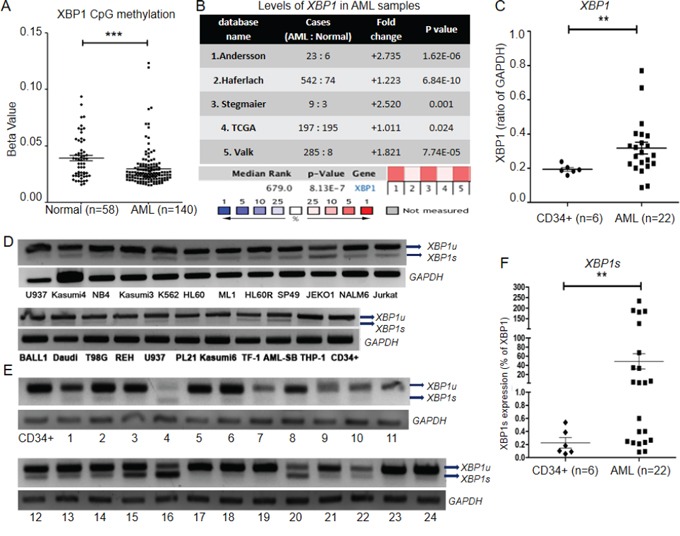
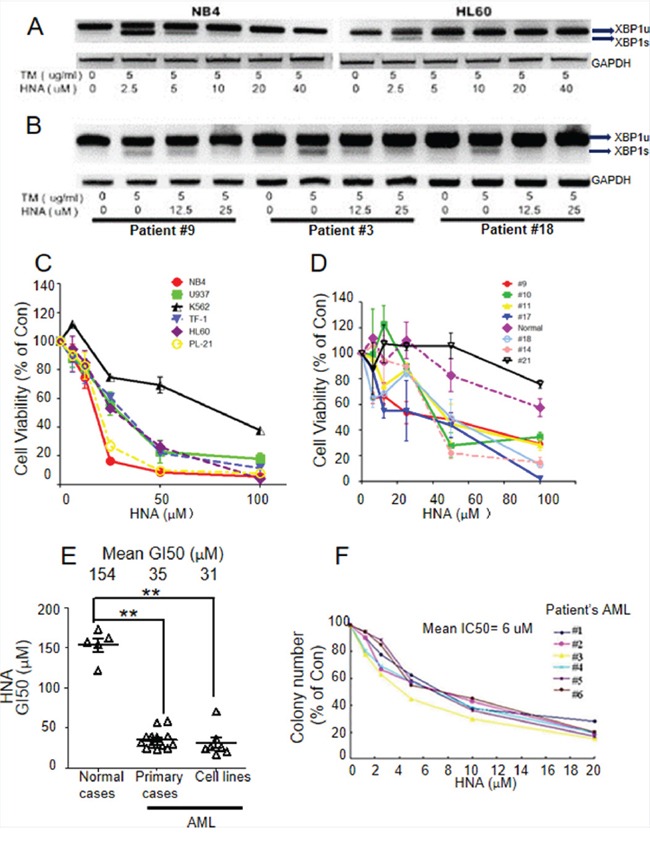
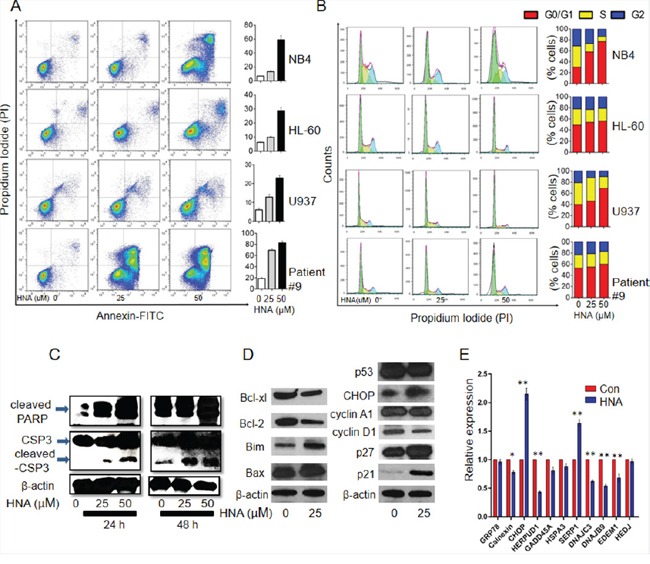
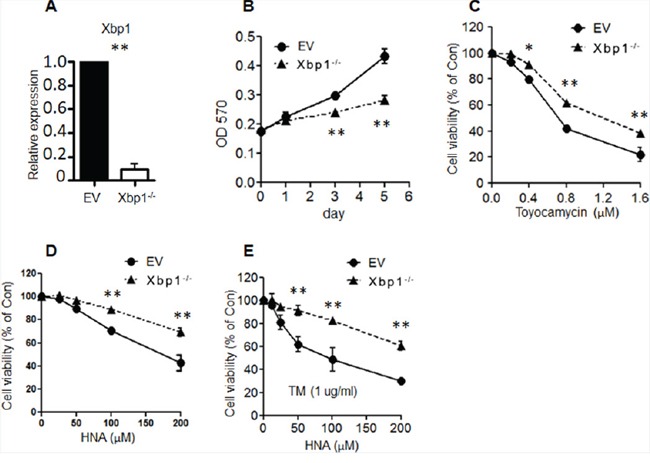
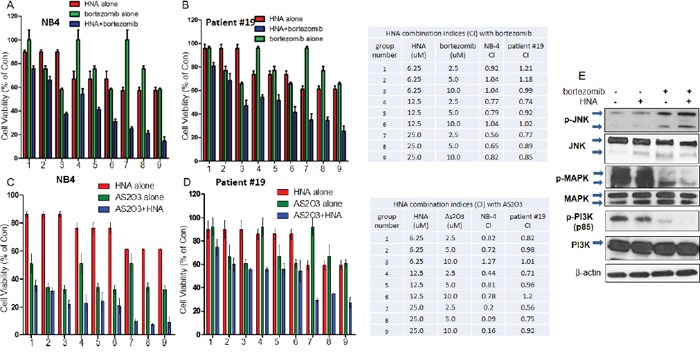
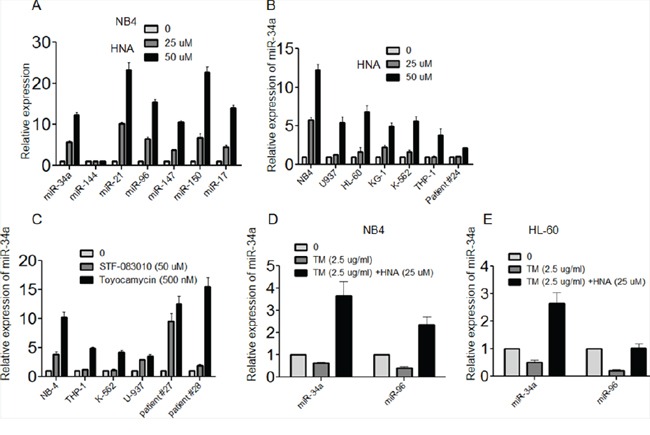
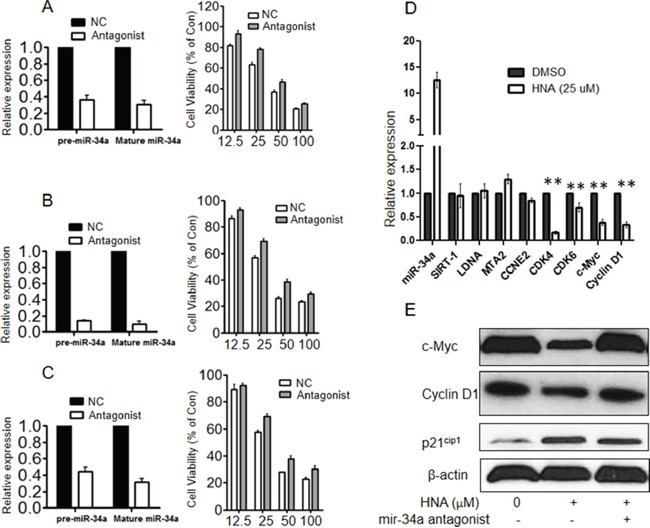
Survival of cancer cells relies on the unfolded protein response (UPR) to resist stress triggered by the accumulation of misfolded proteins within the endoplasmic reticulum (ER). The IRE1α-XBP1 pathway, a key branch of the UPR, is activated in many cancers. Here, we show that the expression of both mature and spliced forms of XBP1 (XBP1s) is up-regulated in acute myeloid leukemia (AML) cell lines and AML patient samples. IRE1α RNase inhibitors [MKC-3946, 2-hydroxy-1-naphthaldehyde (HNA), STF-083010 and toyocamycin] blocked XBP1 mRNA splicing and exhibited cytotoxicity against AML cells. IRE1α inhibition induced caspase-dependent apoptosis and G1 cell cycle arrest at least partially by regulation of Bcl-2 family proteins, G1 phase controlling proteins (p21cip1, p27kip1 and cyclin D1), as well as chaperone proteins. Xbp1 deleted murine bone marrow cells were resistant to growth inhibition by IRE1α inhibitors. Combination of HNA with either bortezomib or AS2O3 was synergistic in AML cytotoxicity associated with induction of p-JNK and reduction of p-PI3K and p-MAPK. Inhibition of IRE1α RNase activity increased expression of many miRs in AML cells including miR-34a. Inhibition of miR-34a conferred cellular resistance to HNA. Our results strongly suggest that targeting IRE1α driven pro-survival pathways represent an exciting therapeutic approach for the treatment of AML.

Keywords: ER stress; IRE1; XBP1; micro RNA; unfolded protein response.


Conflict of interest statement

CONFLICTS OF INTEREST

The authors declare no conflicts of interest

Figures

Figure 1
Figure 1. XBP1 and XBP1s are up-regulated in AML
A. The methylation status of the CpG islands of XBP1 in normal donors (n=58) and AML samples (n=140) was analyzed using TCGA level 3 database. The p-values were calculated by student t test. B. 5 publicly available microarray databases showed XBP1 was highly expressed in AML samples compared with normal BM samples. 1. Andersson Leukemia [84]; 2. Haferlach [85]; 3. Stegmaier [86]; 4. TCGA [87]; 5. Valk [88]. The rank for a gene is the median rank for that gene across each of the analyses. The p-value refers to the median-ranked analysis. C. QRT-PCR analysis of AML blast cells from patients (n=22) compared with normal human CD34+ cells (n=6) showed significant up-regulation of XBP1, using GAPDH as an internal control (p<0.01). D, E. RT-PCR and gel electrophoresis identified XBP1s activation in human leukemia cell lines (D) and samples from normal (CD34+) and AML blast cells from patients (1-24) (E). F. QRT-PCR analysis of XBP1s expression in AML blast samples from patients (n=22) and normal human CD34+ cells (n=6). Figures are representative example of 3 replicates. Data represent mean ± SD. XBP1s, spliced XBP1.
Figure 2
Figure 2. HNA inhibits XBP1s and causes cytotoxicity of AML cells
A, B. HNA inhibited XBP1s expression induced by tunicamycin (TM) in human AML cells lines (A) and AML blast cells from patients (B). Cells (106) were incubated with indicated concentrations of either TM or TM and 2-hydroxy-1-naphthaldehyde (HNA) in 6-well plates for 6 h. RNA was isolated and RT-PCR was performed to examine XBP1u and XBP1s expression by gel electrophoresis. C, D. Cell viability analysis examined IRE1 inhibitor induced cytotoxicity of human AML cell lines (C) and AML blast samples from normal and AML patients (D). Cells (10,000) were added into 96-well plates followed by exposure to various concentrations of HNA. Cell viability (MTT assay) was examined 72 h later. E. Concentration for 50% of maximal inhibition of cell proliferation (GI50) of HNA for 15 AML patient samples and 7 AML cell lines (NB4, U937, K-562, TF-1, HL-60, PL-21 and THP-1) calculated from data shown in Figures 2C and 2D. “Con”, untreated control. The GI50s were calculated by Graphpad software. F. Soft agar clonogenic assays of 6 AML patient samples exposed to HNA. Figures are representative example of 3 replicates. GI50s were calculated. Data represent mean ± SD, n=3.
Figure 3
Figure 3. IRE1α inhibition induced apoptosis and G1 cell cycle arrest in AML cells
A. AML cells (NB4, HL-60, U937 and AML patient sample #9) were treated with HNA (25μM, 50μM) for 24 h and Annexin/PI assays were conducted to evaluate HNA induced apoptosis. Right side bar graphs show percent apoptotic cells (positive Annexin V + PI) in each treatment group. B. AML cells (NB4, HL-60, U937 and AML patient sample #9) were treated with HNA (25μM and 50μM) for 24 h and stained with PI. Cell cycle was analyzed by Flowjo software. Right panel, bar graphs displayed cell cycle phase distribution in each treatment group. Cells cultured with diluent were used as control (Con). C. NB4 cells were treated with HNA (25 μM, 50 μM) for either 24 or 48 h and western blotting evaluated expression of cleaved PARP and cleaved caspase-3. β-actin was used as loading control. D, E. NB4 cells were treated with HNA (25 μM, 48 h) and expression of Bcl-2 family and cell cycle associated proteins were evaluated by western blotting (β-actin, loading control) (D); mRNA levels of chaperone genes were measured by QRT-PCR (E). Relative expression of each gene was normalized to GAPDH mRNA; and for each gene, control levels were considered to be 1.0. Figures (A, B, E) are representative example of 3 replicates. Data represent mean ± SD, n=3.
Figure 4
Figure 4. Knock-out Xbp1 induced myeloid cell resistance to IRE1 inhibitors
A. Xbp1 flox/flox murine bone marrow cells were infected with a retroviral vector that expressed either the Cre recombinase or empty vector (EV); these cells were stably selected with G418 followed by addition of 4-OHT (1μM) for two days to obtain either Cre-mediated Xbp1 knock-out (Xbp1−/−) or empty vector (EV) Xbp1fl/fl myeloid cells. QRT-PCR was performed to measure knock-out effenciency of Xbp1. B. Xbp1−/− and EV marrow cells (1,000) were seeded into 96-well plates, and cell proliferation was measured on days 1, 3 and 5. (MTT assay) (n=3). C-E. Xbp1−/− and EV marrow cells were (1,000) seeded into 96-well plates and followed by treatment with increasing concentrations of IRE1 inhibitor [Toyocamycin alone (C); HNA alone (D); HNA or TM plus HNA (E)]. After 72h, cell viability was measured (MTT assay). Data represent mean ± SD, n=3.
Figure 5
Figure 5. Combination of HNA with either bortezomib or AS2O3 NB4
A, C. or #19 primary AML blast cells B, D. were seeded (10,000) in 96-well plates and treated with HNA (0, 6.25, 12.5 and 25 μM) and/or bortezomib (0, 2.5, 5, 10 μM) (A, B) or HNA and/or AS2O3 (0, 2.5, 5, 10 μM) (C, D) for 72 h; and cell viability was measured (MTT assay). Data are presented as percentage of diluent treatment control (Con). Data represent mean ± SD, n=3. CI (<1, synergistic; =1, additive; >1, antagonistic). E. NB4 cells were treated with HNA (25 μM) and/or botezomib (5 μM) for 48 h, and expression of total and phosphorylated (p-) JNK, MAPK and PI3K were evaluated by western blotting (β-actin, loading control).
Figure 6
Figure 6. Inhibition of IRE1α increased expression of miRs in AML cells
A. NB4 cells were treated with HNA (0, 25, 50 μM) for 24h and expression of pre-miR- 34, -144, -21, -96, -147 and -150 was measured by QRT-PCR. Cells without HNA were used as control. B. QRT-PCR analysis of pre-miR-34a expression level in NB4, U937, HL-60, KG-1, K-562 and THP-1 AML cell lines and primary AML blast sample #24 upon HNA (25 μM) treatment for 24 h. C. QRT-PCR analysis of pre-miR-34a expression level in NB4, THP-1, K-562 and U937 AML cell lines and primary AML blast cell samples #27 and #28 after exposure to either STF-083010 (50 μM) or Toyocamycin (500 nM) for 24 h. D, E. NB4 or HL-60 cells were treated with either TM (2.5 μg/ml) alone or TM and HNA (25 μM) for 12 h; expression levels of pre-miR-34a and miR-96 were measured by QRT-PCR. Relative expression of each gene was normalized to GAPDH. Data represent mean ± SD, n=3.
Figure 7
Figure 7. Blockade of miR-34a decreased sensitivity of IRE1 inhibitor in vitro
A-C. miR-34a small RNA antagonist or control small RNA were transiently transfected and knock-down efficiencies of either pre-miR-34a or mature miR-34a were evaluated by QRT-PCR in K562 (A, left side), NB4 (B, left side) and U937 (C, left side). At 24 h after transfection, cells (10,000) were seeded into 96-well plates followed by treatment with HNA (0, 12.5, 25, 50 μM) for 72h, and cell viability was measured (MTT assay) (A-C, right side). D. NB4 cells were treated with HNA (25 μM, 24 h) or diluent control. mRNA expression levels of pre-miR-34a, SRRT-1, LDNA, MTA2, CCNE2, CDK4, CDK6, c-Myc and cyclin D1 were measured by QRT-PCR. Relative expression of each gene was normalized to GAPDH. E. At 48 h after transfection of miR-34a antagonist or control siRNA, NB4 cells were treated with HNA (25 μM, 48 h) or diluent control, and protein expressions of c-Myc, cyclin D1 and p21cip1 were evaluated by western blotting (β-actin as loading control). Data represent mean ± SD, n=3.

Similar articles

Cited by

References

    1. Lowenberg B, Downing JR, Burnett A. Acute myeloid leukemia. N Engl J Med. 1999;341:1051–1062. - PubMed
    1. Giles FJ, Keating A, Goldstone AH, Avivi I, Willman CL, Kantarjian HM. Acute myeloid leukemia. Hematology Am Soc Hematol Educ Program. 2002:73–110. - PubMed
    1. Konopleva MY, Jordan CT. Leukemia stem cells and microenvironment: biology and therapeutic targeting. J Clin Oncol. 2011;29:591–599. - PMC - PubMed
    1. Bonnet D, Dick JE. Human acute myeloid leukemia is organized as a hierarchy that originates from a primitive hematopoietic cell. Nat Med. 1997;3:730–737. - PubMed
    1. Chan WI, Huntly BJ. Leukemia stem cells in acute myeloid leukemia. Semin Oncol. 2008;35:326–335. - PubMed

Publication types

MeSH terms